Energy News Beat
The latest WellDatabase US Rig Report for June 26, 2026, shows the U.S. active rig count rising by 1 rig week-over-week to 550. This modest increase bucks a broader pattern of stability over the past year and comes against a backdrop of sharply tightening crude oil inventories—especially at the critical Cushing, Oklahoma hub—and continued draws from the Strategic Petroleum Reserve (SPR).
While the headline number is slightly lower than some other providers, the directional trends align: resilient oil-directed drilling, growing gas activity in select basins, and steady operator commitment in the Permian and Haynesville.
Rig Count Comparison Across Providers
Different methodologies produce a range of headline numbers, but the story is consistent.WellDatabase (June 26, 2026): 550 total (+1 WoW, 0 YoY). Oil: 407 (+2 WoW, -4 YoY). Gas: 122 (-1 WoW, +12 YoY).
Baker Hughes (as of June 26, 2026): 573 total (+10 WoW from 563 on June 18). Previous week (June 18): Oil 433 (flat), Gas 122 (+1), Misc. 8.
Enverus Daily Rig Count (mid-to-late June 2026 snapshots): Approximately 620–630+ (e.g., ~631 around June 24). Enverus uses GPS tracking for higher-frequency and broader capture of active rigs.
Key takeaway on methodology: Baker Hughes provides the widely followed weekly rotary rig census (land + offshore + inland). Enverus offers daily granularity and typically higher totals. WellDatabase delivers detailed operator, state, basin, well-type, and wellbore breakdowns. All three point to stable-to-slightly-higher activity.
Breakout by Basin (WellDatabase)
The Permian Basin remains the undisputed leader but showed slight softening:Permian: 256 rigs (-1 WoW, -15 YoY) — still ~46% of the national total.
Haynesville: 55 (+19 YoY) — standout gas growth story.
Eagle Ford: 44 (flat WoW, +3 YoY).
Other: 94 (flat WoW, +4 YoY).
Cana Woodford: 20 (+1 WoW).
Marcellus: 24 (flat).
Granite Wash: 18 (flat, +5 YoY).
Williston: 15 (flat WoW, -12 YoY).
Utica: 12 (flat).
DJ-Niobrara: 9 (+1 WoW).

Trend note: Over the last 12 months, the WellDatabase rig count chart shows the national total fluctuating in a relatively tight 520–560 band, with recent stabilization around 550 after minor volatility.
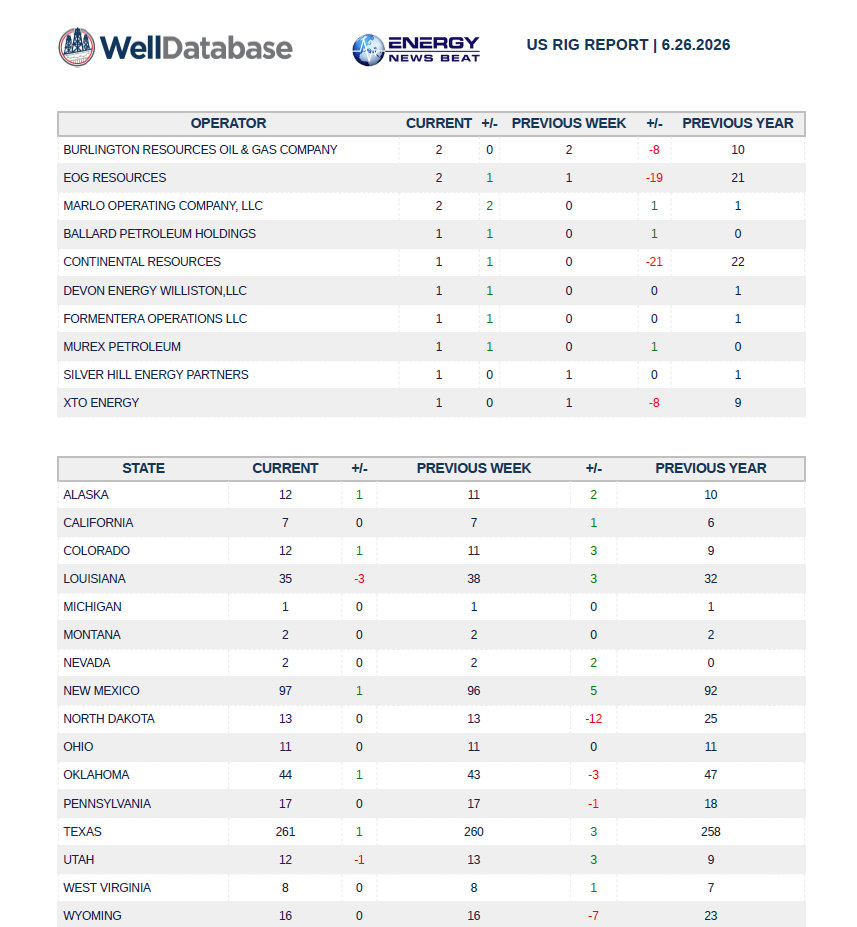
Haynesville’s strong YoY gains contrast with declines in the Williston and Permian.Breakout by State (WellDatabase – Major States)Texas: 261 (+1 WoW, +3 YoY) — largest absolute contributor.
New Mexico: 97 (+1 WoW, +5 YoY).
Oklahoma: 44 (+1 WoW, -3 YoY).
Louisiana: 35 (-3 WoW, +3 YoY).
Pennsylvania: 17 (flat WoW, -1 YoY).
North Dakota: 13 (flat WoW, -12 YoY).
Wyoming: 16 (flat WoW, -7 YoY).
Alaska: 12 (+1 WoW, +2 YoY).
Colorado: 12 (+1 WoW, +3 YoY).
Utah: 12 (-1 WoW, +3 YoY).
Texas and New Mexico together account for the bulk of the national count and recent weekly gains.
Oil vs. Gas and Wellbore Trends
Oil-directed rigs: 407 (+2 WoW) — still the clear majority (~74% of total).
Gas-directed rigs: 122 (-1 WoW but +12 YoY) — notable year-over-year strength, especially in the Haynesville.
Wellbore type: Horizontal rigs dominate at 453 (-4 WoW, -45 YoY). Directional rigs surged to 73 (+10 WoW, +33 YoY), possibly reflecting efficiency gains or specific development strategies. Vertical: 23.
Inventory and Supply Context (EIA Data – Week Ending June 19, 2026)Rig activity is occurring against tightening physical crude markets:
Cushing, Oklahoma (key WTI delivery point): 18.957 million barrels — down 1.077 million barrels week-over-week. This is the lowest level since October 2014 and approaching operational minimums (widely viewed as ~20 million barrels).
Commercial crude inventories (ex-SPR): 412.1 million barrels — down 6.1 million barrels WoW and 7% below the five-year average. Lowest since January 2025 in some measures.
Strategic Petroleum Reserve (SPR): 331.19 million barrels — down ~9.1 million barrels WoW and significantly lower year-over-year (~402 million a year ago). This is among the lowest levels since the early 1980s, reflecting ongoing releases amid geopolitical tensions.
Refinery utilization: High at 96.1% of operable capacity, supporting product inventory builds (gasoline +2.1M bbl, distillate +3.1M bbl) even as crude stocks draw.
Strong exports, high refinery runs, and SPR releases are contributing to the crude stock draws.
What It Means
The slight uptick in the WellDatabase rig count to 550, combined with Baker Hughes and Enverus readings in the 560–630 range, signals that U.S. operators continue to drill at a steady pace. Oil-directed activity remains dominant, while gas rigs show clear year-over-year gains in key plays like the Haynesville. The Permian’s slight weekly and annual dip is offset by strength elsewhere.
With Cushing inventories at multi-year lows and the SPR continuing to decline, sustained or rising rig counts will be important for future supply replenishment. Near-term physical market tightness could provide price support, though global geopolitics and demand trends remain key variables.
Drilling activity is not booming, but it is resilient—exactly the kind of steady signal the market watches closely in a tightening inventory environment.
- WellDatabase.com US Rig Report – June 26, 2026 (detailed tables, charts, and operator/state/basin data).
- Baker Hughes Rig Count: https://bakerhughesrigcount.gcs-web.com/ (U.S. total 573 as of June 26, 2026).
- Enverus Daily Rig Count: https://www.enverus.com/dailyrigcount/.
- EIA Weekly Petroleum Status Report (released June 24, 2026, for week ending June 19, 2026): https://www.eia.gov/petroleum/supply/weekly/ (Cushing, commercial crude, SPR, refinery utilization data).
- Supporting coverage: Reuters and other energy outlets referencing the above EIA and Baker Hughes releases.
All data cross-referenced as of June 26, 2026. Rig counts and inventory figures are subject to revisions.
The post U.S. Weekly Rig Count Edges Up to 550 as Inventories Tighten at Cushing and SPR Draws Down appeared first on Energy News Beat.