Energy News Beat
“14 to 15 million barrels a day are leaving the Arabian Gulf region versus the 20 million barrels a day pre-conflict.” – Secretary Chris Wright
In an exclusive interview on Fox News’ Special Report with Bret Baier on August 13, 2026, U.S. Energy Secretary Chris Wright provided a clearer picture of oil flows amid ongoing disruptions in the Arabian Gulf tied to the conflict with Iran.
Commercial ship trackers, he explained, are undercounting traffic through the Strait of Hormuz because “almost all of these ships have their AIS transponders off so they are dark.”
In round numbers, Wright stated, “14 to 15 million barrels a day are leaving the Arabian Gulf region versus the 20 million barrels a day pre-conflict. So we’re short 5 or 6 million barrels a day from this region, but it’s a much smaller hole than people think it is.” – Secretary Chris Wright
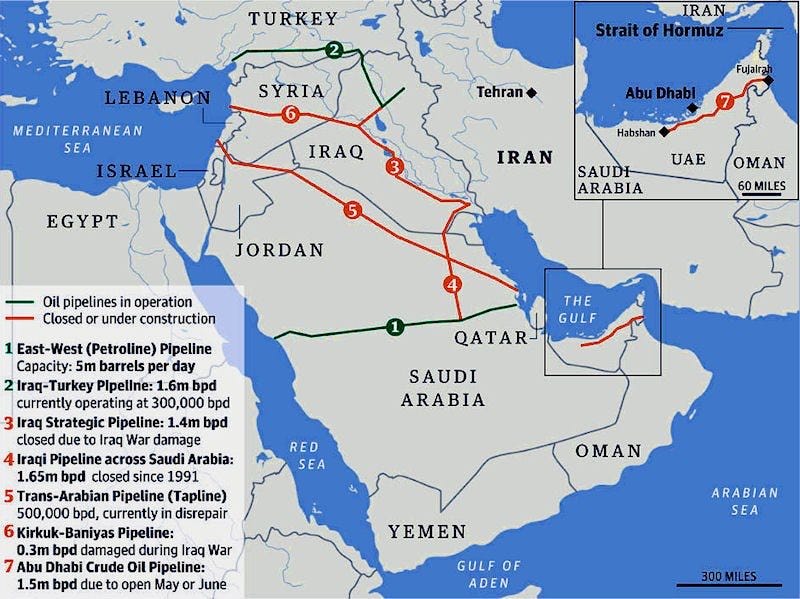
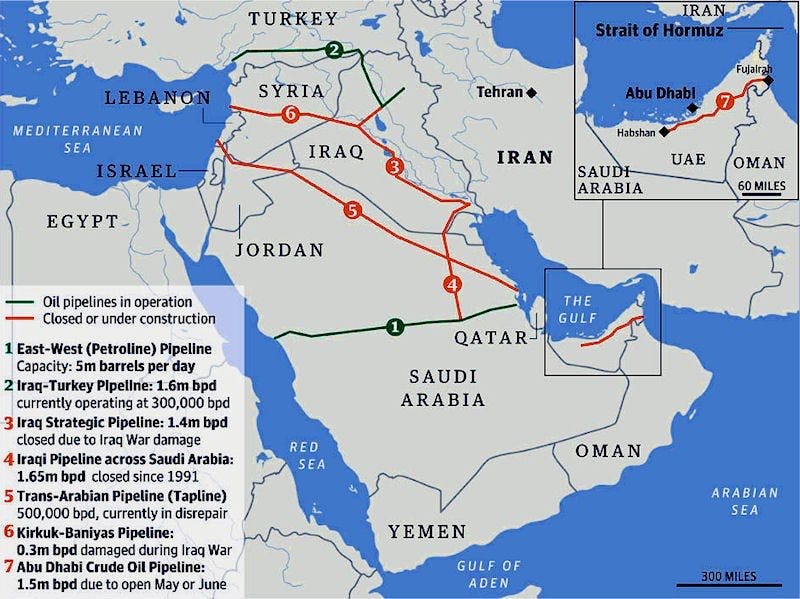
Pipelines under construction and existing pipelines.
2026 Exit Pipeline Volumes by Country
Saudi Arabia (East-West / Petroline pipeline to Yanbu on the Red Sea): Capacity has been expanded/activated to approximately 5–7 million barrels per day (mb/d) in 2026 through conversion of parallel NGL lines and operational upgrades. Pre-conflict utilization was lower (around 2 mb/d spare capacity in early estimates); wartime flows have pushed toward higher utilization, with Yanbu loadings supporting several million barrels per day of exports (reports of peaks near 4–4.2 mb/d sustained in periods, constrained more by terminal capacity than the pipeline itself). Saudi Arabia has discussed further expansion toward 9 mb/d longer-term.
United Arab Emirates (Habshan-Fujairah / ADCOP pipeline): Nameplate capacity of about 1.5 mb/d, with effective capacity near 1.8 mb/d. It has run near or at maximum during the crisis, handling a large share of UAE Murban crude exports (loadings reported around 1.6+ mb/d in peak months). A second parallel pipeline is under accelerated construction, expected to roughly double Fujairah-linked capacity to ~3.3–3.6 mb/d by 2027.
Iraq (Kirkuk-Ceyhan / Iraq-Turkey pipeline): Technical capacity has historically been higher, but operational volumes in 2026 have been lower and variable—recently around 130,000–200,000 b/d (with a one-year agreement targeting capacity allocation toward 750,000 b/d). Flows have been affected by production issues in northern fields and prior disruptions; the route provides an important Mediterranean outlet independent of Hormuz.
Other/limited: Iran’s Goreh-Jask line has reduced relevance under blockade conditions. Combined Saudi + UAE bypass capacity is frequently cited in the 3.5–5.5+ mb/d range under disruption scenarios, contributing to Wright’s referenced 5–7 mb/d via pipelines and upgraded export facilities. Total realistic bypass remains well below pre-conflict Hormuz throughput of ~20 mb/d, leaving an unrecoverable gap that global supplies (including U.S. barrels) help fill.
These pipelines, combined with tanker movements (many operating dark for security), explain why the net shortfall is closer to 5–6 mb/d rather than a near-total cutoff.
U.S. Drilling and American Companies Abroad: Keeping Prices in Check
American companies operating abroad have added incremental supply. U.S. firms continue to apply shale and unconventional expertise in places such as Argentina’s Vaca Muerta (Chevron and others), with additional activity in regions including parts of the Middle East, Australia, and elsewhere. While the primary impact remains domestic production and exports, these international operations by U.S. operators expand global spare capacity and technology transfer, further supporting market balance and helping restrain price spikes for U.S. consumers.
The combination—robust U.S. drilling, record domestic output, strong exports, and contributions from U.S. firms overseas—has prevented a more severe price shock. Gasoline prices, while elevated (national averages around $4/gallon in recent readings), remain below peaks seen in prior administrations under less constrained global conditions, according to administration officials.
Jones Act Waiver and Domestic Energy Shipping:
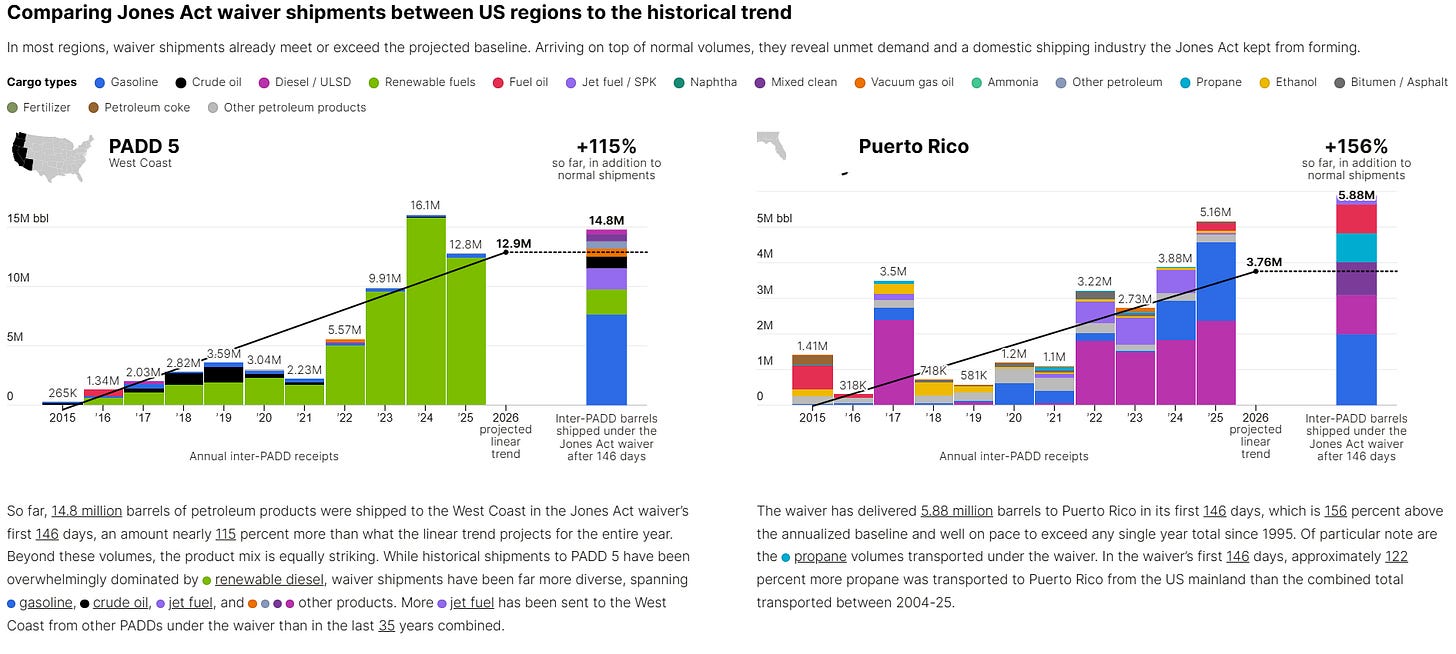
The Trump administration’s broad and extended waiver of the Jones Act (issued March 17, 2026, and prolonged through mid-August) has unlocked significant volumes of U.S. energy moving between U.S. ports on foreign-flagged vessels. According to the Cato Institute’s Jones Act Waiver Tracker, by roughly day 115 (mid-July 2026) nearly 40 million barrels had already been shipped across 162 voyages involving 135 unique vessels. Later updates indicated continued growth, with substantial crude movements (e.g., ~10.7 million barrels of crude from Gulf Coast to East Coast refineries by day 147) and strong flows of gasoline, diesel, jet fuel, propane, and other products.
Key impacts include:
Large incremental deliveries to the West Coast (PADD 5), California, Puerto Rico, Florida, and East Coast destinations—far above historical baselines (e.g., West Coast receipts well over 100% of projected annual trends in some periods; Puerto Rico volumes dramatically higher, including propane previously constrained by the lack of Jones Act LPG tankers).
Gulf Coast origins (Texas and Louisiana) dominate, moving product efficiently to deficit regions that lack adequate pipeline links.
This has reduced transportation costs, improved regional supply balances, and supported lower delivered prices for consumers while providing more flexible offtake options for producers and refiners—benefiting investors through better market access and reduced basis differentials.
The waiver has demonstrated the economic friction previously imposed by Jones Act restrictions on domestic energy trade and has made a measurable difference in cushioning consumers and stabilizing investor expectations during the global supply disruption.
There are many who want to keep the Jones Act for security reasons, and I can agree with them. The rub, or the catch, is that the U.S. fleet of Jones Act ships is way too expensive to maintain, and we have to rebuild our US Merchant Marine fleet and protect our export capacity. Which comes first: the economics to keep the economy rebuilding, or relying on foreign-owned ships until we can rebuild American-owned and operated ships?
President Trump’s waiver of the Jones Act was crucial and helped more blue states and consumers than the mainstream media talks about. I have reached out to the Cato Institute and am lining up interviews with David Blackmon.
The Bottom Line
Overall, Secretary Wright’s transparency on the “dark” tanker traffic and the narrower-than-feared shortfall, combined with pipeline expansions, strong U.S. production, and temporary shipping flexibility, paints a picture of a market adapting faster than many feared. While risks remain and full normalization will take time, these factors have limited the damage to prices and supply for American consumers and markets.
Oil prices won’t spike to $140 or $200, as some fear-mongers preach, but the separation of oil prices from the stock prices of US refiners is what I am watching. Several months ago, the refiners’ stock prices were following oil, but now they should not. The “Crack Spread” is the highest it has ever been, and that is the difference between what a refinery pays for physical delivery of oil and what it can sell its refined products for.
Physical delivery of oil is in the $120-$170 range, depending on the port or blend, and refineries are running at 96% capacity amid steady demand. They are the unsung heroes, as their maintenance season is approaching, and they will have to spend millions, if not billions, to repair their 75- to 80-year-old facilities to keep us moving.
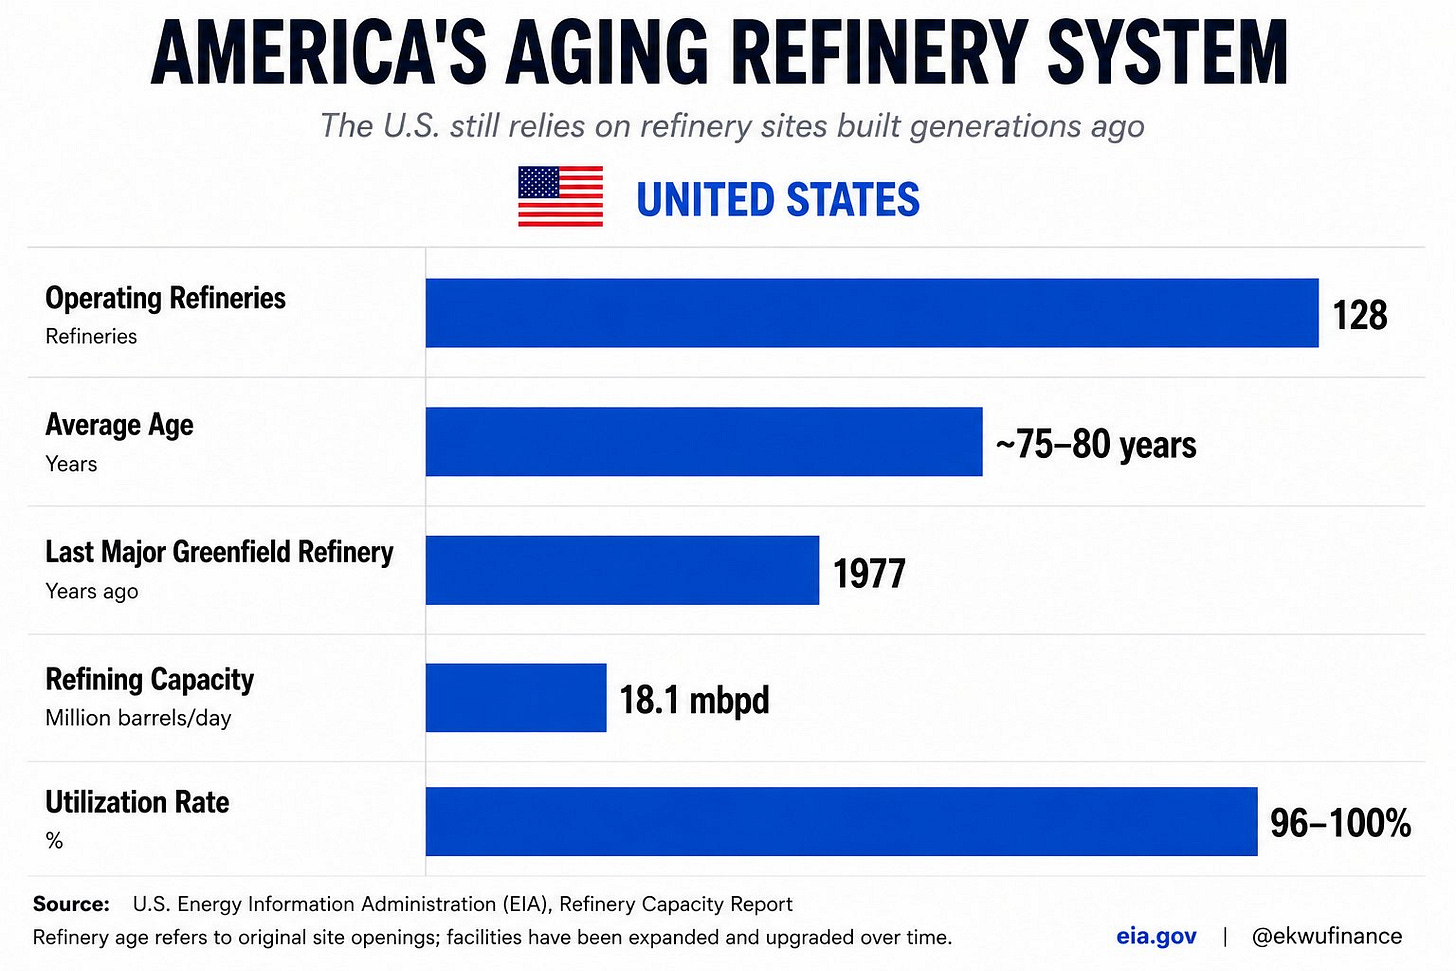
The world is short of refining capacity, and we have 128 operating refineries in the US, with two looking to come online in the next year. They are critical, and we have 7 in California, with 6 slated to close, which will put our largest state on the path to fiscal collapse of “Dogs and Cats Sleeping Together ” magnitude.
Thanks again to all of our paid subscribers, subscribers, patrons, and sponsors.
Doomberg has already had more than 10K listens or views, and it is spiking to surpass 110K views or listens.
Working on several great interviews and will get those out as soon as possible.
Shout-out to Amy Cooke at the Independence Institute and Power Gab podcast for having me on. I will post that out after they release the podcast.
And make Appendixs great again – I am really tired of reading stories that don’t have their sources available. If you have any suggestions to help us improve, please let me know!
Appendix: Sources and Links
- Fox News / Special Report interview clip and quote:
- (and related Fox coverage of the August 13, 2026 appearance).
- Additional Wright comments and related reporting: Fox News videos and articles on Strait flows, pipelines, and prices (multiple 2026 pieces); Atlantic Council remarks; Reuters and other coverage of claims vs. tracker data.
- Pipeline capacities and 2026 utilization (Saudi East-West, UAE ADCOP, Iraq-Turkey): IEA Strait of Hormuz analysis; Hormuz Monitor / straitofhormuz.report; Kpler reports; Energy Intelligence, OGJ, Reuters, and related industry analyses on expansions and flows.
- U.S. production, drilling, and exports: EIA Short-Term Energy Outlook (August 2026 and prior); OPEC MOMR; Baker Hughes rig data; company reports and industry analyses (WoodMac, etc.) on international activity.
- Cato Institute Jones Act Waiver Tracker and related blogs: https://www.cato.org/jones-act-waiver-tracker; https://www.cato.org/blog/introducing-jones-act-waiver-tracker; updates via Cato and associated analysts (volumes, voyages, regional impacts as of July–August 2026).
- Supporting market and shipping data: Kpler, Vortexa/EIA analyses, Bloomberg, CNBC, and other vessel-tracking reports on Hormuz and alternative flows.
All figures are approximate and drawn from publicly reported estimates; actual metered flows can vary with operational, security, and market conditions.
The post Secretary Chris Wright Sheds Light on the Oil Market Traffic appeared first on Energy News Beat.