Energy News Beat
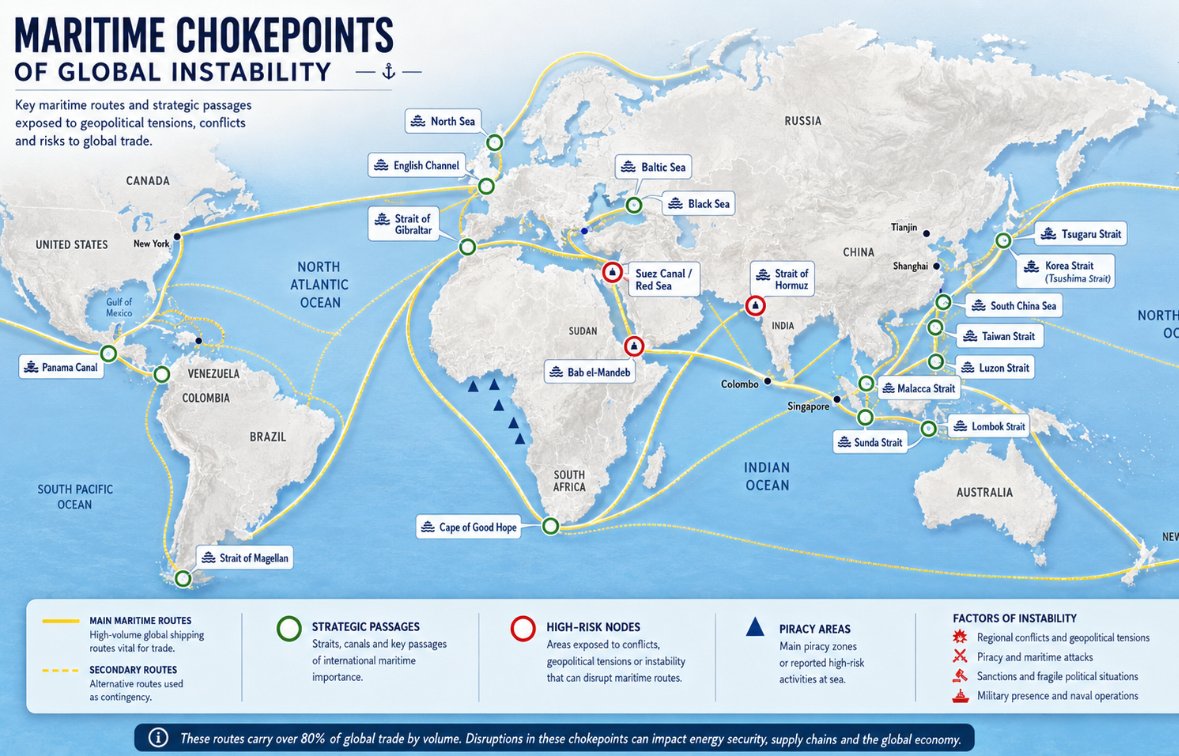
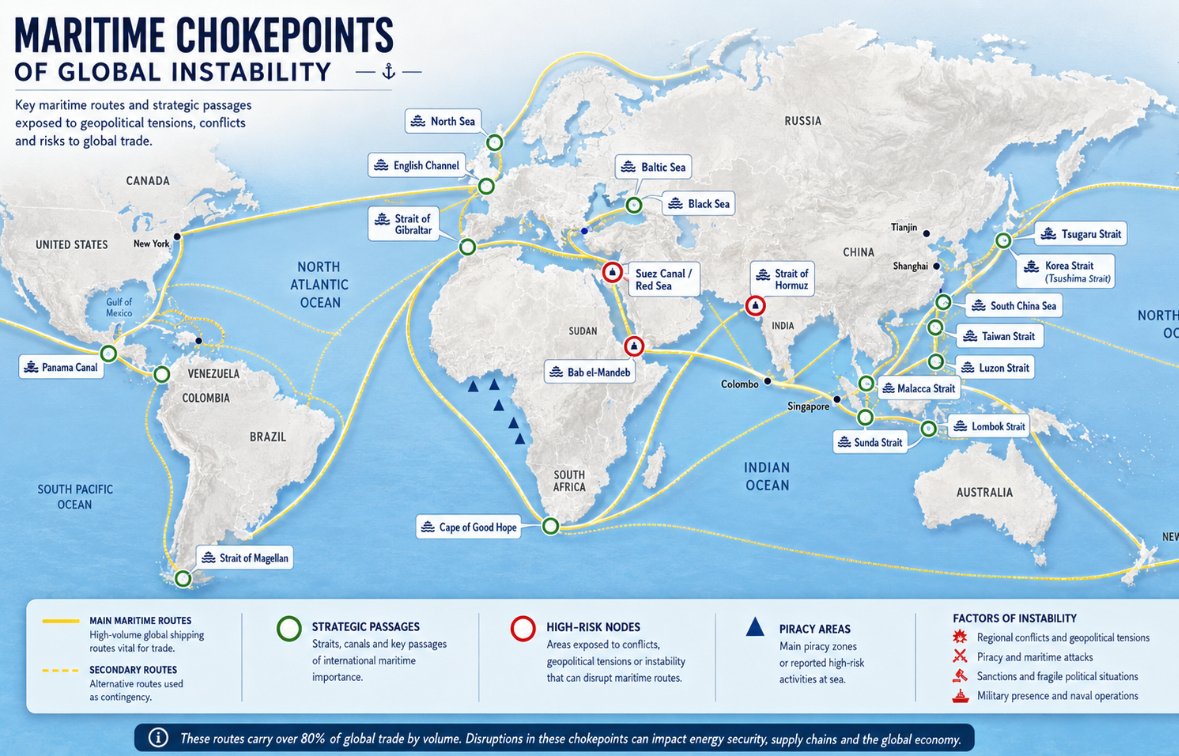
In the escalating conflicts of mid-2026, the world’s most critical maritime energy arteries face simultaneous pressure from military actions, proxy threats, and environmental stresses. The Strait of Hormuz, Bab el-Mandeb Strait, Suez Canal, and even the Caspian Sea region have become flashpoints, disrupting flows of oil, LNG, fertilizers, and other commodities. Russian tankers are forced on multi-week detours around Africa, insurance premiums have skyrocketed, and the gap between paper oil prices near $90–$100 per barrel and actual delivered costs at refineries continues to widen. These pressures compound an already fragile global energy system.
Caspian Sea: Regional Hub Under Direct Fire
The Caspian Sea is not a traditional open-ocean chokepoint but a vital enclosed basin for oil and gas from Kazakhstan, Azerbaijan, Turkmenistan, Russia, and Iran. Most exports move via pipelines rather than long-haul shipping. The Caspian Pipeline Consortium (CPC) system, carrying primarily Kazakh and some Russian crude to the Black Sea port of Novorossiysk, has handled volumes on the order of more than 28 million metric tons in the first five months of recent reporting periods (roughly 1.3–1.5 million barrels per day range in peak operations). Additional volumes move via the Baku-Tbilisi-Ceyhan pipeline and limited tanker traffic across the sea itself.
Fertilizer and critical minerals traffic is secondary but present in regional trade. Recent Ukrainian long-range strikes have directly targeted the basin: On or around July 25, 2026, Ukrainian forces hit vessels in the Caspian Sea carrying military cargo linked to Iran-Russia transfers, plus a Russian warship. Iran confirmed an Iranian commercial vessel was struck, resulting in one sailor killed and another injured, and condemned the action as aggression. Iranian-linked rhetoric followed with threats of retaliation against Ukraine, including warnings that Ukrainian territory lies within range of IRGC ballistic missiles and that attacks on Russian (or Iran-linked) ships would bring consequences. These developments underscore how the Caspian has become an extension of broader conflicts rather than a quiet export corridor.
Strait of Hormuz: The Premier Oil and LNG Artery Under Siege
The Strait of Hormuz remains the single most important oil transit point. In the first half of 2025, it carried approximately 20.9 million barrels per day (b/d) of crude and petroleum products—about 26% of global seaborne oil trade and historically around one-fifth of global petroleum liquids. LNG flows through the strait averaged about 11.4 billion cubic feet per day in the same period, roughly one-fifth of global LNG trade, dominated by Qatari exports.
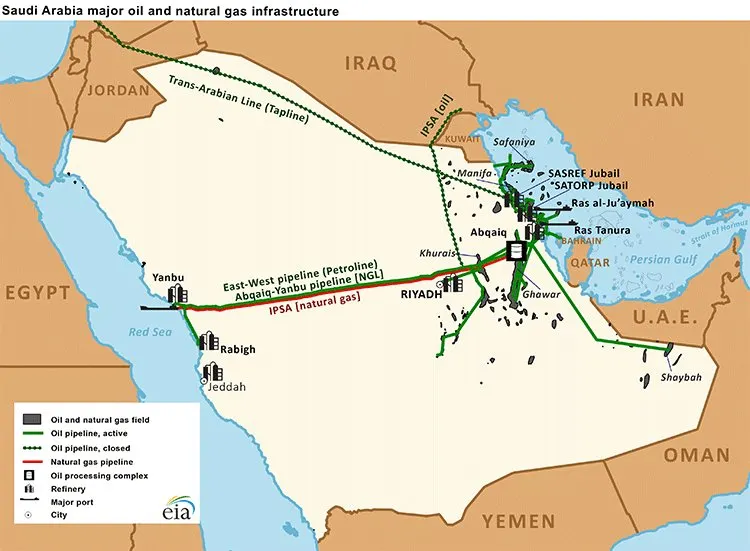
Conflict-related disruptions in 2026 have been severe. In the first quarter of 2026, flows fell nearly 30% year-over-year to about 14.6 million b/d (roughly 6 million b/d lower than prior levels), with the strait described as effectively closed or heavily restricted by Iranian actions at points during the fighting. Europe has faced heightened winter gas shortage risks as a result of disrupted Qatari and Gulf LNG. Fertilizer and critical minerals move in smaller volumes as part of broader Gulf export traffic, but oil and gas dominate. Alternatives via Saudi and UAE pipelines cover only a fraction of capacity.
Bab el-Mandeb Strait and Suez Canal: Red Sea Corridor Collapsing
The Bab el-Mandeb (“Gate of Tears”) and the connected Suez Canal/SUMED pipeline system form the key Europe-Asia link. In the first half of 2025, Bab el-Mandeb oil flows averaged about 4.2 million b/d (roughly 5–6% of global seaborne oil, down by more than half from 2023 peaks near 9 million b/d). Suez Canal and SUMED volumes stood at about 4.9 million b/d of oil and products (also roughly halved from 2023). LNG through Bab el-Mandeb fell to near zero, while Suez LNG dropped sharply to about 0.9 Bcf/d. Vessel traffic through the Bab el-Mandeb declined from around 75 ships per day in 2023 to roughly 33 in 2025 periods.
Recent Houthi actions have further reduced traffic. In late July 2026, the group announced a naval blockade focused on Saudi-linked shipping, ordered vessels to turn back, and claimed drone and missile strikes on Saudi oil tankers Encelia and Layla. Saudi authorities confirmed at least one vessel was hit and suffered a fire (crew safe). Additional Houthi missile and drone attacks targeted Aramco facilities in Jazan and Yanbu around July 25. Saudi-led forces struck Houthi sites in Hodeidah in response. These incidents, occurring within the last 48–72 hours relative to late July 26 reporting, have driven further diversions and pushed more cargo onto the Cape of Good Hope route.
Fertilizer shipments (phosphates, potash, and related products from Middle East/North Africa producers) form a meaningful share of Red Sea/Suez bulk traffic historically, alongside grains and other commodities. Critical minerals move in container and bulk form through the same corridor, though precise recent volumes are secondary to energy flows. Overall Red Sea traffic has remained well below pre-2023 levels (estimates of 55–60% in some mid-2026 assessments).
Iran’s Warnings and Recent Targeting
Beyond the Caspian incidents, Iran’s IRGC has issued direct warnings. After Ukrainian strikes on Caspian vessels tied to Iran-Russia military logistics, Iranian sources and media circulated threats that Ukraine lies within range of IRGC missiles and that attacks on Russian ships would not go unanswered. Separately, the IRGC warned the United Kingdom that British bases used by U.S. aircraft (including for operations related to degrading Iranian capabilities affecting the Strait of Hormuz) are considered “legitimate targets.” UK officials responded that armed forces stand ready to defend the country. These statements add political and military risk layers to already strained shipping lanes.
Market Reaction: What Traders and Analysts Said About Bab el-Mandeb Closure Risk
When Houthi threats and attacks raised the prospect of effective Bab el-Mandeb closure or severe restriction, oil traders and analysts warned of sharp upside. Energy Aspects’ Richard Bronze noted that a successful Houthi effort to shut the strait “would certainly qualify” as a catalyst for further price rallies after Hormuz-related gains. Consultant commentary and reports projected potential climbs above $115–$120 per barrel if flows were heavily disrupted, with particular impact on Saudi Red Sea exports (Yanbu) and Asian refiners, especially India. Kpler’s Matt Smith described the first-month impact as “massive,” centered on Saudi barrels. Freight and insurance costs were expected to rise further as ships divert around Africa. Brent briefly topped $100 in reaction to the tanker attacks before some pullbacks.
Side Note: Panama Canal Drought Pressures
The Panama Canal, a key alternative for certain U.S.–Asia and Americas trades, recovered capacity after the severe 2023–2024 drought that cut daily transits dramatically (at times to 18–24 vessels from a normal 36–38). By early-to-mid 2026, daily averages climbed toward 33–41 ships amid higher fuel costs elsewhere, with FY2025 revenue strong. However, concerns over a potential returning El Niño prompted draft reductions for Neo-Panamax vessels (from 50 ft to 49.5 ft in some announcements) and ongoing water-management caution. Further restrictions would lengthen voyages, raise costs, and add pressure on already elevated global freight rates, though the canal has so far avoided major 2026 curbs and has absorbed some traffic diverted from Middle East routes.
Russian Tankers, Insurance, and the Real Cost of Oil
Russian and other tankers avoiding the Red Sea/Suez (and facing Hormuz risks) have increasingly rounded the Cape of Good Hope. For Saudi or Gulf crude headed to Asia under full diversion, the longer route can add around a month of voyage time. Fuel costs alone can roughly double (example calculations showed jumps from about $1.26 million to $2.87 million on certain voyages). Insurance rates have surged “through the roof”: war-risk premiums for Hormuz or high-risk Red Sea transit have risen to several percent of hull value (reports of 3–5% or higher at peaks, versus fractions of a percent in calmer periods), equating to millions of dollars per large tanker voyage. Some quotes reached 7.5–10% in extreme conditions.
Consequently, a paper (futures or spot) oil price near $89–$100 per barrel significantly understates the landed cost at a refinery. Extra fuel, time-charter expenses, insurance, and potential demurrage or higher freight rates push the effective delivered price substantially higher. These frictions act as a hidden tax on energy consumers worldwide.
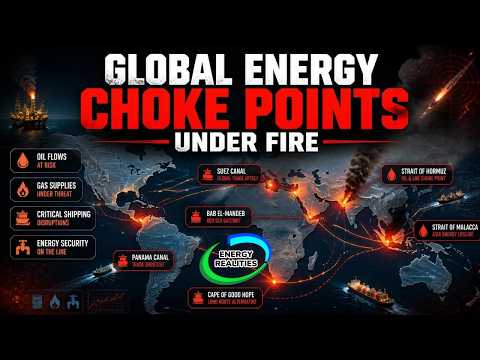
The simultaneous stress on Hormuz, the Red Sea corridor, Caspian logistics, and secondary routes like Panama illustrates a global energy system operating with far less buffer than in previous decades. Continued military activity, proxy attacks, and weather risks suggest elevated price volatility and supply uncertainty will persist until de-escalation or durable workarounds take hold.
The Energy Realties Team will be Live Monday Morning at 7:00 on YouTube and LinkedIn.
Here is the live feed link.
Appendix: Sources and Links
- U.S. EIA World Oil Transit Chokepoints: https://www.eia.gov/international/analysis/special-topics/world_oil_transit_Chokepoints
- EIA/related reporting on Hormuz Q1 2026 disruptions: Institute for Energy Research summary and EIA Global Energy Security Data references
- Reuters: Houthi Red Sea blockade impact analysis (July 20, 2026) and related tanker attack coverage
- Reuters: UK response to Iran IRGC warnings over U.S. use of bases (July 23, 2026)
- Al Jazeera, CNBC, CBS, Saudi Press Agency, UKMTO reports on Houthi tanker and Aramco facility attacks (July 22–25, 2026)
- Reporting on Ukrainian Caspian Sea strikes and Iranian response (July 25, 2026): multiple outlets including Iran International, X trending summaries, and Zelenskyy statements
- Insurance rate reporting: Al Jazeera, Bloomberg, Reuters, Howden Re analyses (2026 conflict period)
- Panama Canal updates: Reuters, Rio Times, Seatrade Maritime (2026 drought/El Niño preparations and recovery)
- Cape of Good Hope diversion costs: Reuters calculations (July 2026)
- Additional market commentary: Energy Aspects, Kpler, Stratas Advisors via Reuters and related outlets
Data reflect the most recent publicly available figures as of late July 2026; volumes can shift rapidly with conflict developments.
The post Global Energy Choke Points Under Fire appeared first on Energy News Beat.