Energy News Beat
No longer the cleanest dirty shirt.
By Wolf Richter for WOLF STREET.
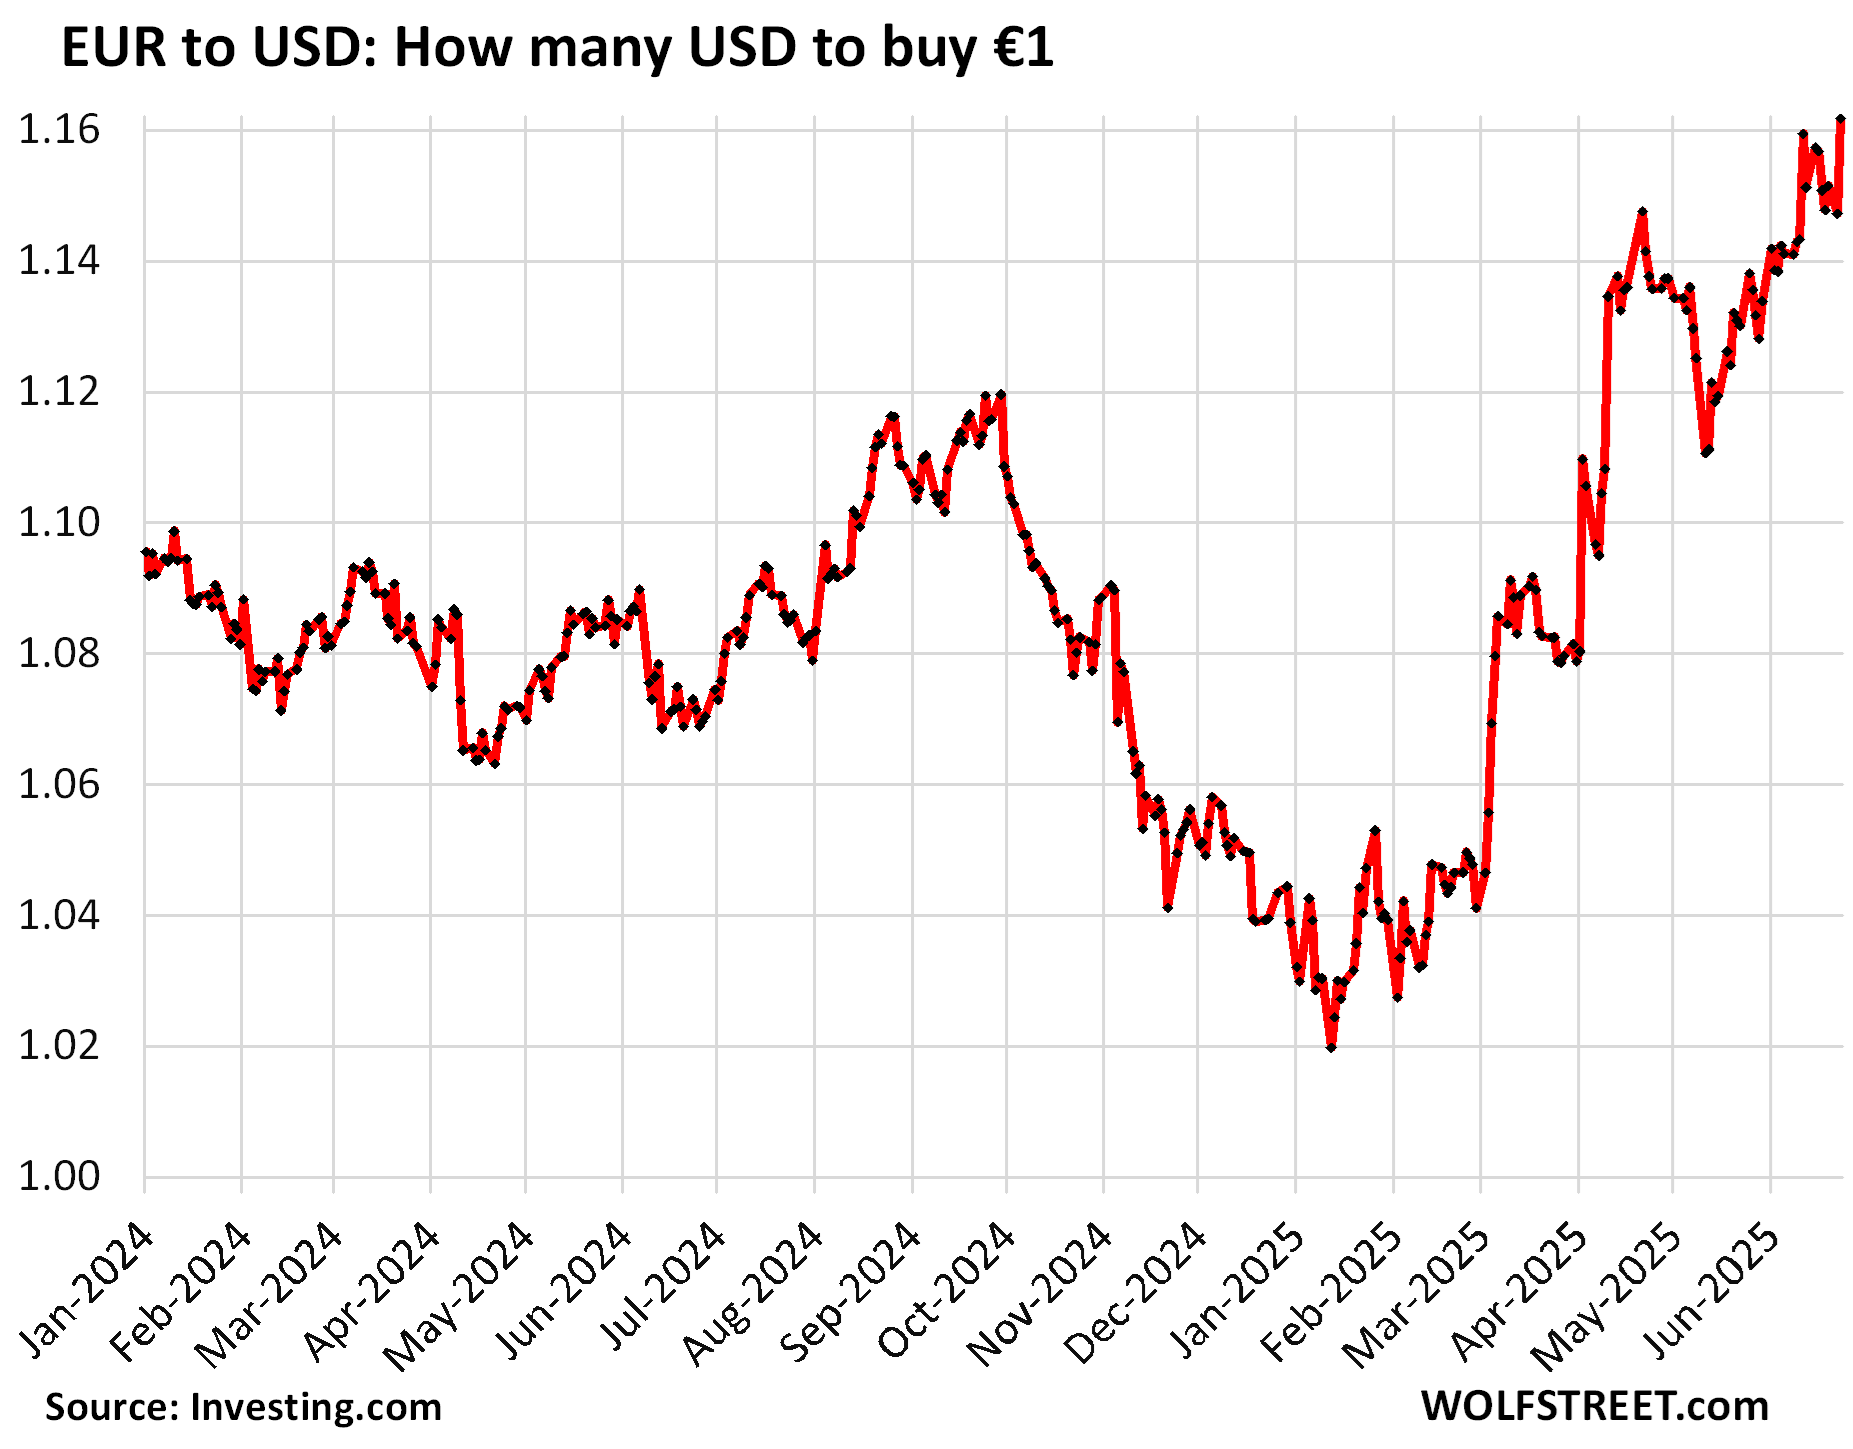
The somewhat bedraggled US dollar lost more ground against the euro today. It now takes 1.16 USD to buy 1.00 EUR, putting the dollar at the lowest level against the euro since November 2021.
In early January, after the euro had fallen against the USD for three months, there was talk that the euro would fall below parity with the dollar. That didn’t happen. After the euro dropped to $1.02, it bounced off and then began to soar.
Over the longer term, as we’ll see in a moment, the EUR/USD exchange rate just moved back into the middle of the long-term range. One thing the Euro Area is doing right: The ECB has accelerated its QT this year and has already shed €3 trillion in QE bonds and QE loans, even as the Fed has decelerated its QT this year after shedding only $2.3 trillion.
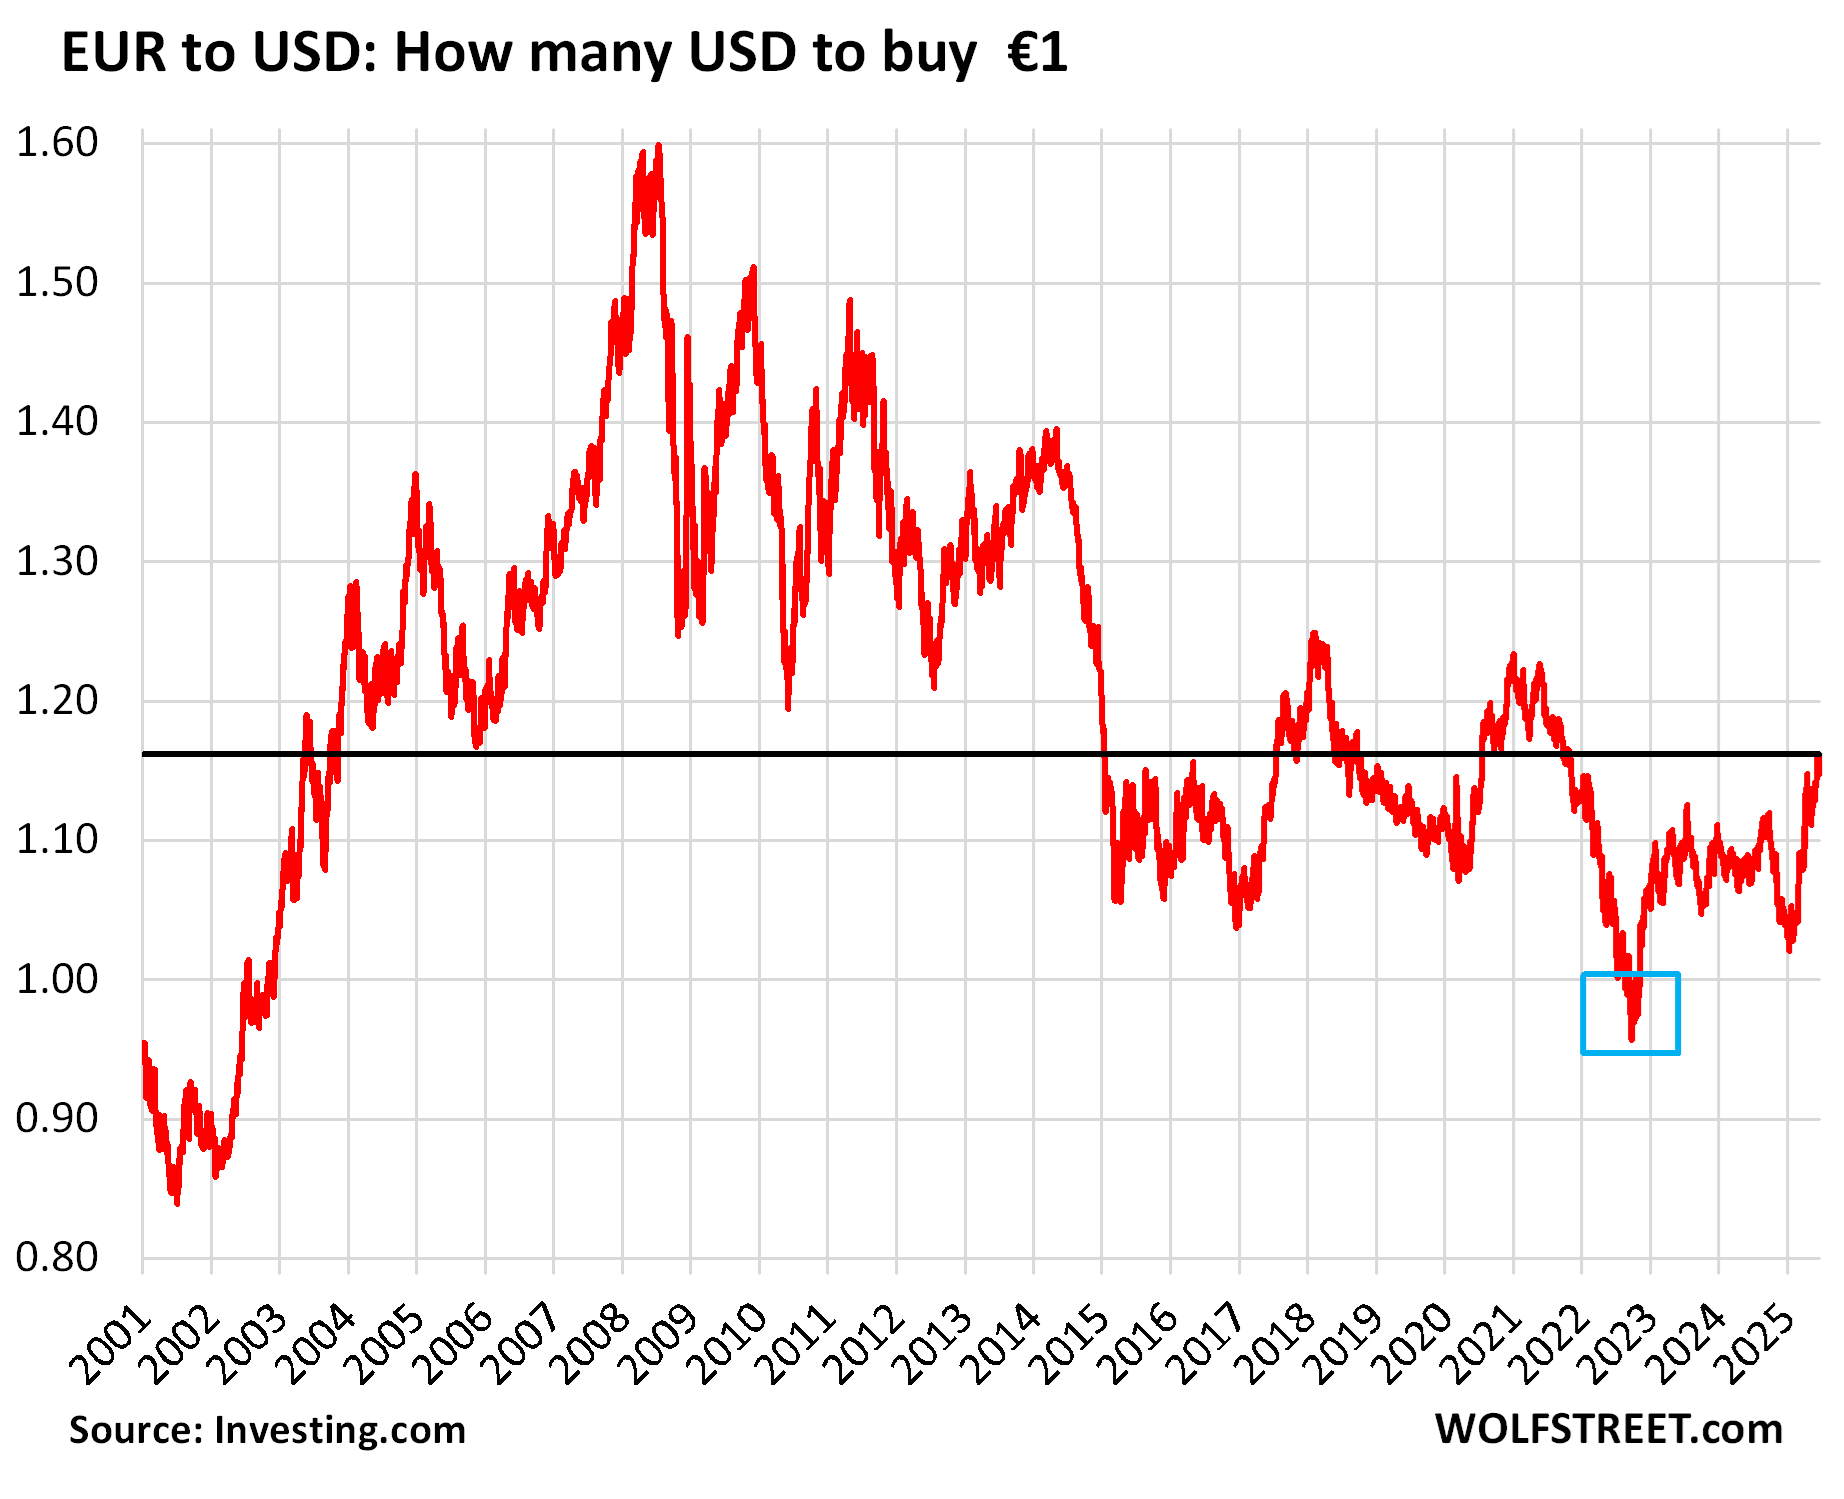
The dollar and euro have been a very volatile currency pair. When the euro was still young in the early 2000s, it had a very hard time. But then by 2005, the financial system in the US was starting to show cracks which opened into a full-blown Financial Crisis by 2008, which caused the USD to plunge against the euro.
But then the Euro Area went through the Euro Debt Crisis and, amid the central-bank shenanigans it took to resolve it, the euro plunged against the USD. So it’s one crisis or another, or no crisis, and currencies react in wild ways.
The time for Americans to go to the Euro Area and enjoy good deals was in late 2023, when the euro fell below parity (blue box in the chart below), and the USD bought lots of good deals.
Now not so much. That €1 item cost USians about $0.98 in October 2023. Now that €1 item costs $1.16. So over this period, the somewhat bedraggled USD has lost about 18% against the euro and is back where it had been in September 2021.
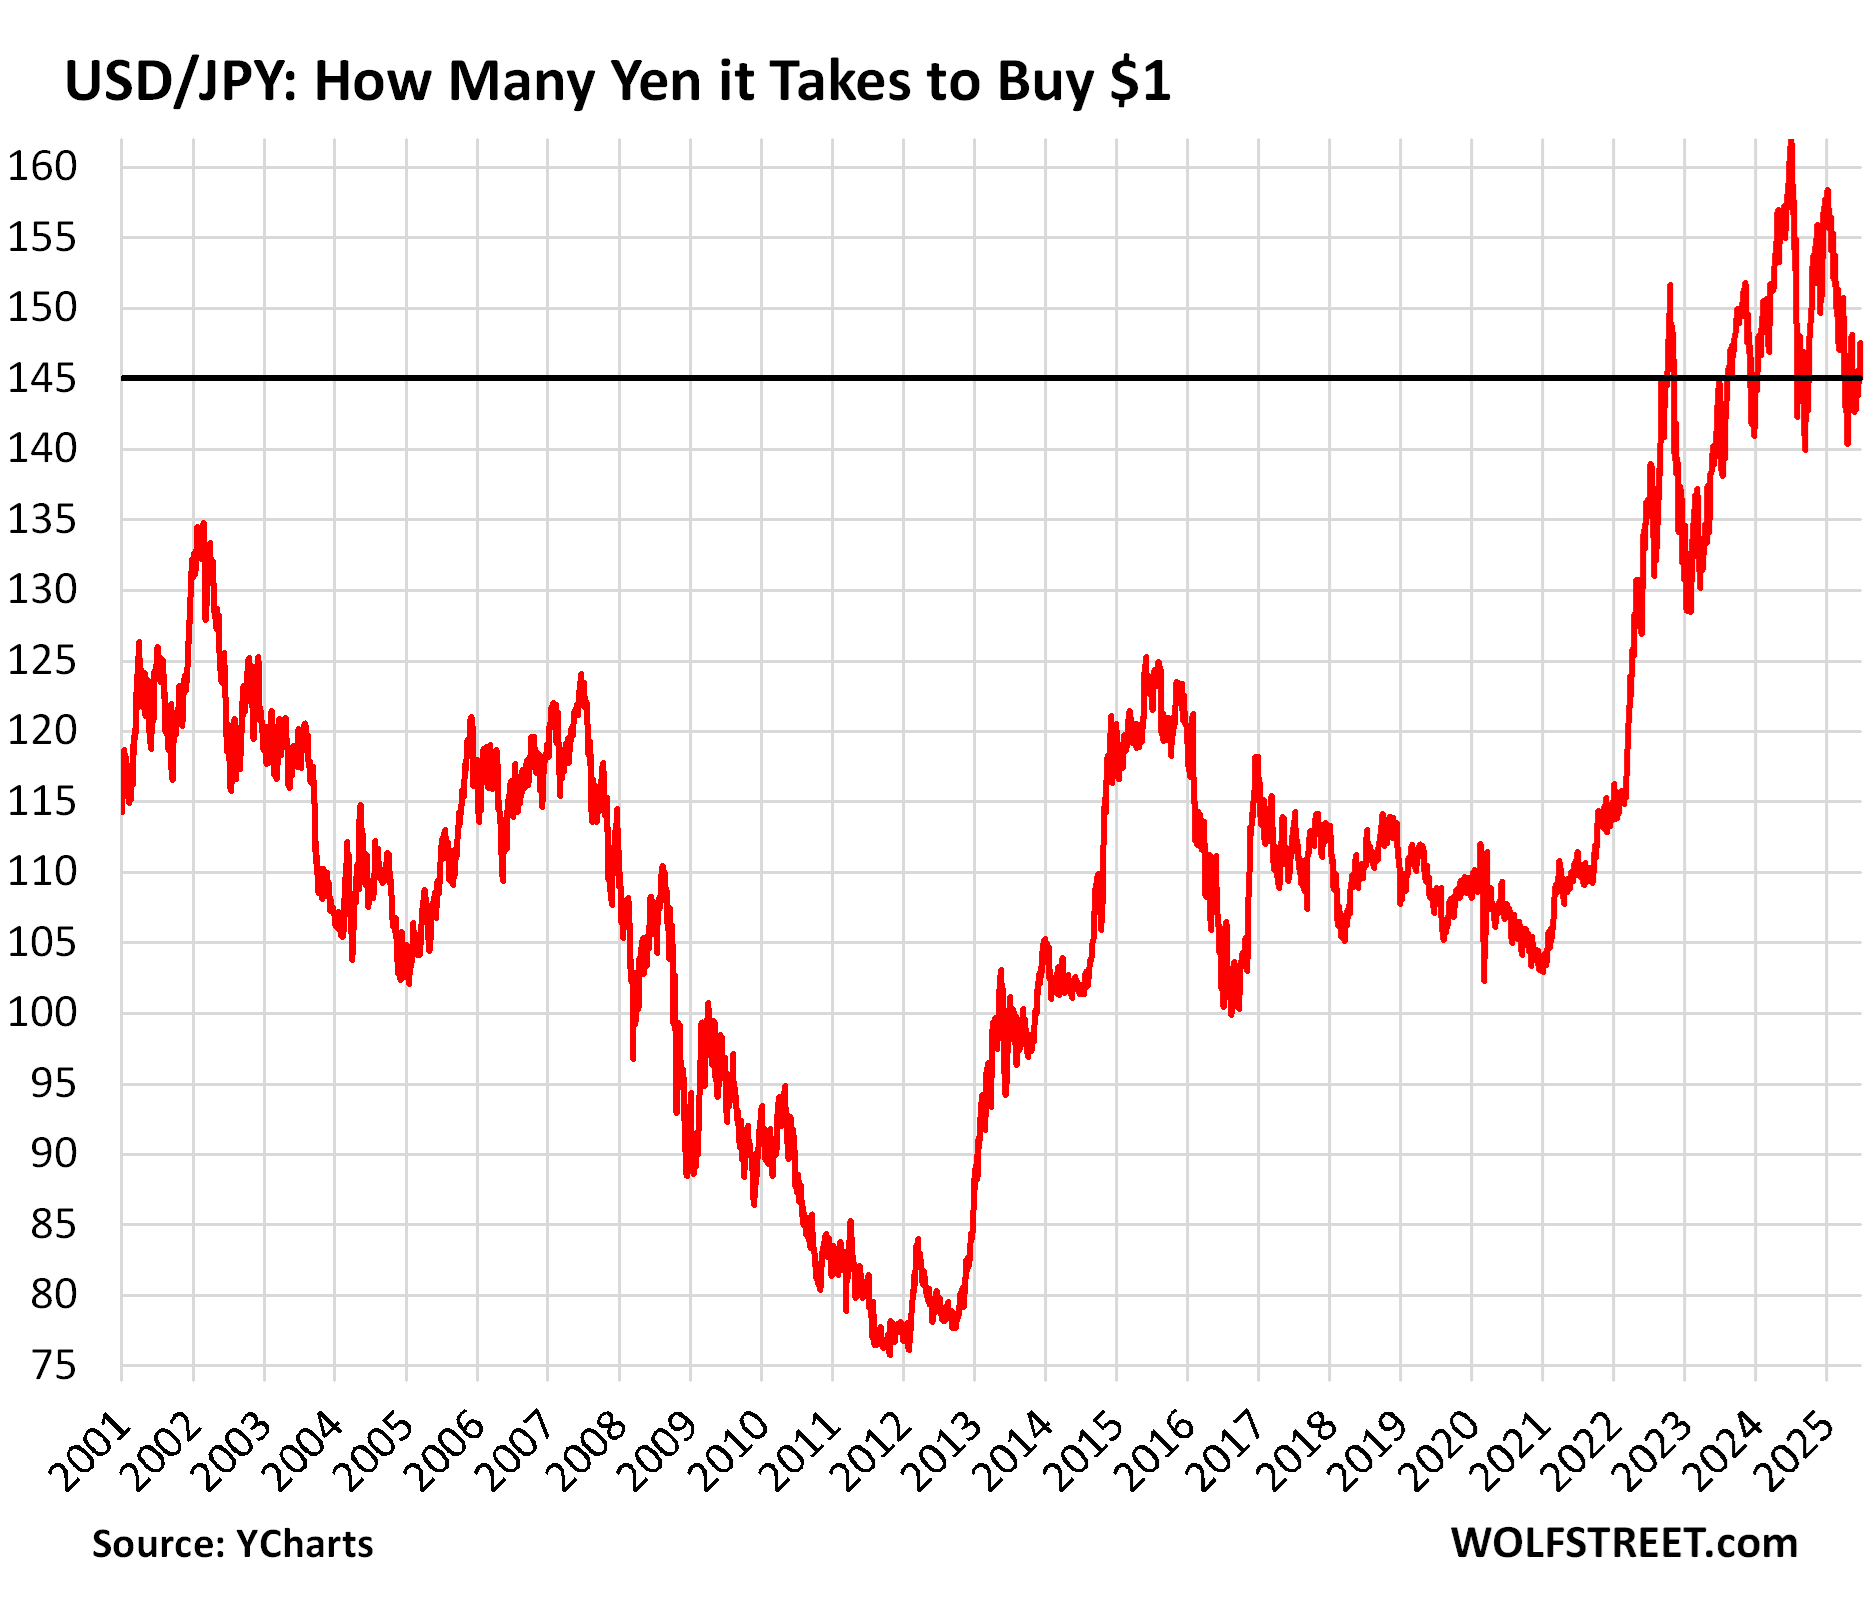
The Yen [JPY] had collapsed by roughly 50% against the USD between 2012 and mid-2024, some of it fast and furious, some of it in slow-motion, with lots of partial recoveries in between, falling from 80 yen to the dollar in 2012 – when it was exceptionally strong – to 160 yen to the dollar in July 2024.
The collapse of the yen halted and partially reversed after major interventions by Japan’s government in 2023 and 2024, plus some baby rate hikes by the Bank of Japan and the start of QT last year, which the BOJ has accelerated this year.
Currently the dollar trades at around 145 yen, which, prior to 2022, had been a multidecade low for the yen.
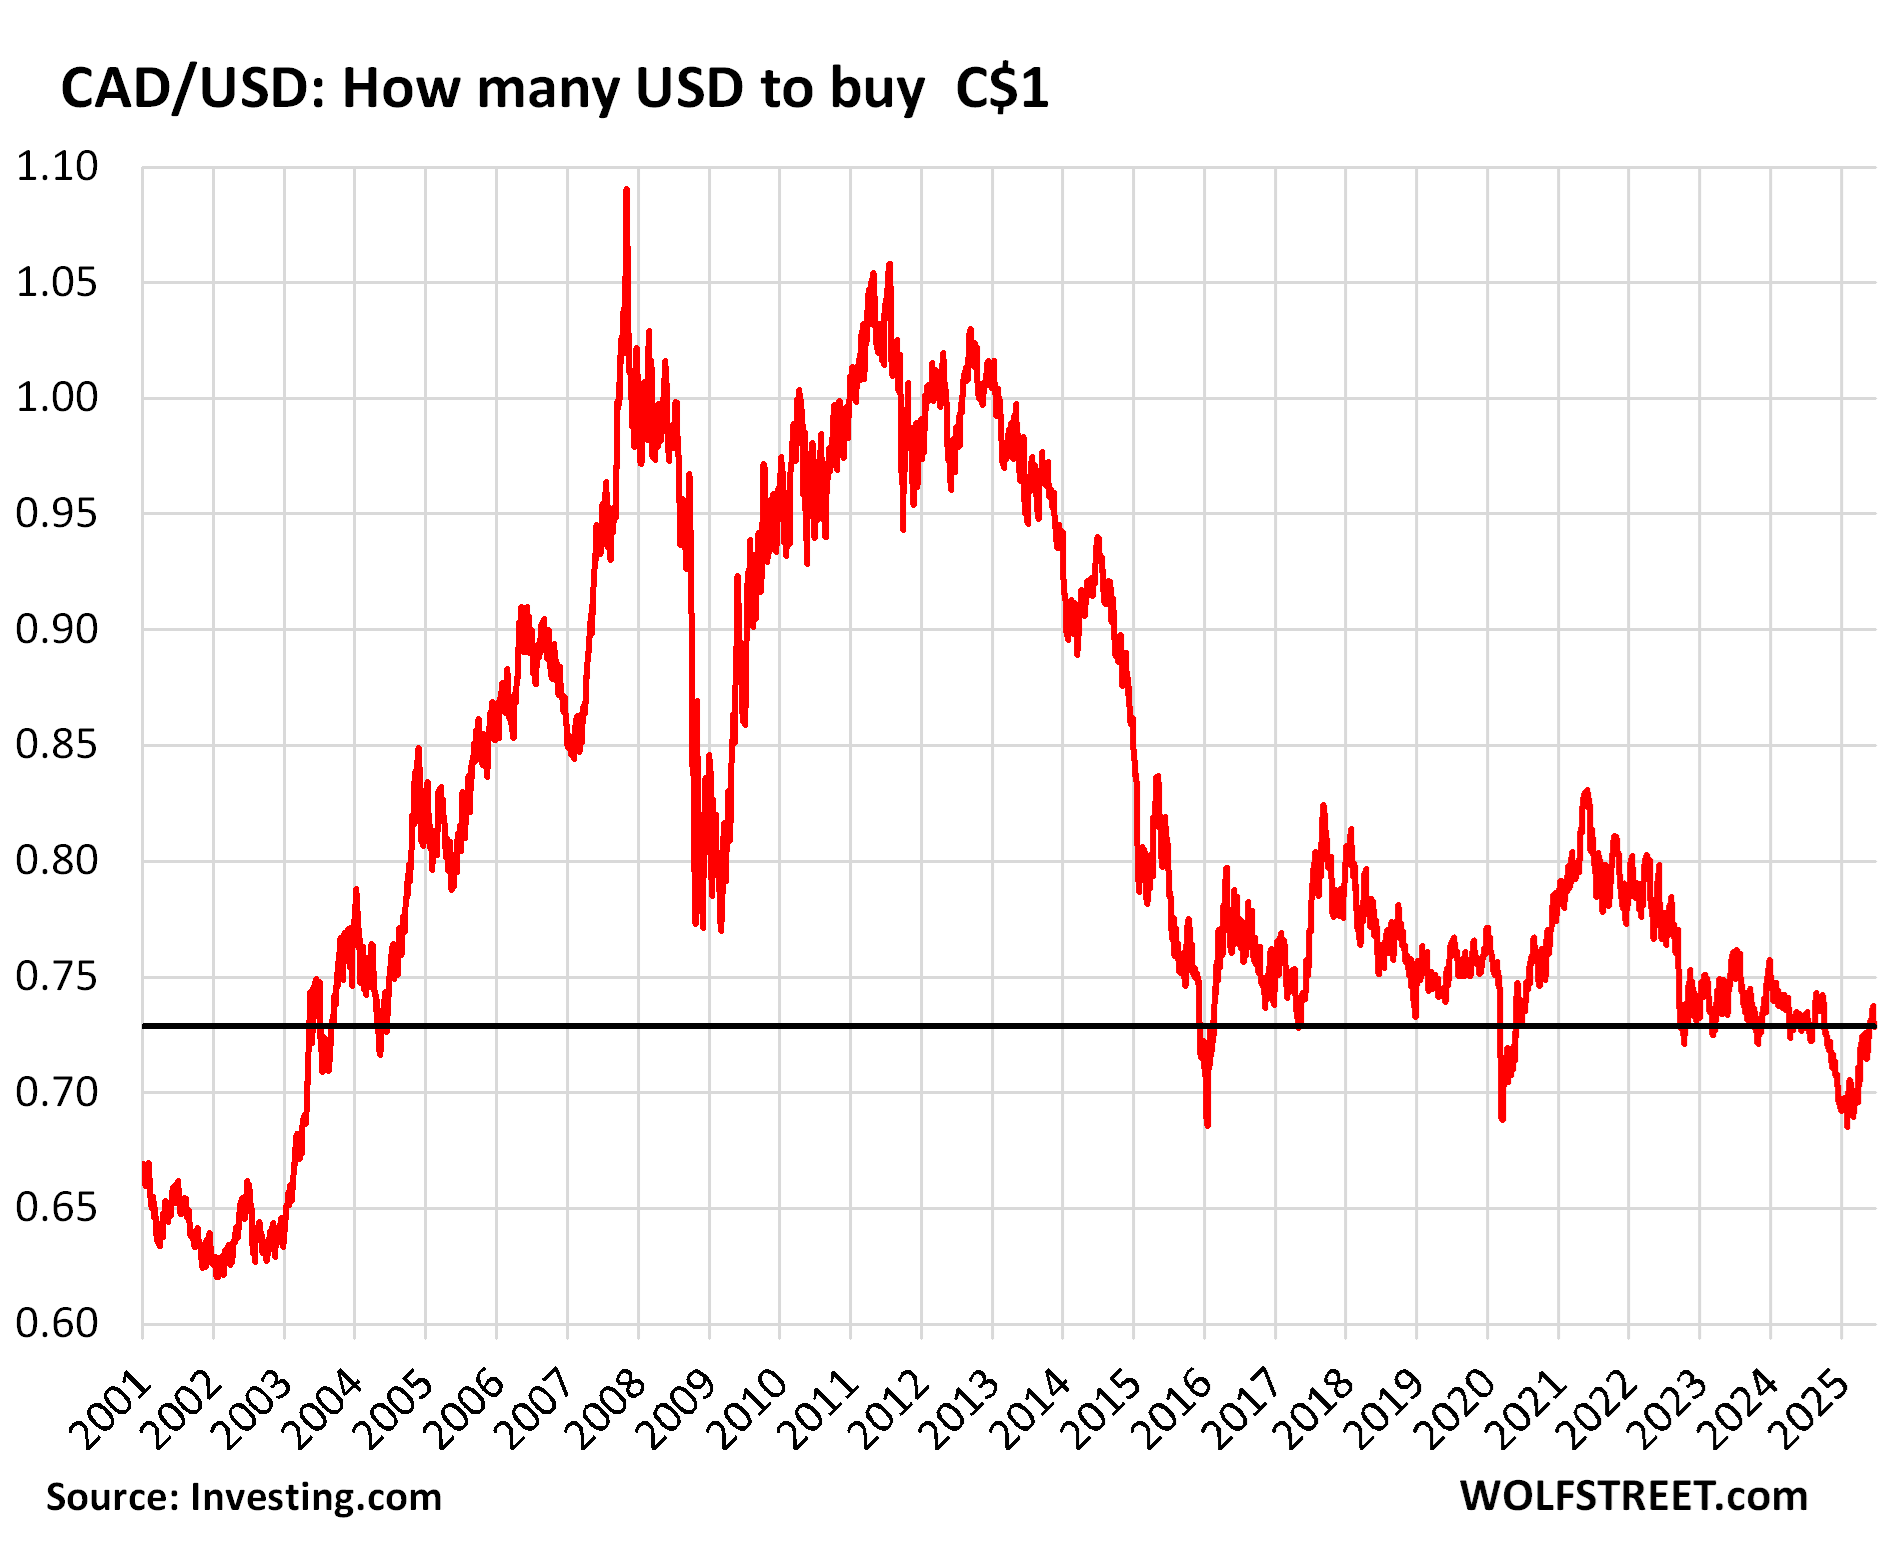
The Canadian dollar [CAD] staged a mini-recovery this year against the USD, after trading as low as 69 US cents in early January. But it is still wallowing around at low levels against the USD, which is obviously where Canadian authorities like it to be – at low levels against the USD – because it makes Canadian exports to the US more competitive with Mexican exports to the US.
Currently, it is trading at 72.8 US cents, so not exactly a big recovery against the USD.
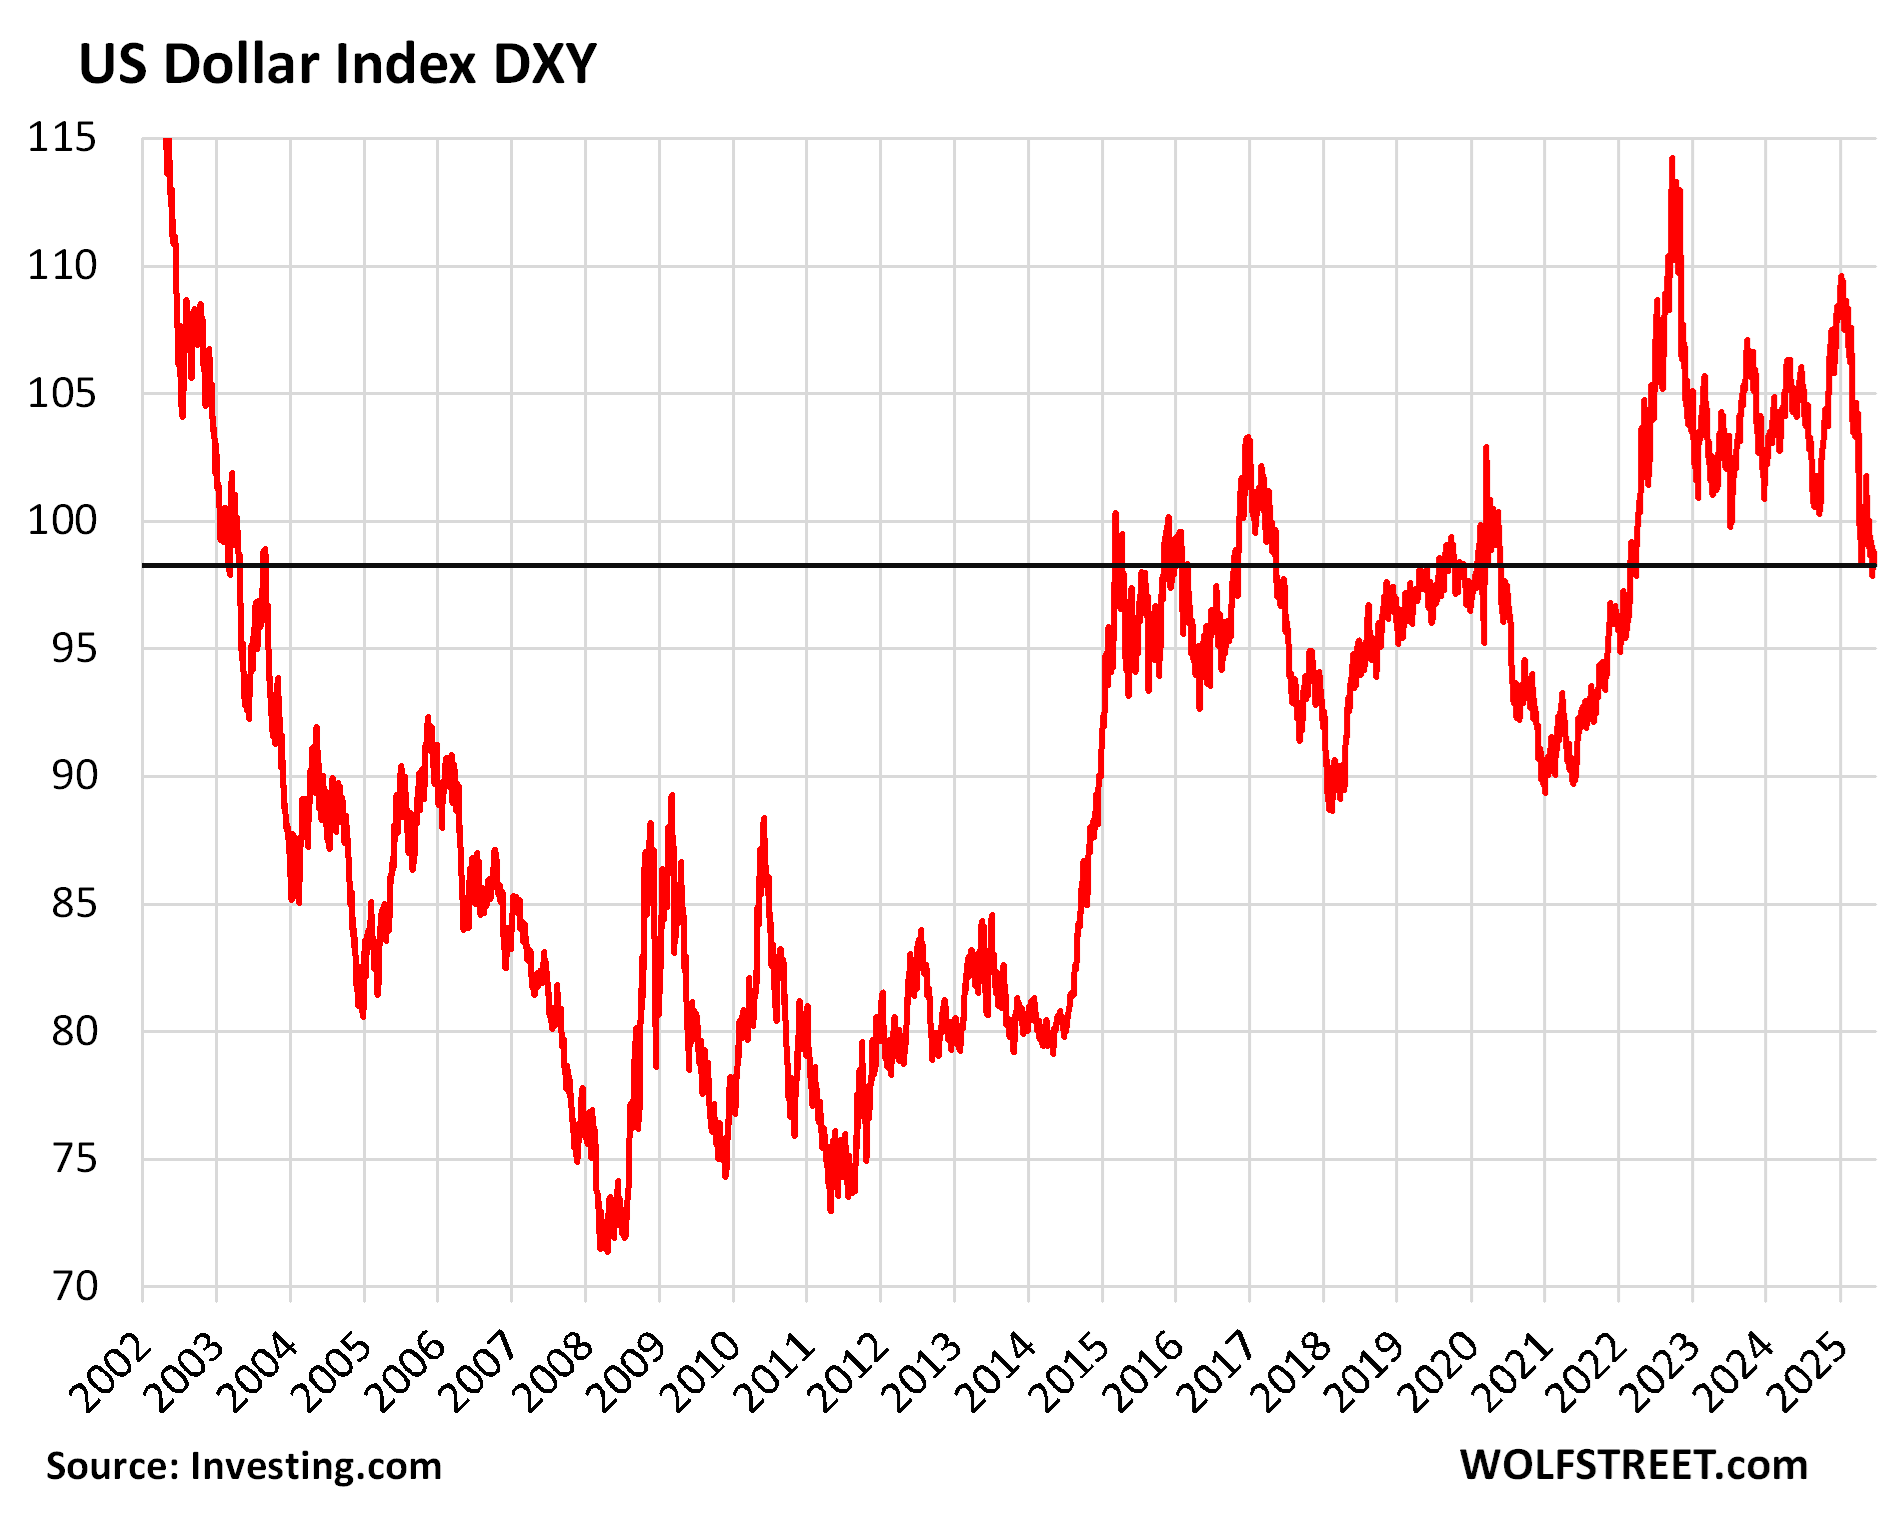
The DXY Dollar Index is dominated by the euro and the yen, but also includes in its basket four other currencies: British Pound Sterling, Canadian Dollar, Swedish Krona, and Swiss Franc. Canada is a big trading partner of the US, but the other three countries not so much. The currencies of countries that matter much more to US trade, such as China, Mexico, South Korea, Taiwan, etc., are not included in the DXY.
The DXY sits at 98.0 currently, after quite a drop from 110 in January 2025 and from 115 in October 2022. That 98-range is the lowest since April 2022. But it’s in the middle of the range over the past decade and far higher than in 2004 to 2014, when it had wallowed around in the mud sinking even below 75 for some periods during the Financial Crisis.
The DXY was set at 100 in 1973 when the data begins. So today’s reading is pretty close to 1973, but a lot has changed since then, including that several of the European currencies in the basket have been replaced by the euro, and that US imports shifted from Europe and Japan to China and Mexico, and that the relatively balanced trade in the 1970s deteriorated year after year and became what is now this mega-trade deficit in manufactured goods that the US has with the rest of the world.
When soft currencies are included in the basket…
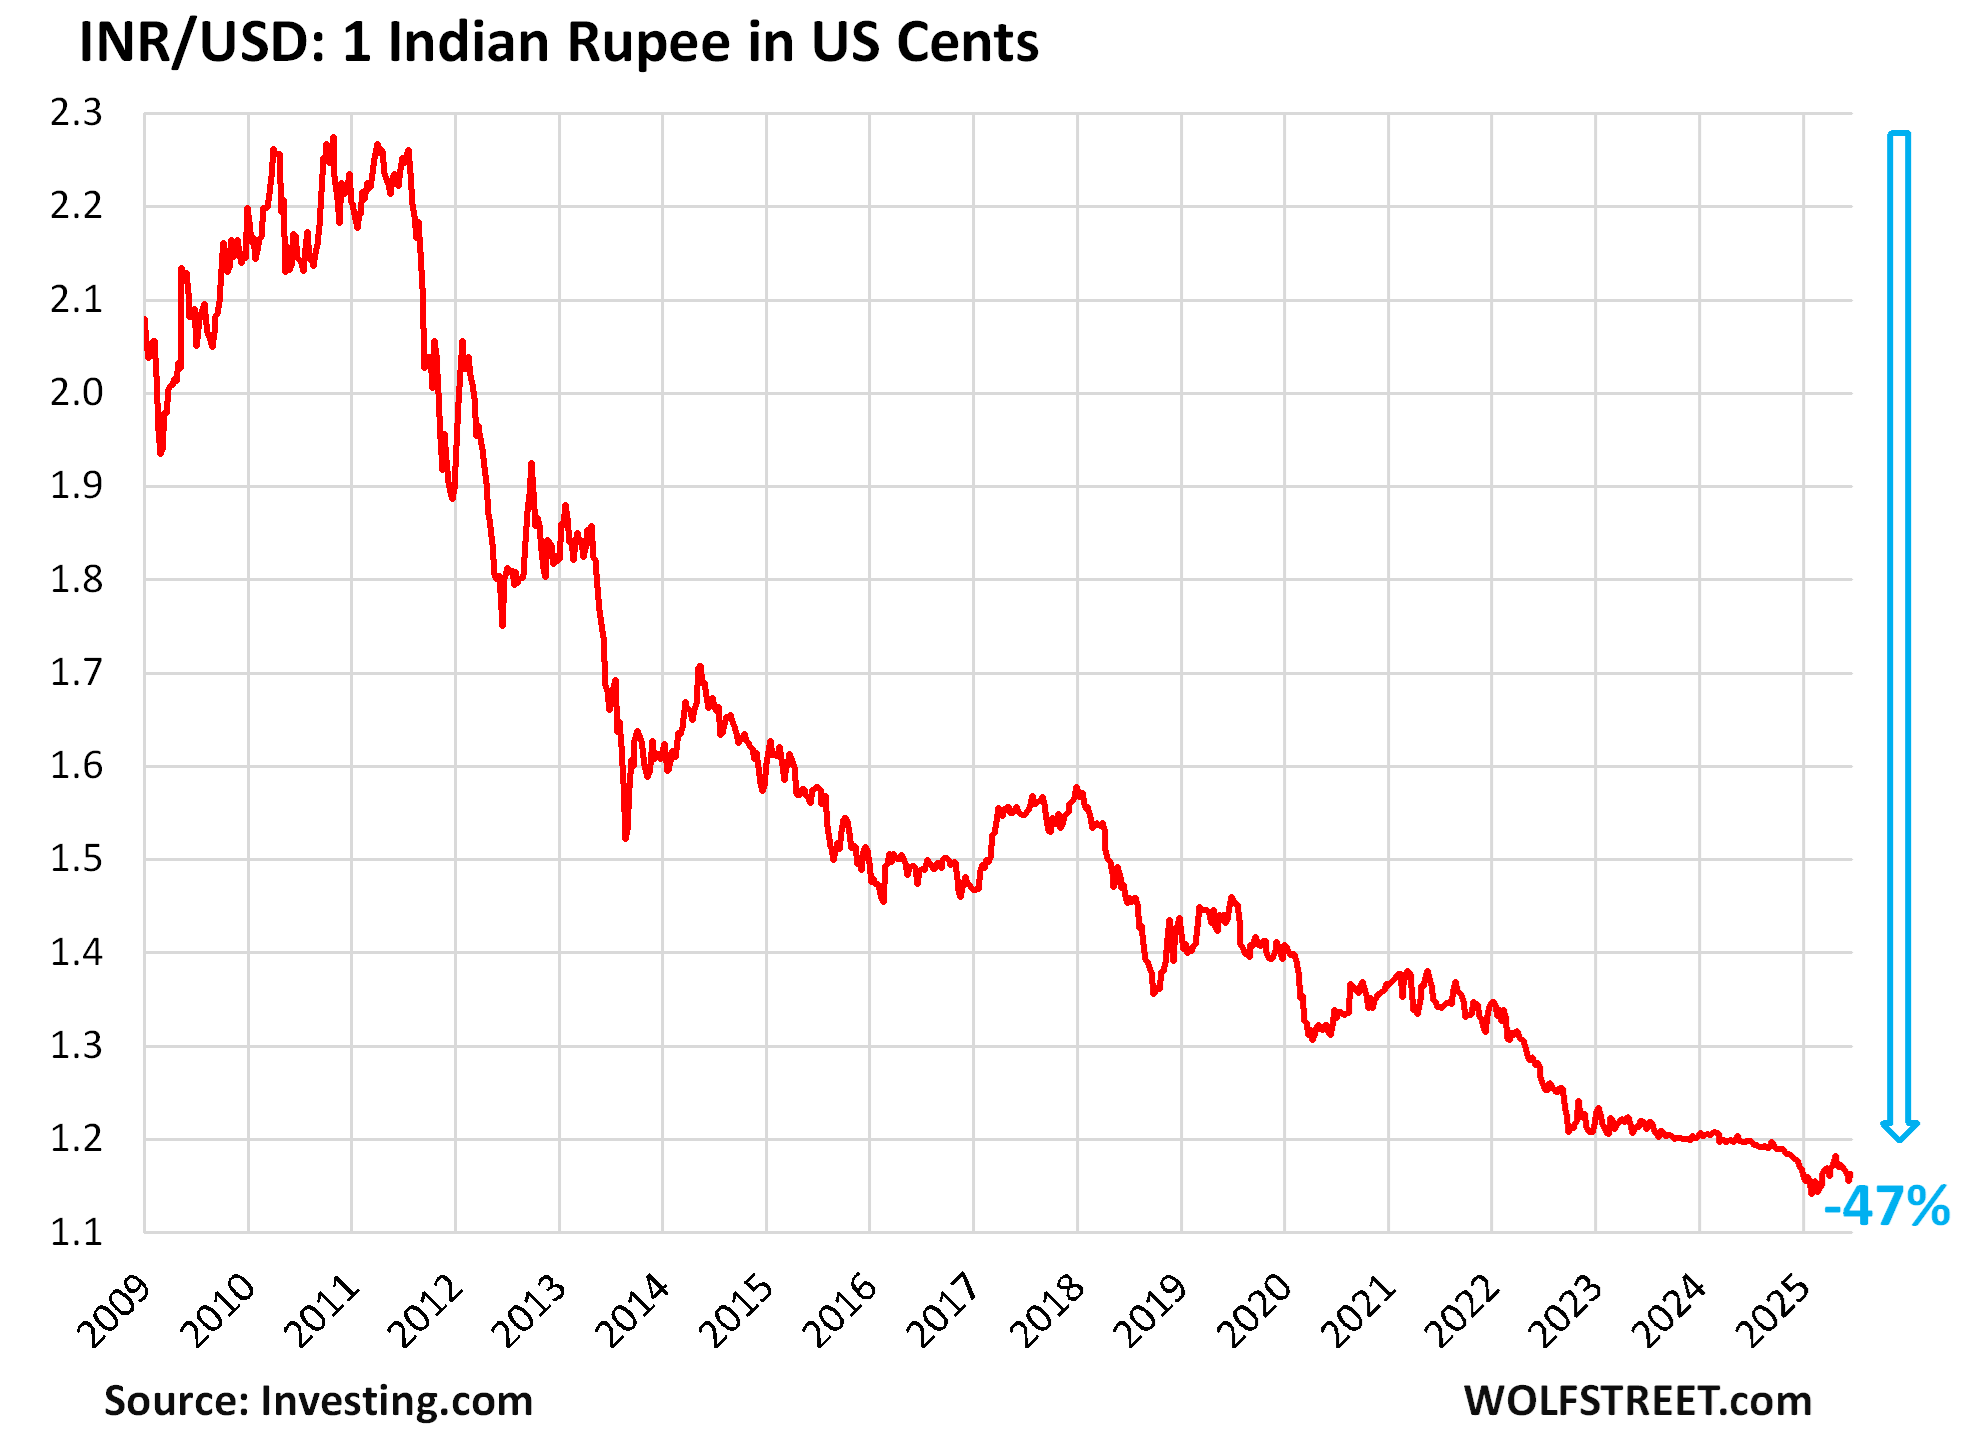
The WSJ Dollar Index is far broader. Its currency basket includes the six currencies of the DXY, plus, among many others, the Chinese RMB, Mexican peso, South Korean won, New Taiwan dollar, and Indian rupee. Each currency pair in the basket is weighted based on their share of the volume of global foreign exchange transactions. And some of those currencies keep skittering and sliding down that very slippery slope, such as the Indian rupee.
The Indian rupee [INR] has dropped to 1.16 US cents, down about 47% from the range in 2010. So this is in line with the collapse of the yen that had set the world atwitter, except for the rupee, it was just the normal progression of a currency of a developing economy, and it wasn’t a big deal.
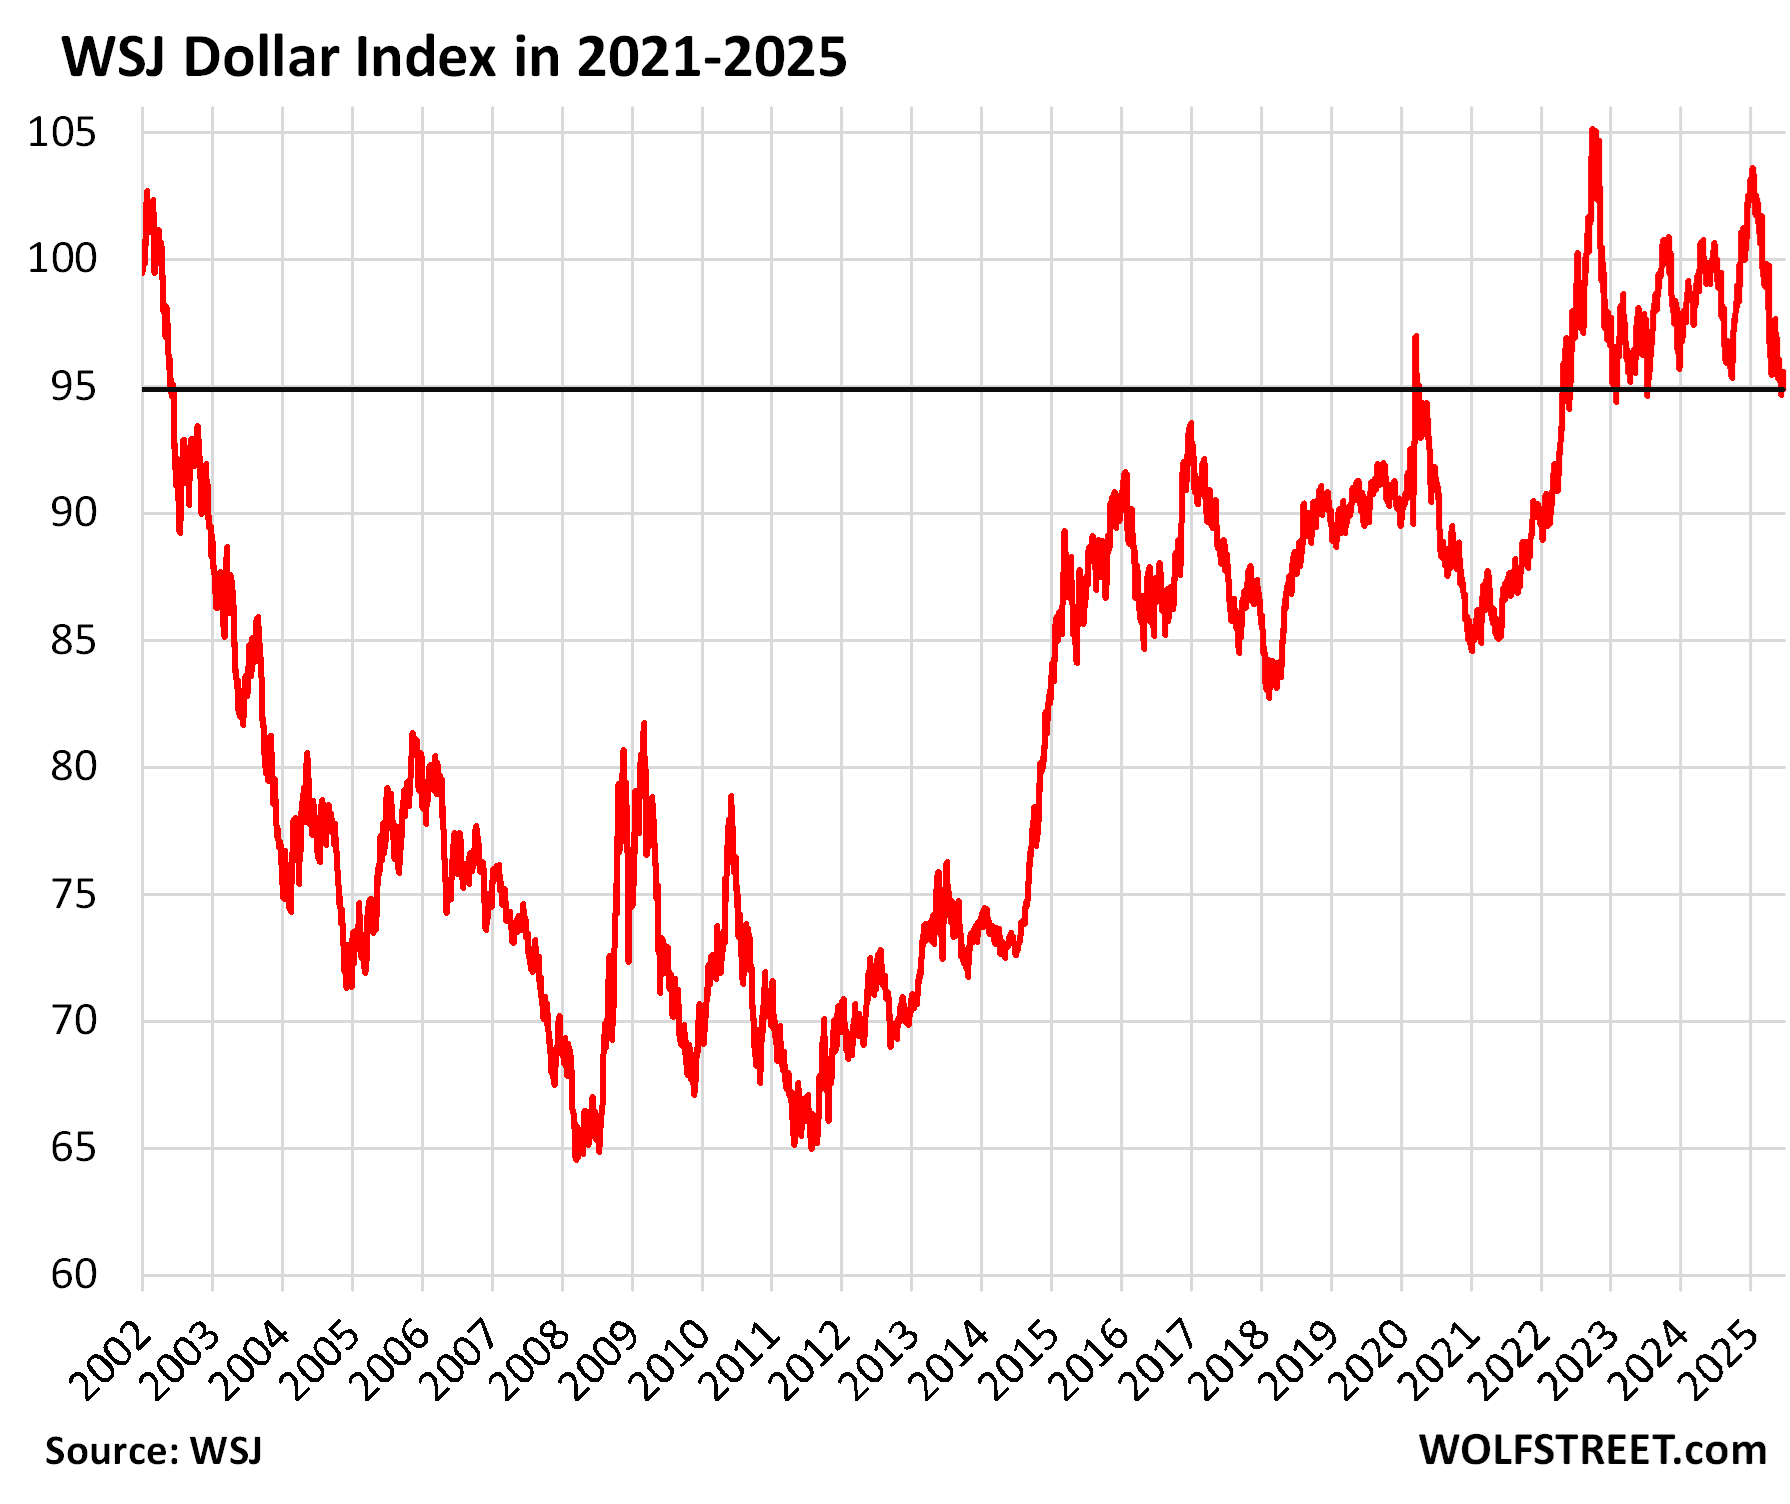
The WSJ Dollar Index, due to its larger basket of currencies that include the soft currencies of large US trading partners – currencies that have careened lower over the years – has declined by only about 8% this year, from 103 in early January to 94.9 currently.
But that 103 was a lofty level. The WSJ Dollar Index was set at 100 for June 2001, when the data begins, and the periods when the index was above 100 were brief and few.
Since 2022, the WSJ Dollar Index has dropped to about 95 several times, before bouncing off again.
In the two decades before 2022, the index pierced 95 from underneath only once briefly in March 2020.
Enjoy reading WOLF STREET and want to support it? You can donate. I appreciate it immensely. Click on the mug to find out how:

![]()
The post The Somewhat Bedraggled US Dollar against the Euro, Yen, Canadian Dollar, Dollar Indices, and Soft Currencies like the Indian Rupee appeared first on Energy News Beat.