Energy News Beat
The Producer Price Index is where tariffs will show up first, whether or not companies can pass on those cost increases.
By Wolf Richter for WOLF STREET.
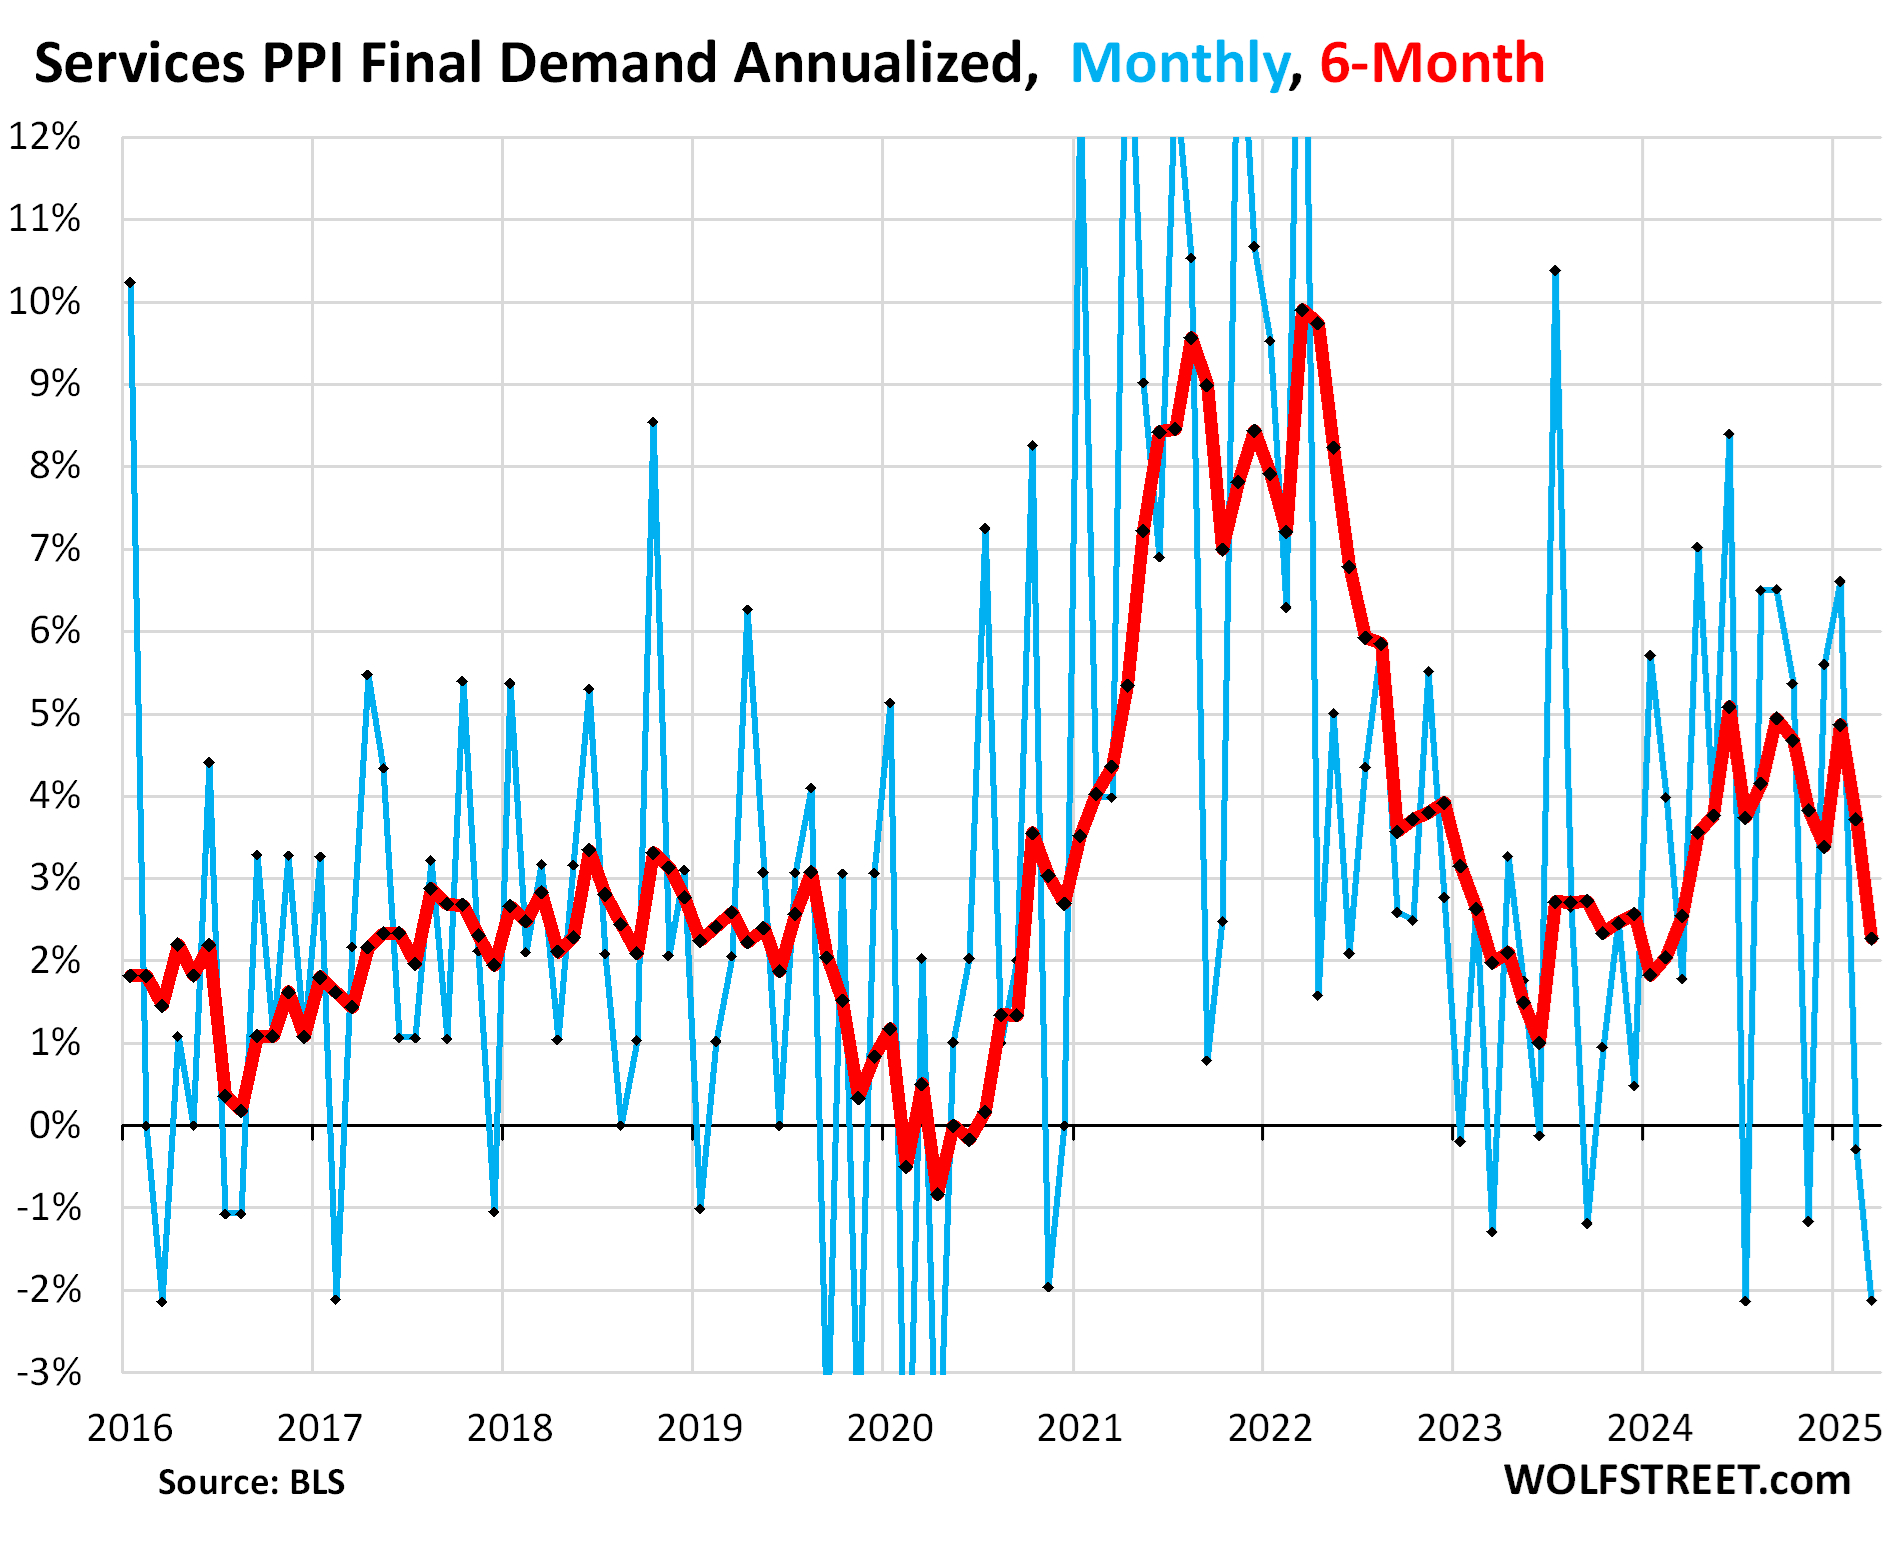
From mid-2024 through January 2025, before any new tariffs had been implemented, the PPI had shown substantial and accelerating inflation at the producer level – input costs for companies that they then try to pass on if they can. Most of those price increases occurred in services.
Today’s release of the PPI for March backpedaled on a month-to-month basis, pushed down by plunging prices of gasoline (-11% month to month), diesel, and jet fuel, dropping prices of foods (-2.1%, after February’s +1.7%), and dropping prices of an array of services, including final demand trade services (-0.7%), final demand transportation and warehousing services (-0.6%), machinery and vehicle wholesaling (-1.3%), airline passenger services, and retailing of food, apparel, jewelry, footwear, and accessories. Services dominate the PPI.
But some prices increased in March, including for steel mill products (+7.1% month to month); structural, architectural, and pre-engineered metal products; primary basic organic chemicals; plastic resins and materials; legal services (+1.5%); wholesaling of chemical products; and industrial electric power.
Overall PPI Final Demand: On a month-to-month basis, the PPI for March fell by 0.39% or by -4.6% annualized, the biggest drop since 2020 (blue in the chart below), which pushed down the 6-month increase to +2.3% annualized, the smallest increase in a year (red).
Just looking at the blue line in the chart, we see how much it jumps up and down. Any major drop into the negative was followed by a big jump, mostly the next month, or sometimes the month after. And that can be expected here too. This was one of those big dips that will be followed by a spike likely in April or maybe in May. That’s just how it is with volatile month-to-month data, which is why we’re more focused on the fat red line for the six-month rate.
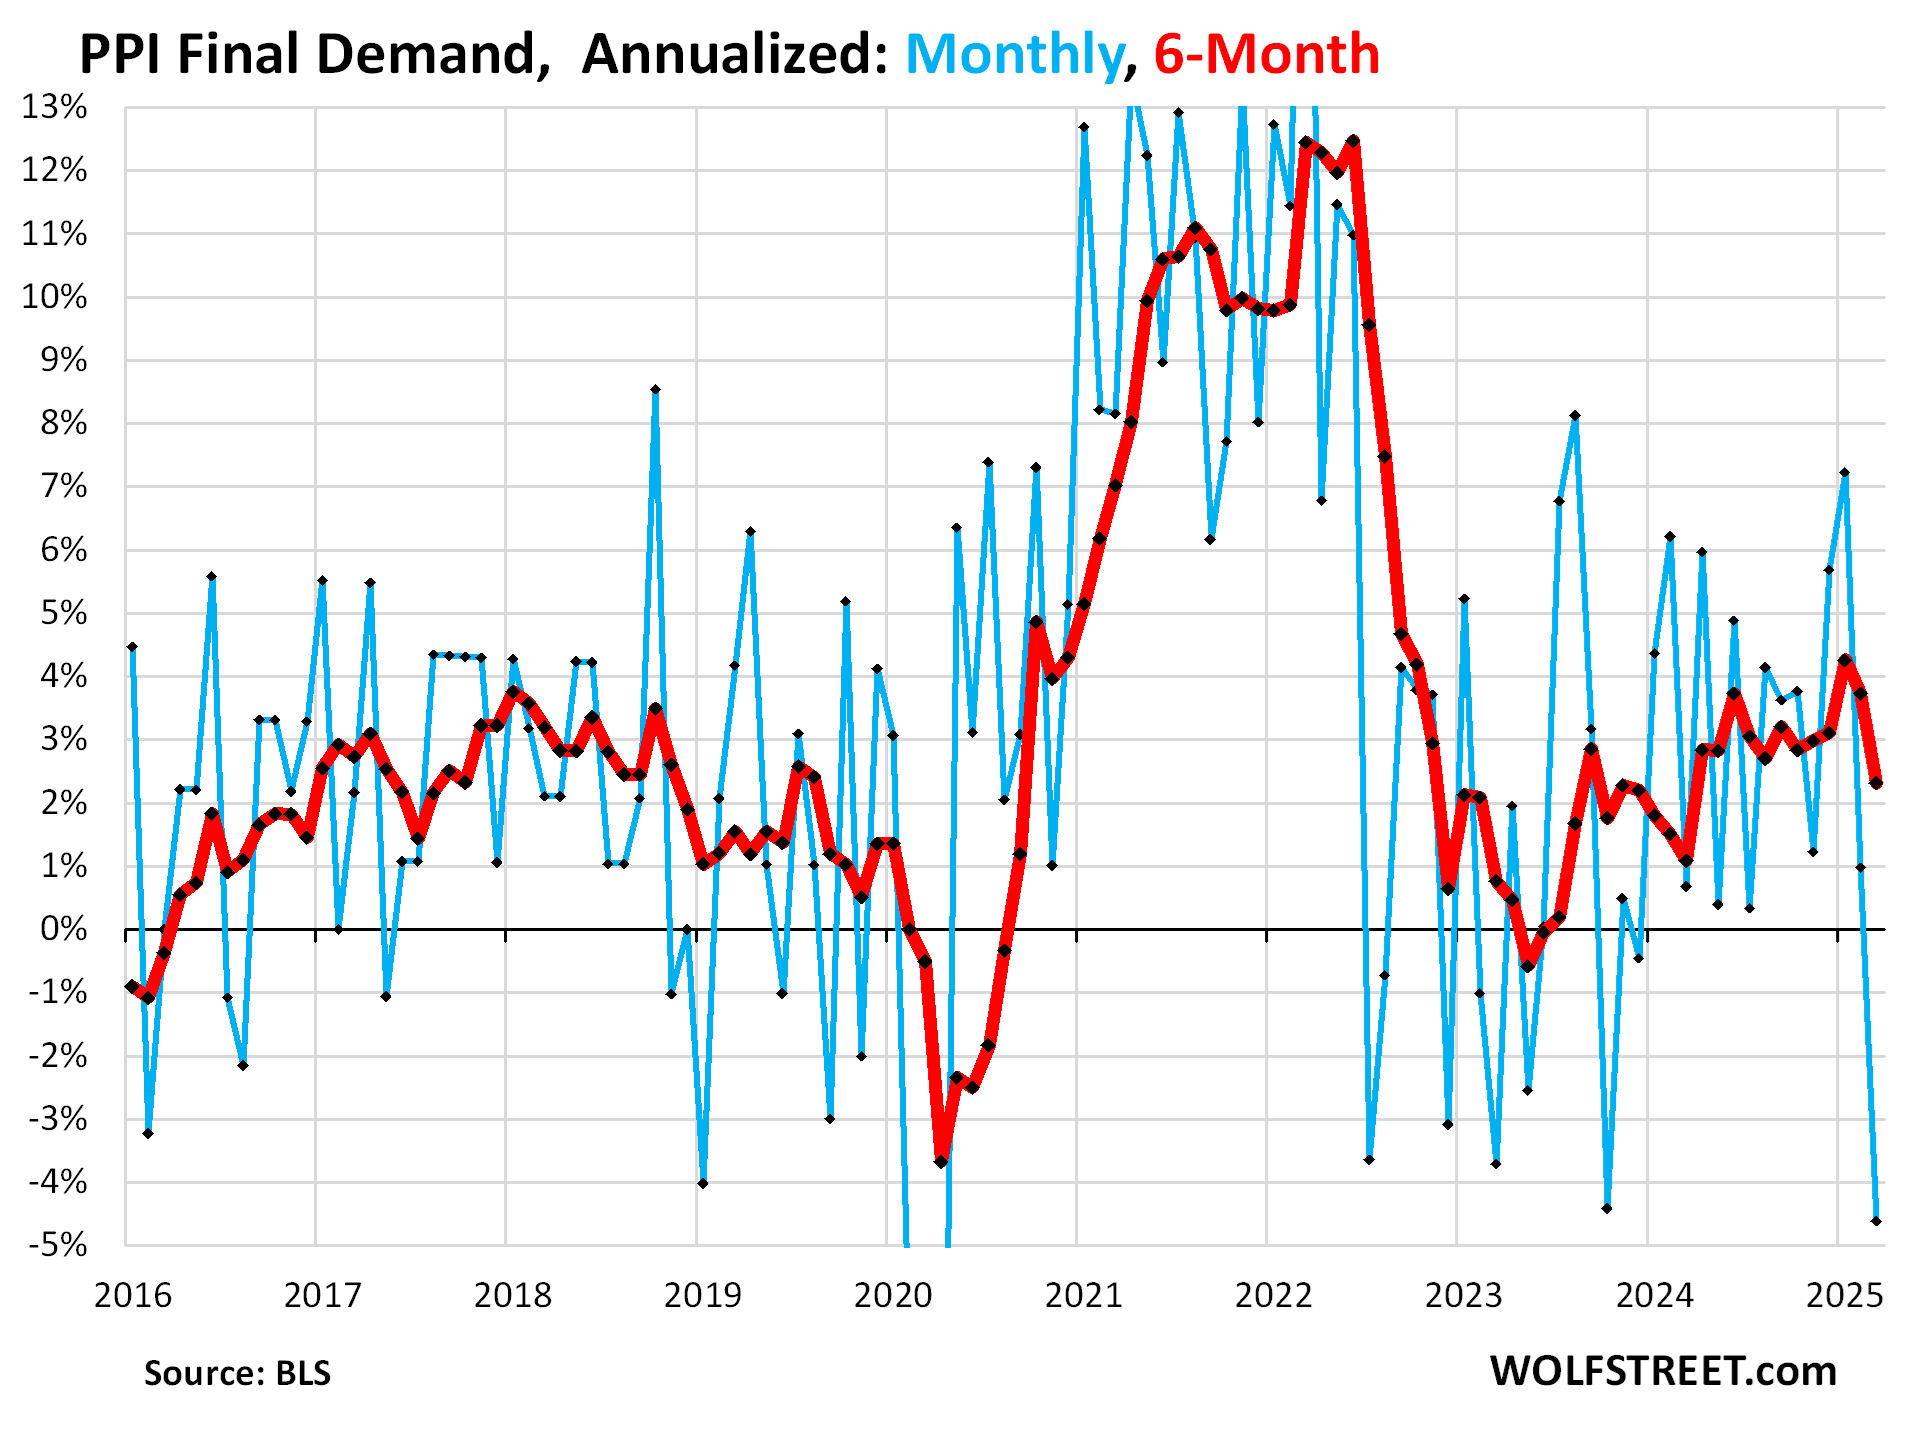
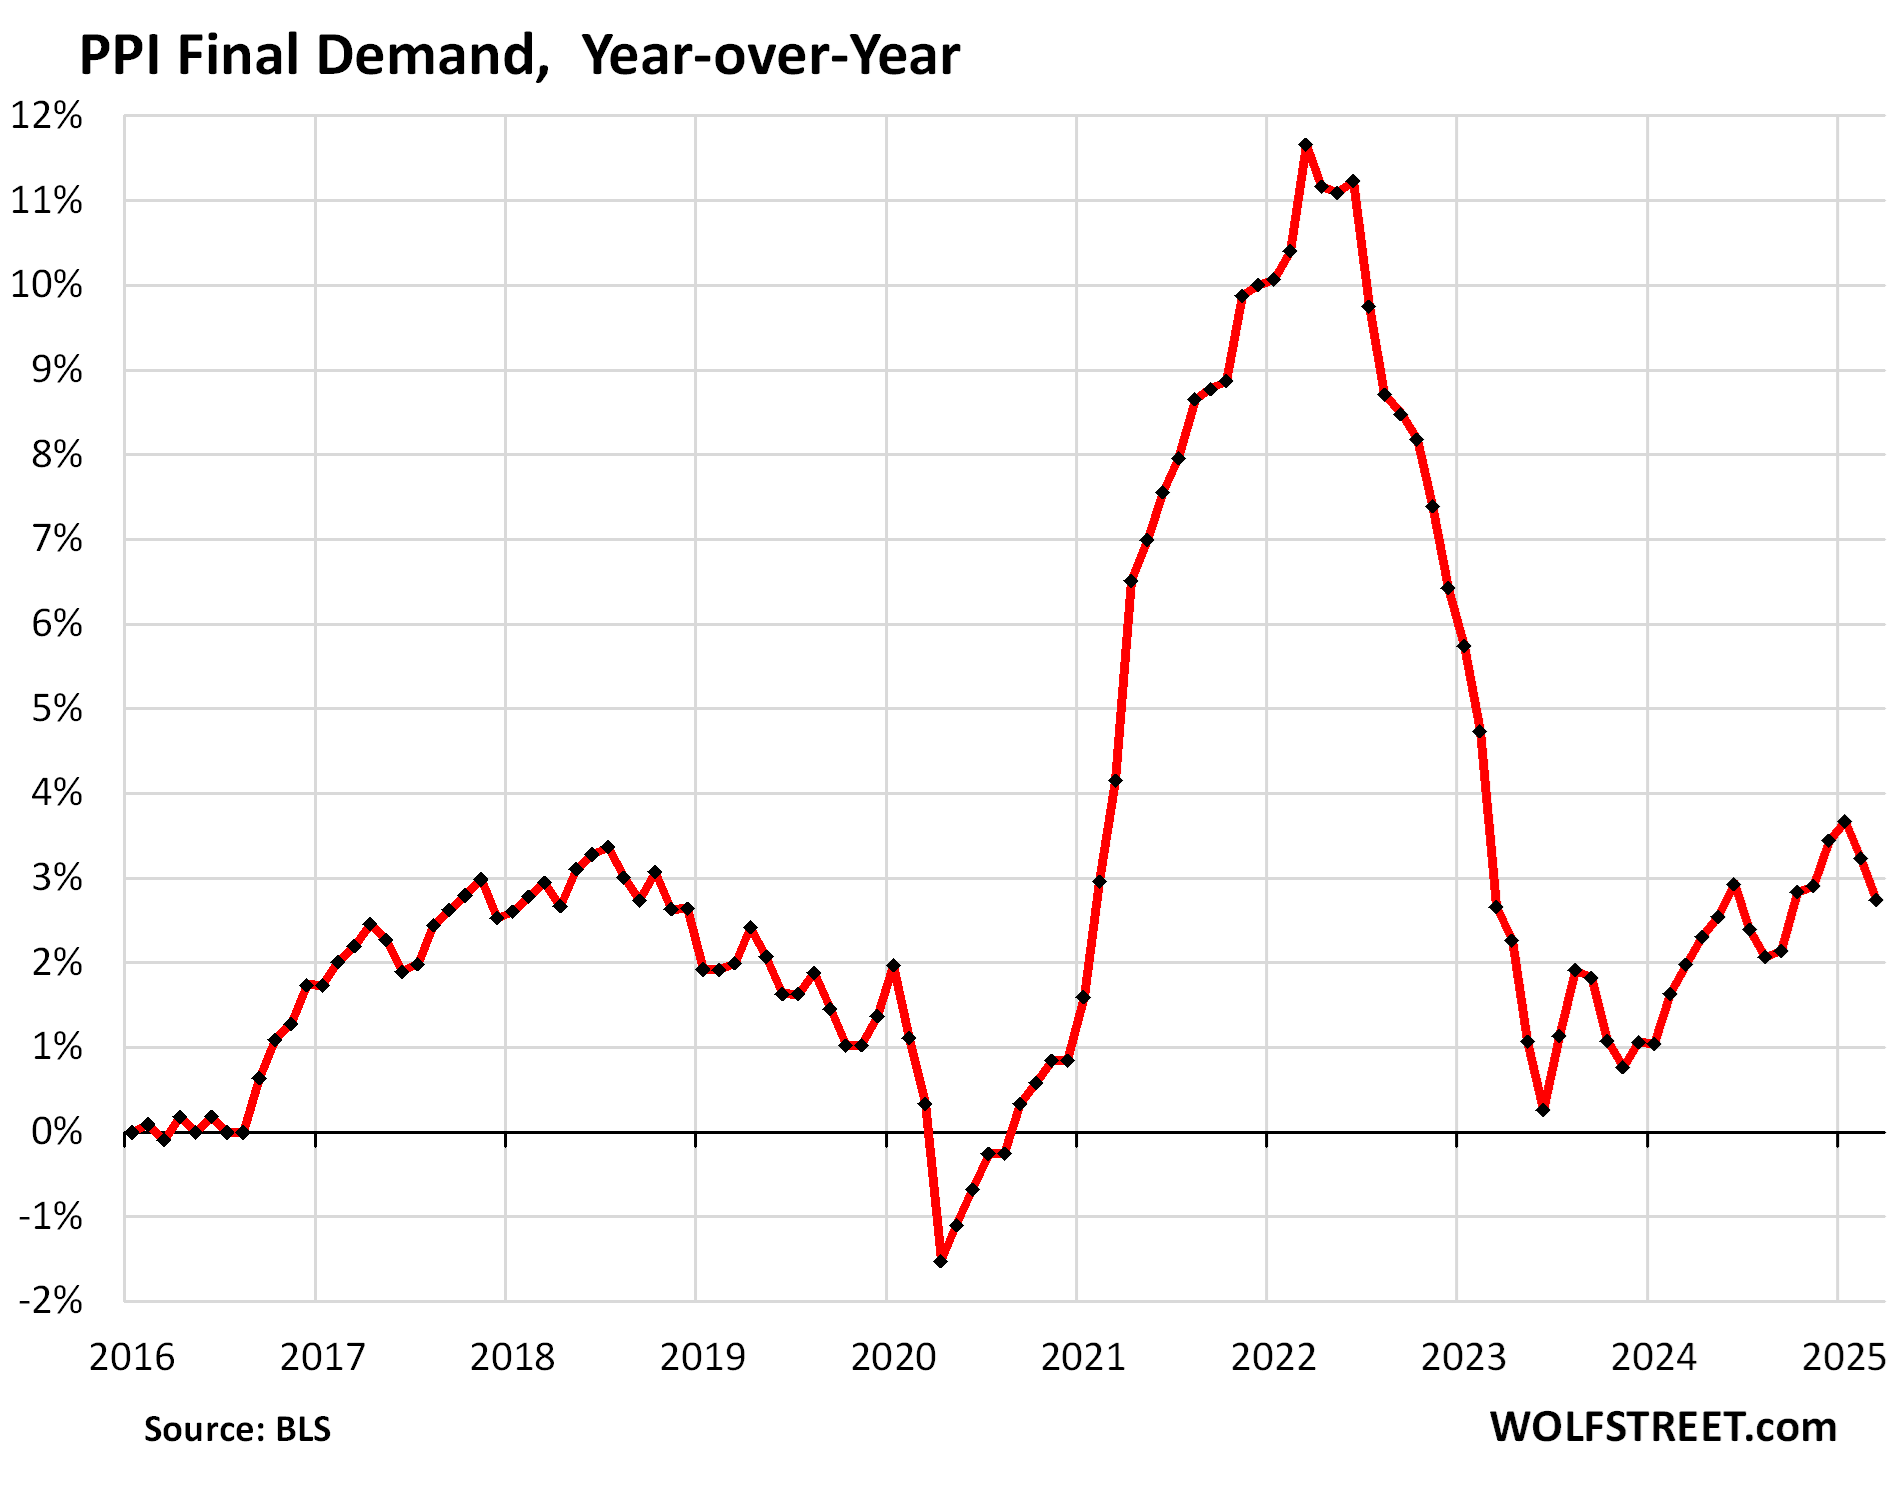
On a year-over-year basis, the PPI rose by 2.7%, the second month in a row of deceleration:
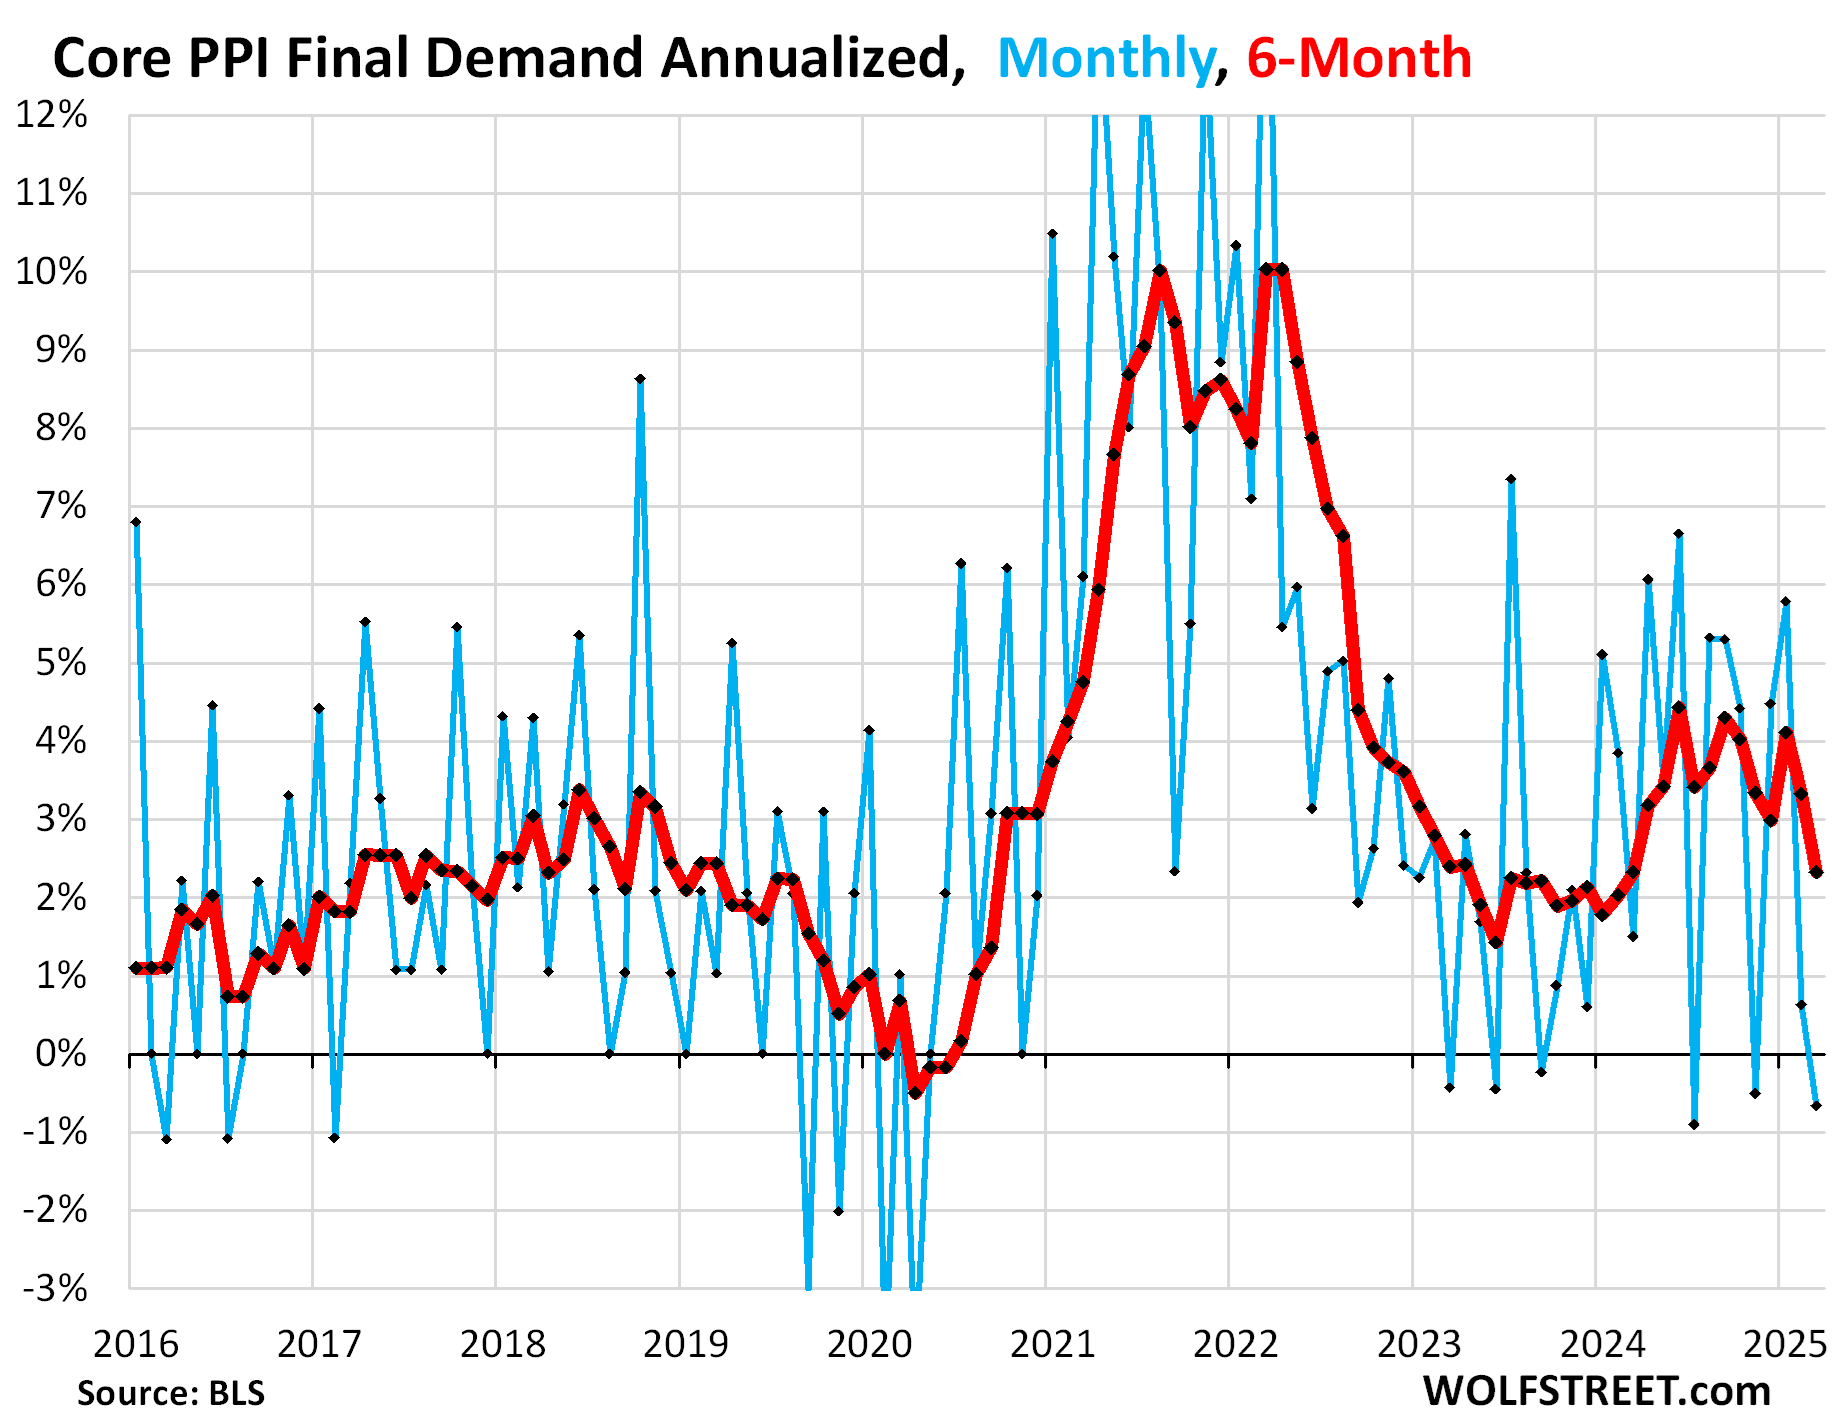
Without food & energy: “Core” PPI. Month-to-month, the core PPI for March fell by 0.07% (-0.7% annualized), which pushed down the 6-month increase to +2.3% annualized, the smallest increase since March 2024.
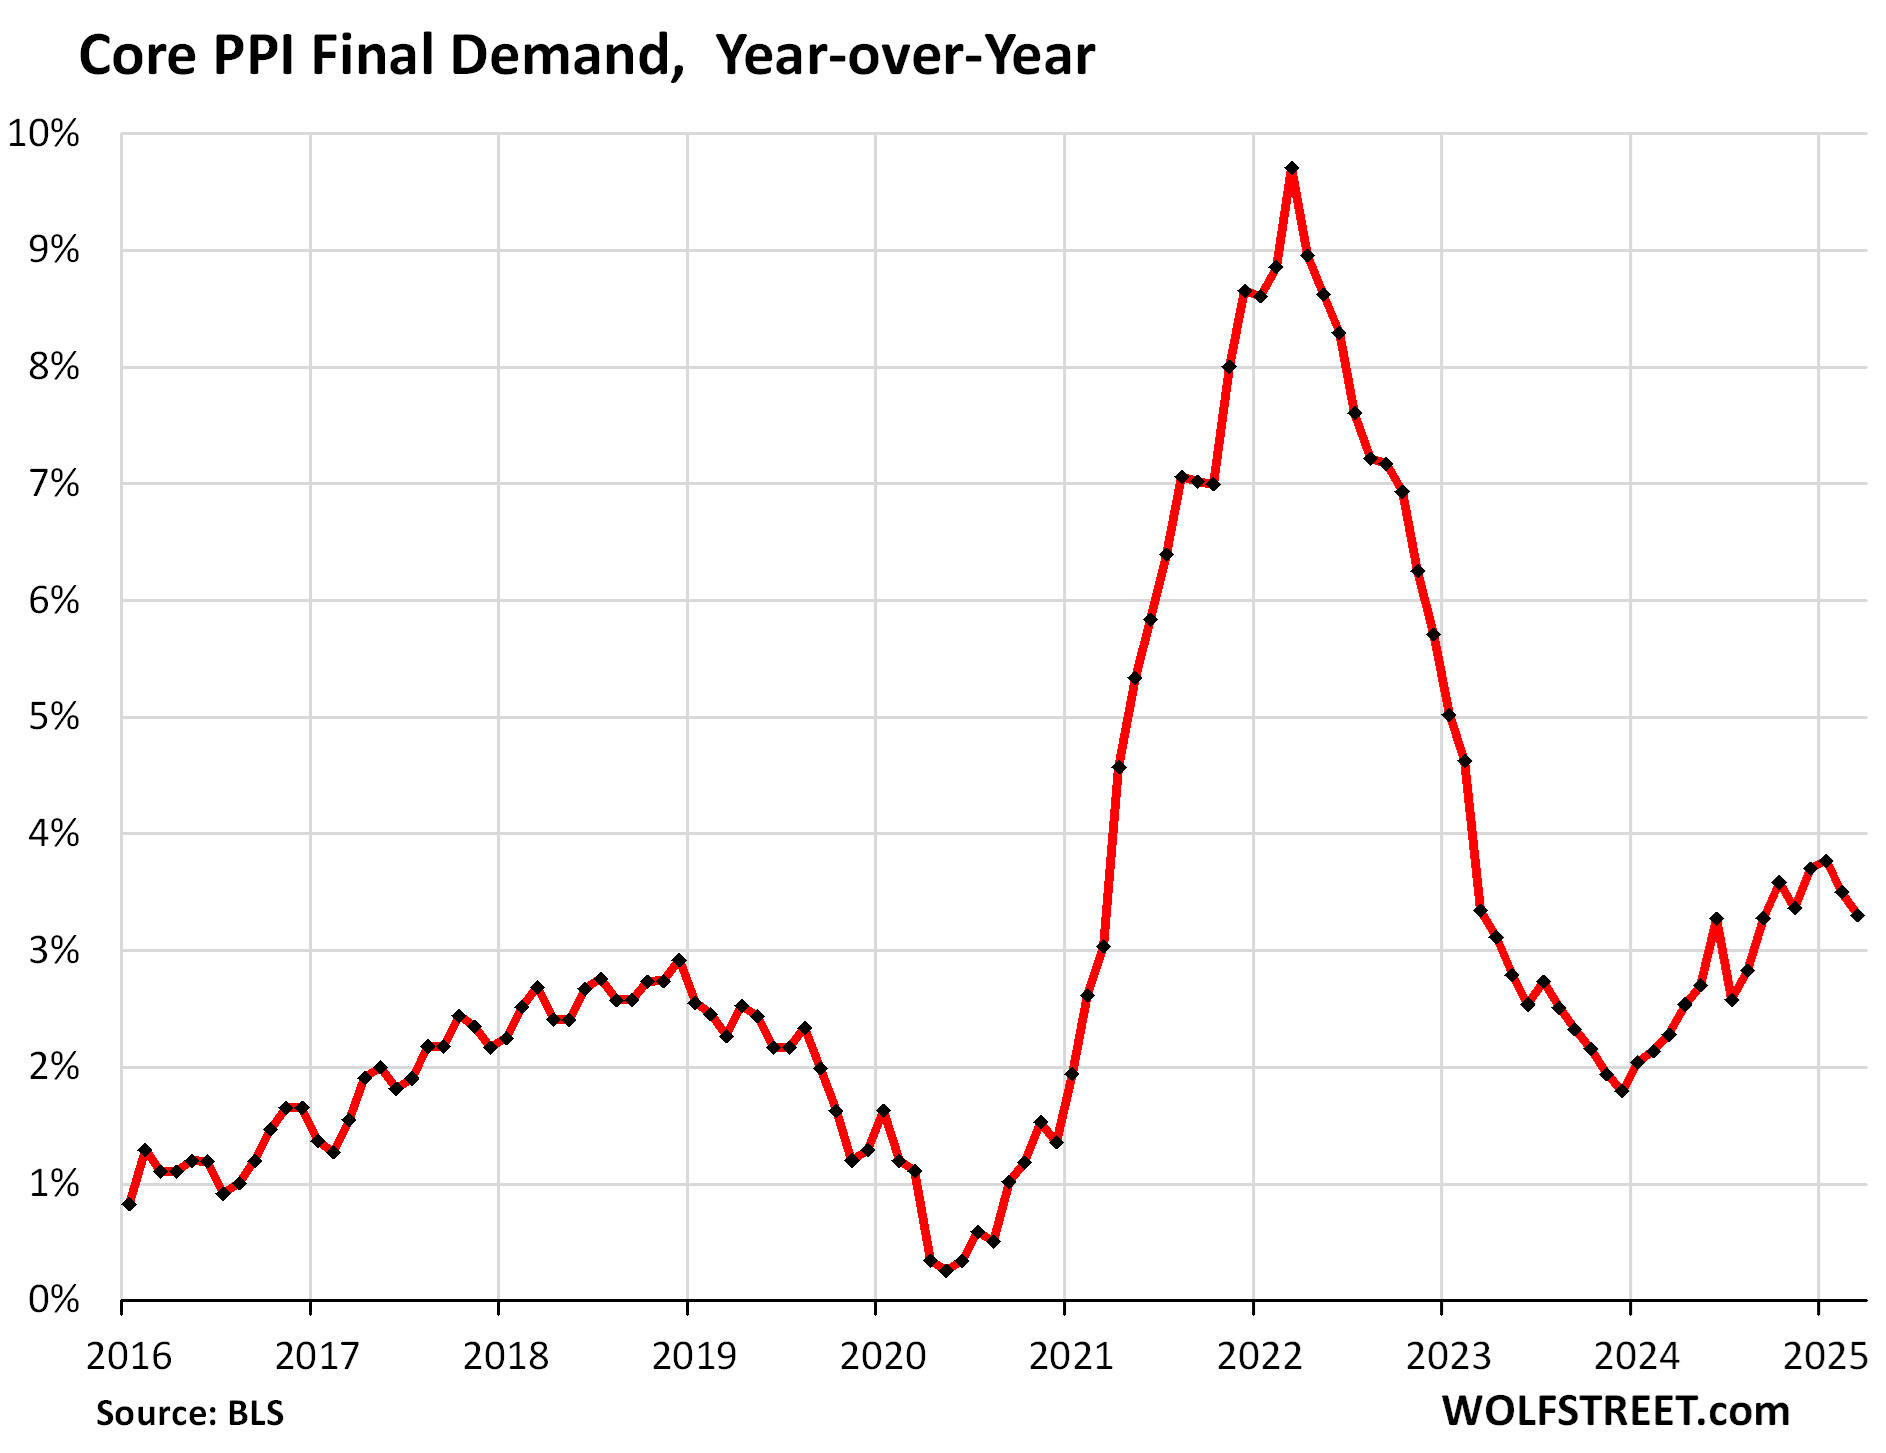
On a year-over-year basis, the core PPI rose by 3.3%, the second month in a row of deceleration:
The services PPI, which accounts for 67% of the overall PPI, declined by 0.18% in March from February (-2.1% annualized), the second decline in a row, which pushed down the six-month increase to +2.3%, the smallest increase since February 2024.
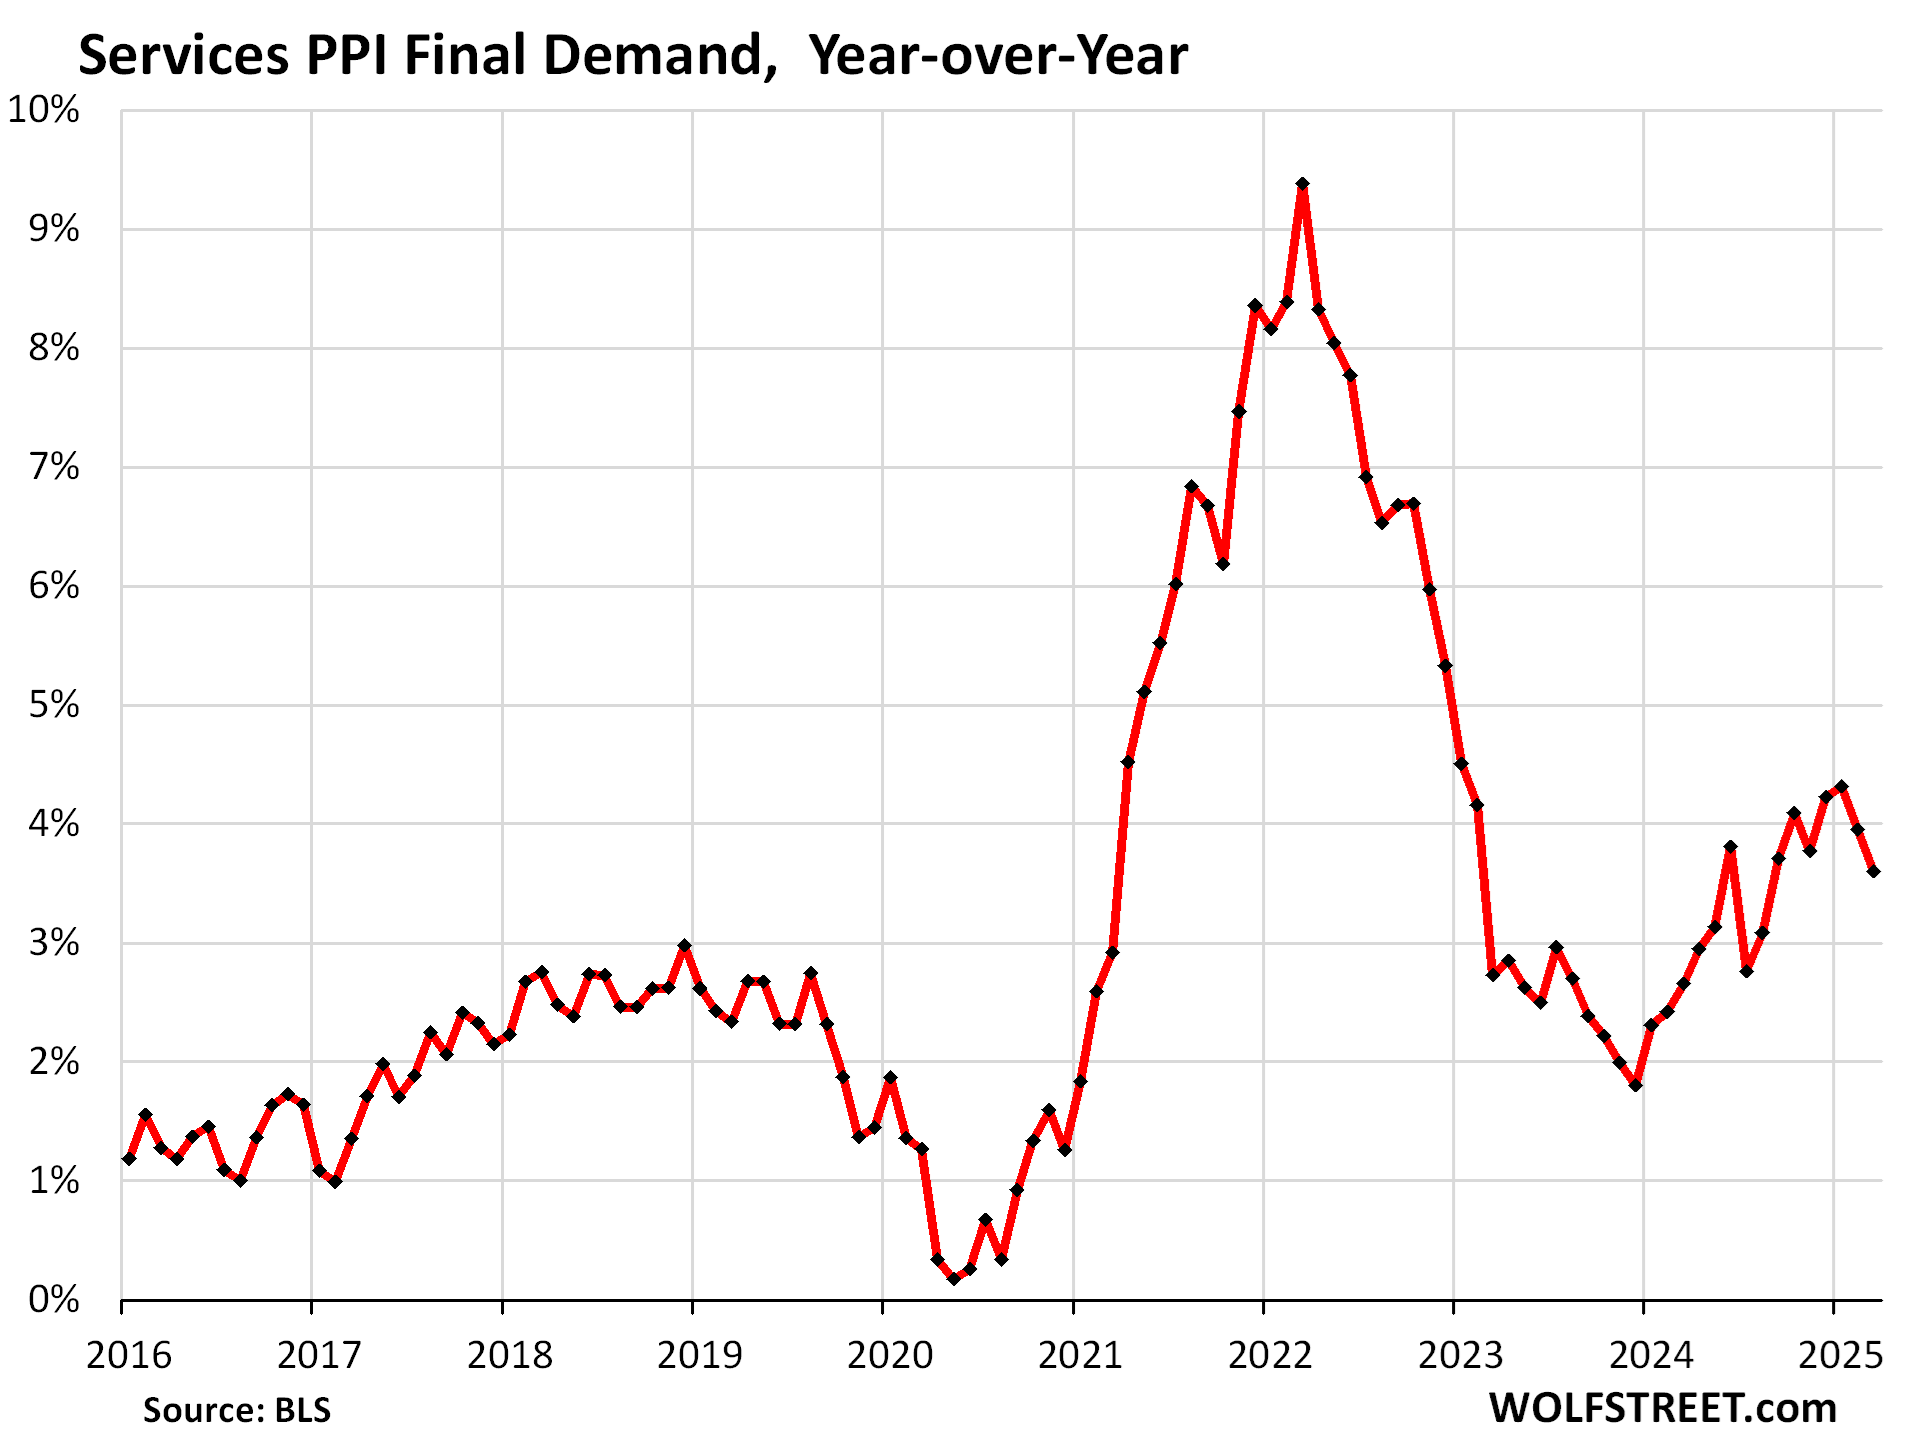
On a year-over-year basis, the services PPI rose by 3.6%, the second month in a row of deceleration:
The “core goods” PPI final demand – which excludes foods and energy where prices plunged in March – rose by 0.32% in March from February (+3.9% annualized), a deceleration from the prior month.
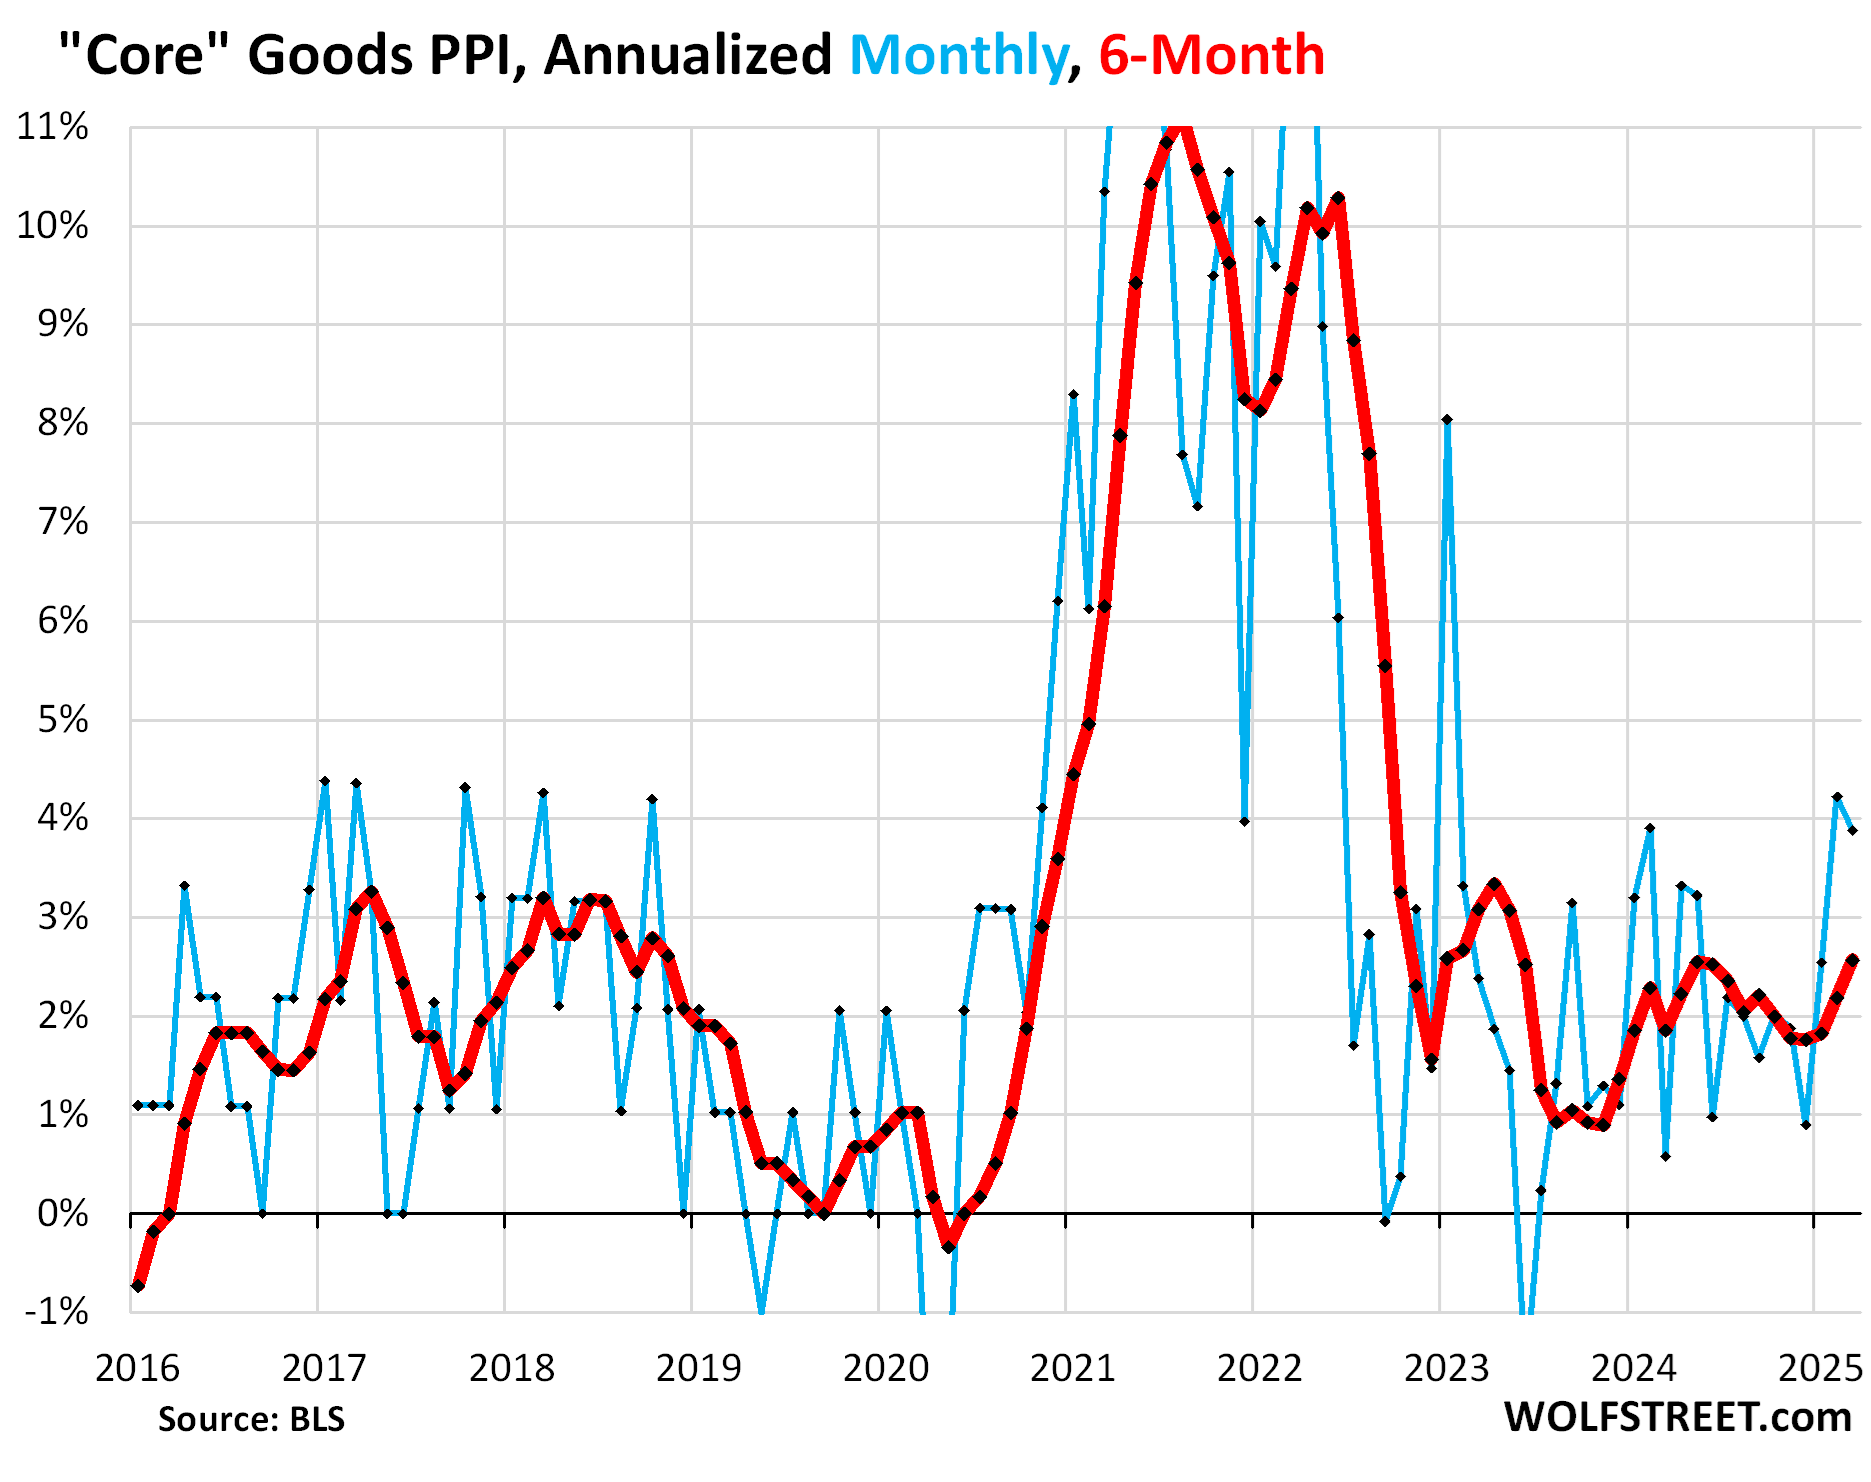
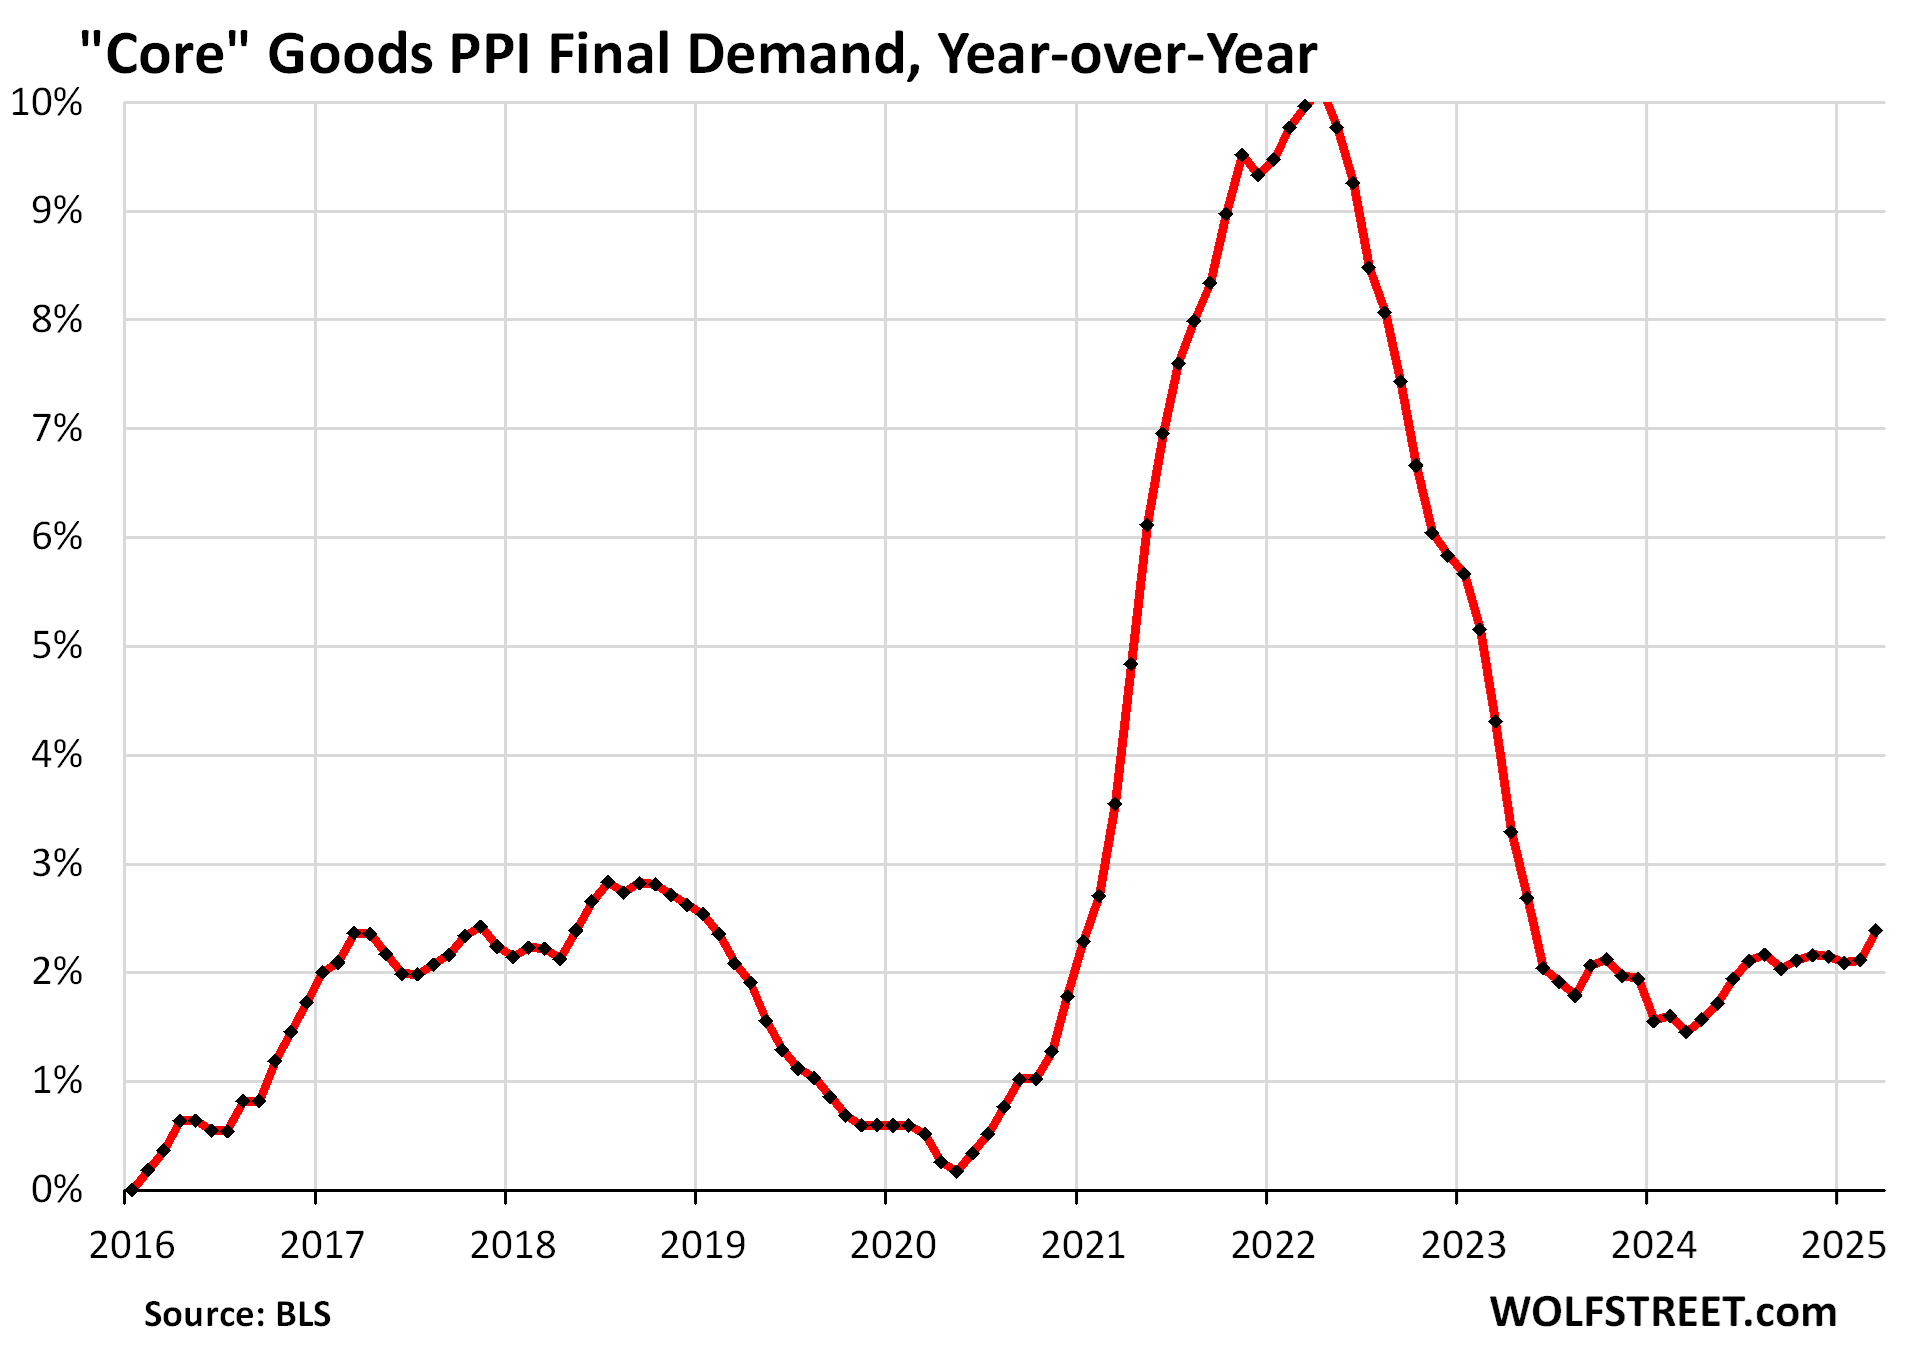
On a year-over-year basis, the core goods PPI rose by 2.4%. The visible steepening in the 12-month rate in March is a result of the 0.32% increase in March replacing the very low 0.05% increase of March 2024 (the “base effect”).
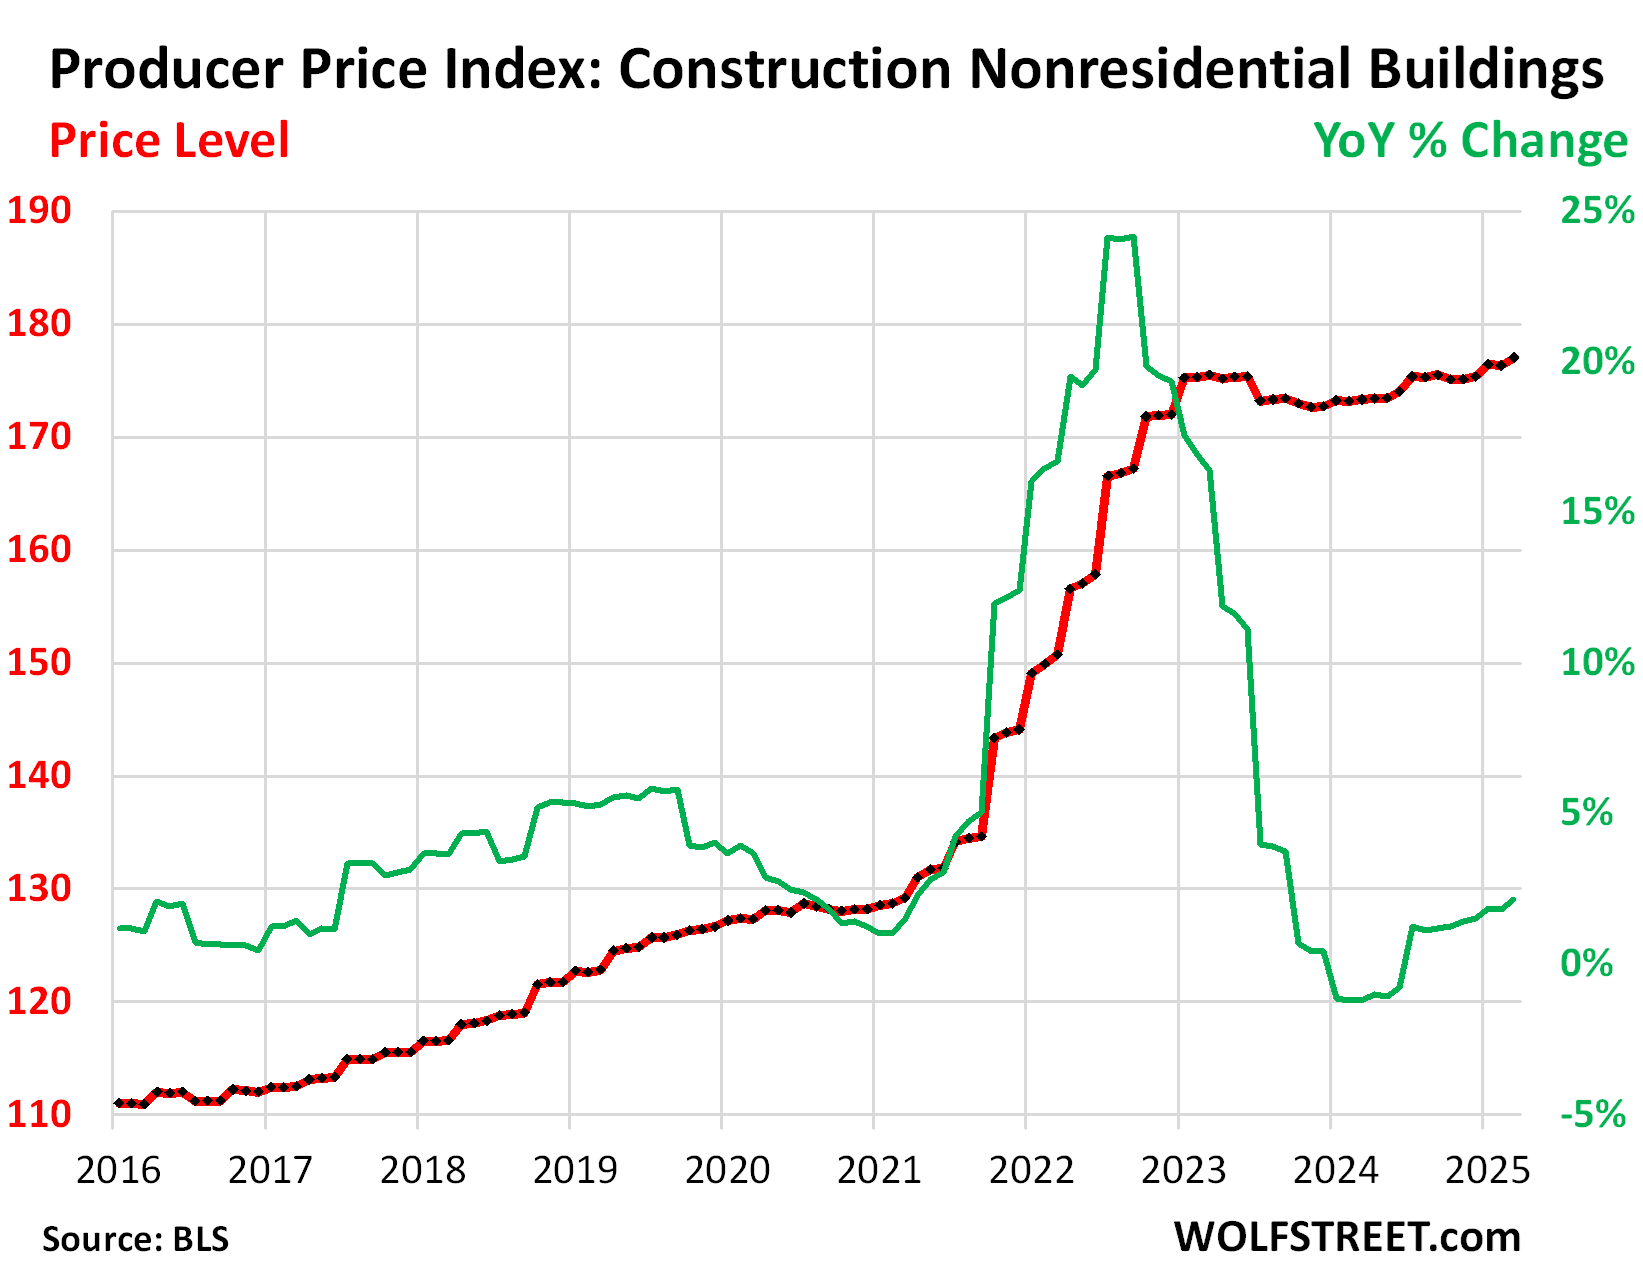
The PPI tracks the input costs for numerous specific industries. One of those industries is nonresidential construction. One segment of nonresidential construction that I tracked here, factory construction, has been in a mindboggling boom over the past three years, a result of the revival of high-end automated manufacturing in the US, and the huge amounts of investments that are being plowed into it.
As part of this factory construction boom, we also look at the PPI for nonresidential construction, which covers construction services as well as materials and supplies.
The PPI nonresidential construction had spiked horrendously in 2021 and 2022, but in 2023 and 2024 flattened out at high levels.
In March 2025, the price level of the PPI nonresidential construction was just a hair above where it had been two years earlier, in March 2023, with a sag in between (red line, left scale).
Month-to-month, the PPI nonresidential construction rose by 0.4% in March, following -0.1% in February and +0.6% in January.
Year-over-year, the PPI nonresidential construction rose by 2.1% in March (green line, right scale). After the surge during the pandemic, construction costs have proven to be very sticky overall, with some prices coming down, and others continuing to rise.
Enjoy reading WOLF STREET and want to support it? You can donate. I appreciate it immensely. Click on the mug to find out how:

![]()
The post PPI Pushed into Negative by Dropping Prices of Many Goods and Services appeared first on Energy News Beat.