Energy News Beat
By Wolf Richter for WOLF STREET.
As has been the case for many months, today’s Producer Price Index for January included big up-revisions of the prior month, driven by a whopper up-revision for services which account for two-thirds of the overall PPI. On top of these upwardly revised December figures, the PPI rose further in January.
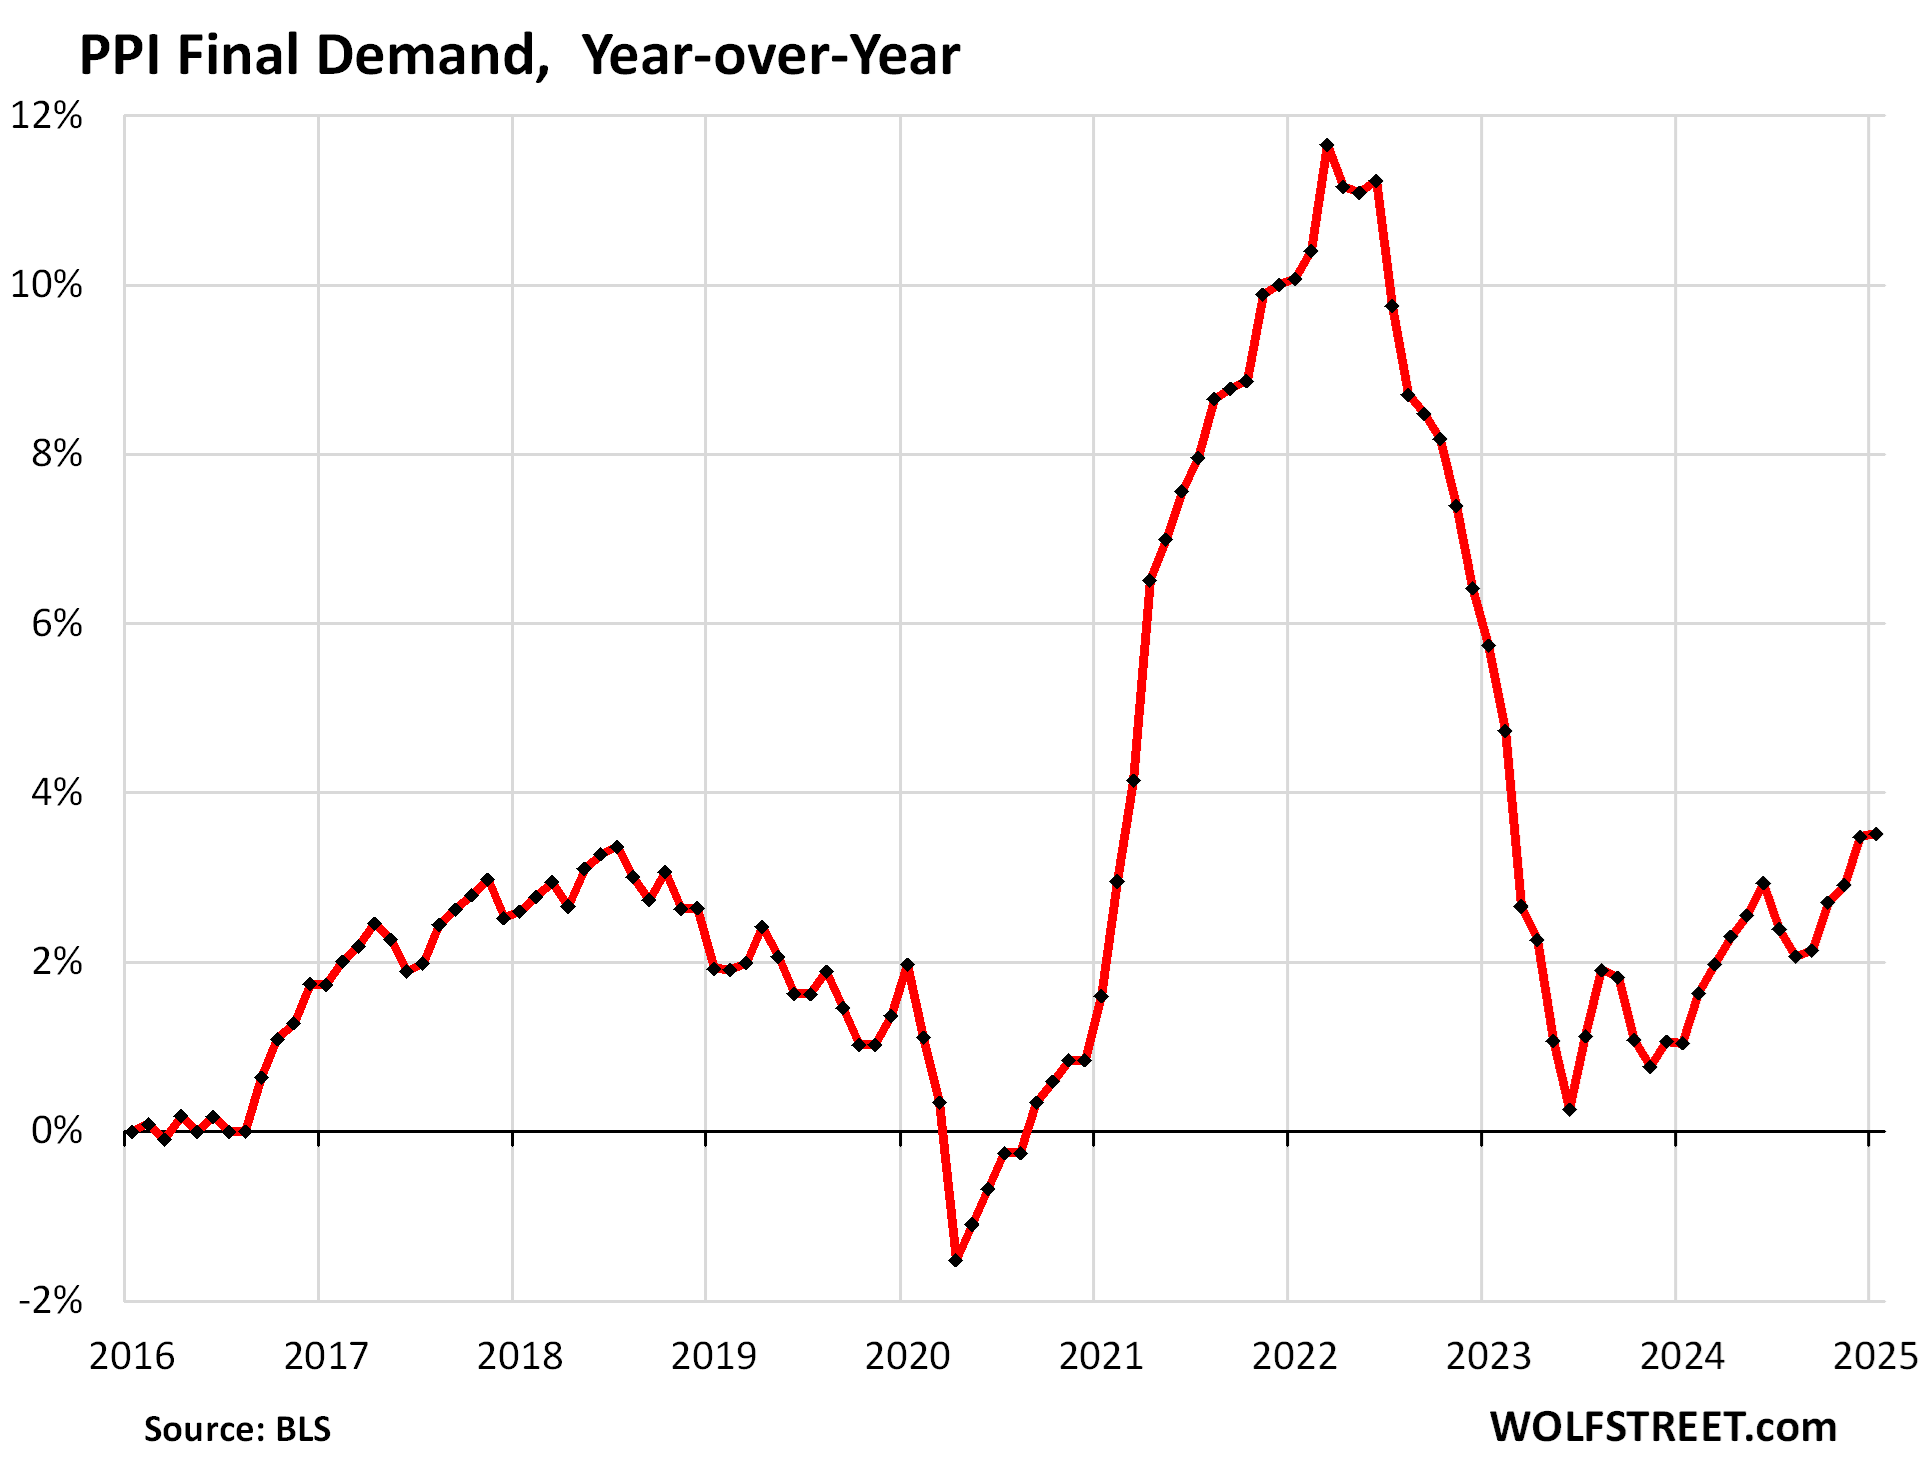
In January, the overall PPI accelerated to an increase of 3.51% year-over-year, the worst increase since February 2023, following a persistent zigzag line higher from the low point of near 0% in June 2023, driven largely by the services PPI.
And December was revised up to an increase of 3.48%, from 3.31% as reported a month ago. This up-revision was powered by a massive up-revision in services.
The PPI tracks inflation in goods and services that companies buy and whose higher costs they ultimately try to pass on to their customers.
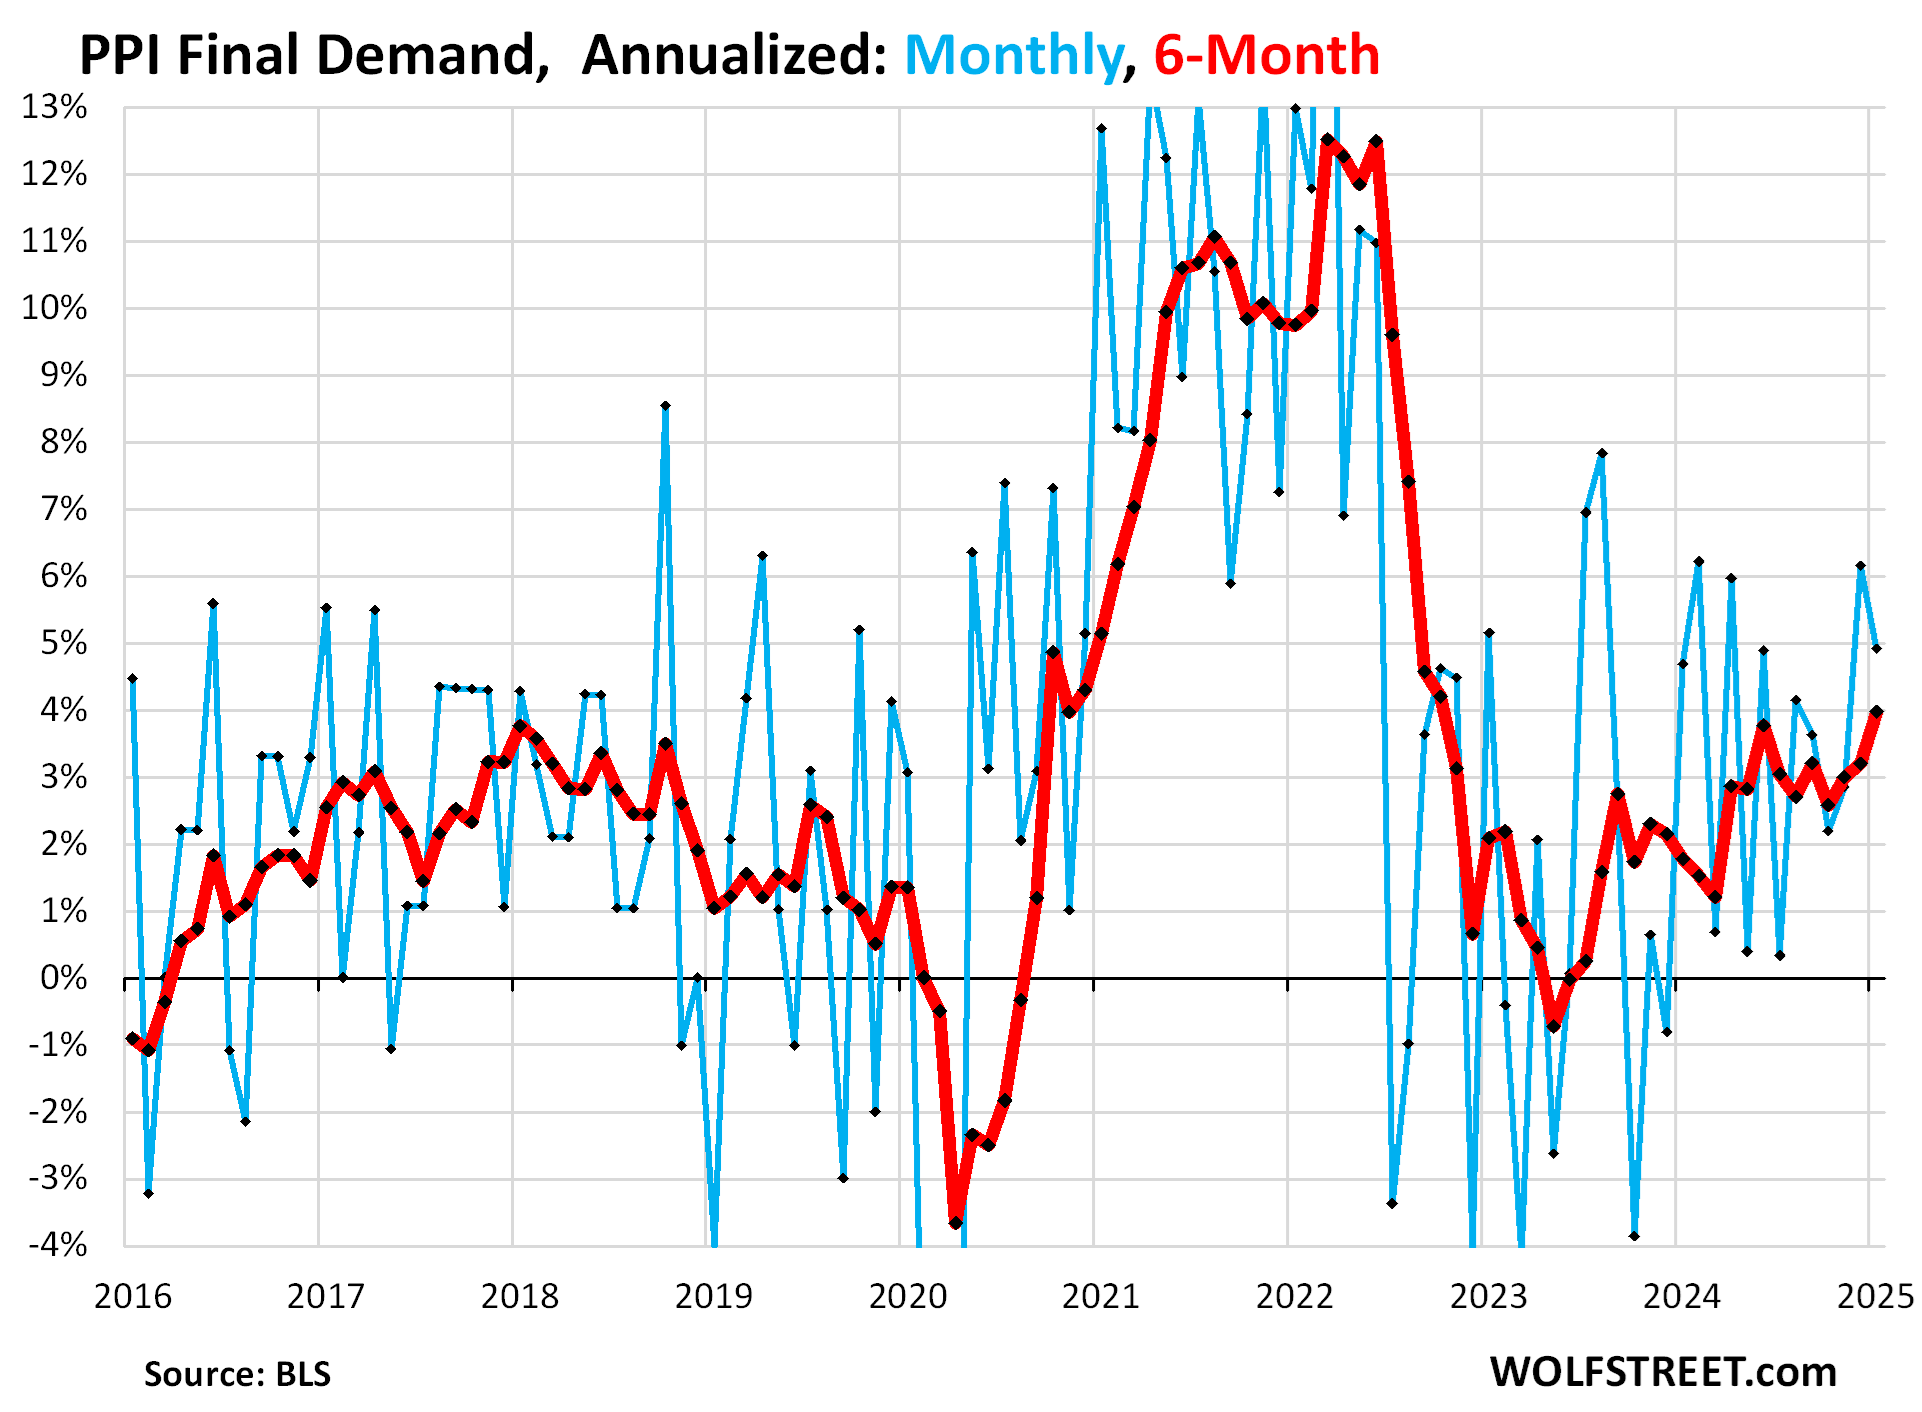
On a month-to-month basis, the PPI for final demand jumped by 0.40% (4.9% annualized) in January from December, seasonally adjusted.
And December’s increase was revised up to +0.50% (+6.2% annualized) from the previously reported +0.22% (+2.7% annualized). The up-revision more than doubled the increase! This was driven by the whopper up-revision of the Services PPI.
The up-revision for December plus January’s increase caused the 6-month PPI to surge to +4.0% annualized, the worst increase since October 2022 (red).
The plunge in energy prices from mid-2022 through September 2024 had cooled the overall PPI increases into the pre-pandemic range, and papered over the inflationary forces in services. But since October, energy prices stopped dropping and flipped to increases. In January, energy prices jumped by 1.7% from December, which wiped out the remainder of the year-over-year drop, and the index was unchanged year-over-year.
Food prices jumped by 1.1% in January from December and by 5.5% year-over-year. The avian flu’s impact on egg production had some impact here.
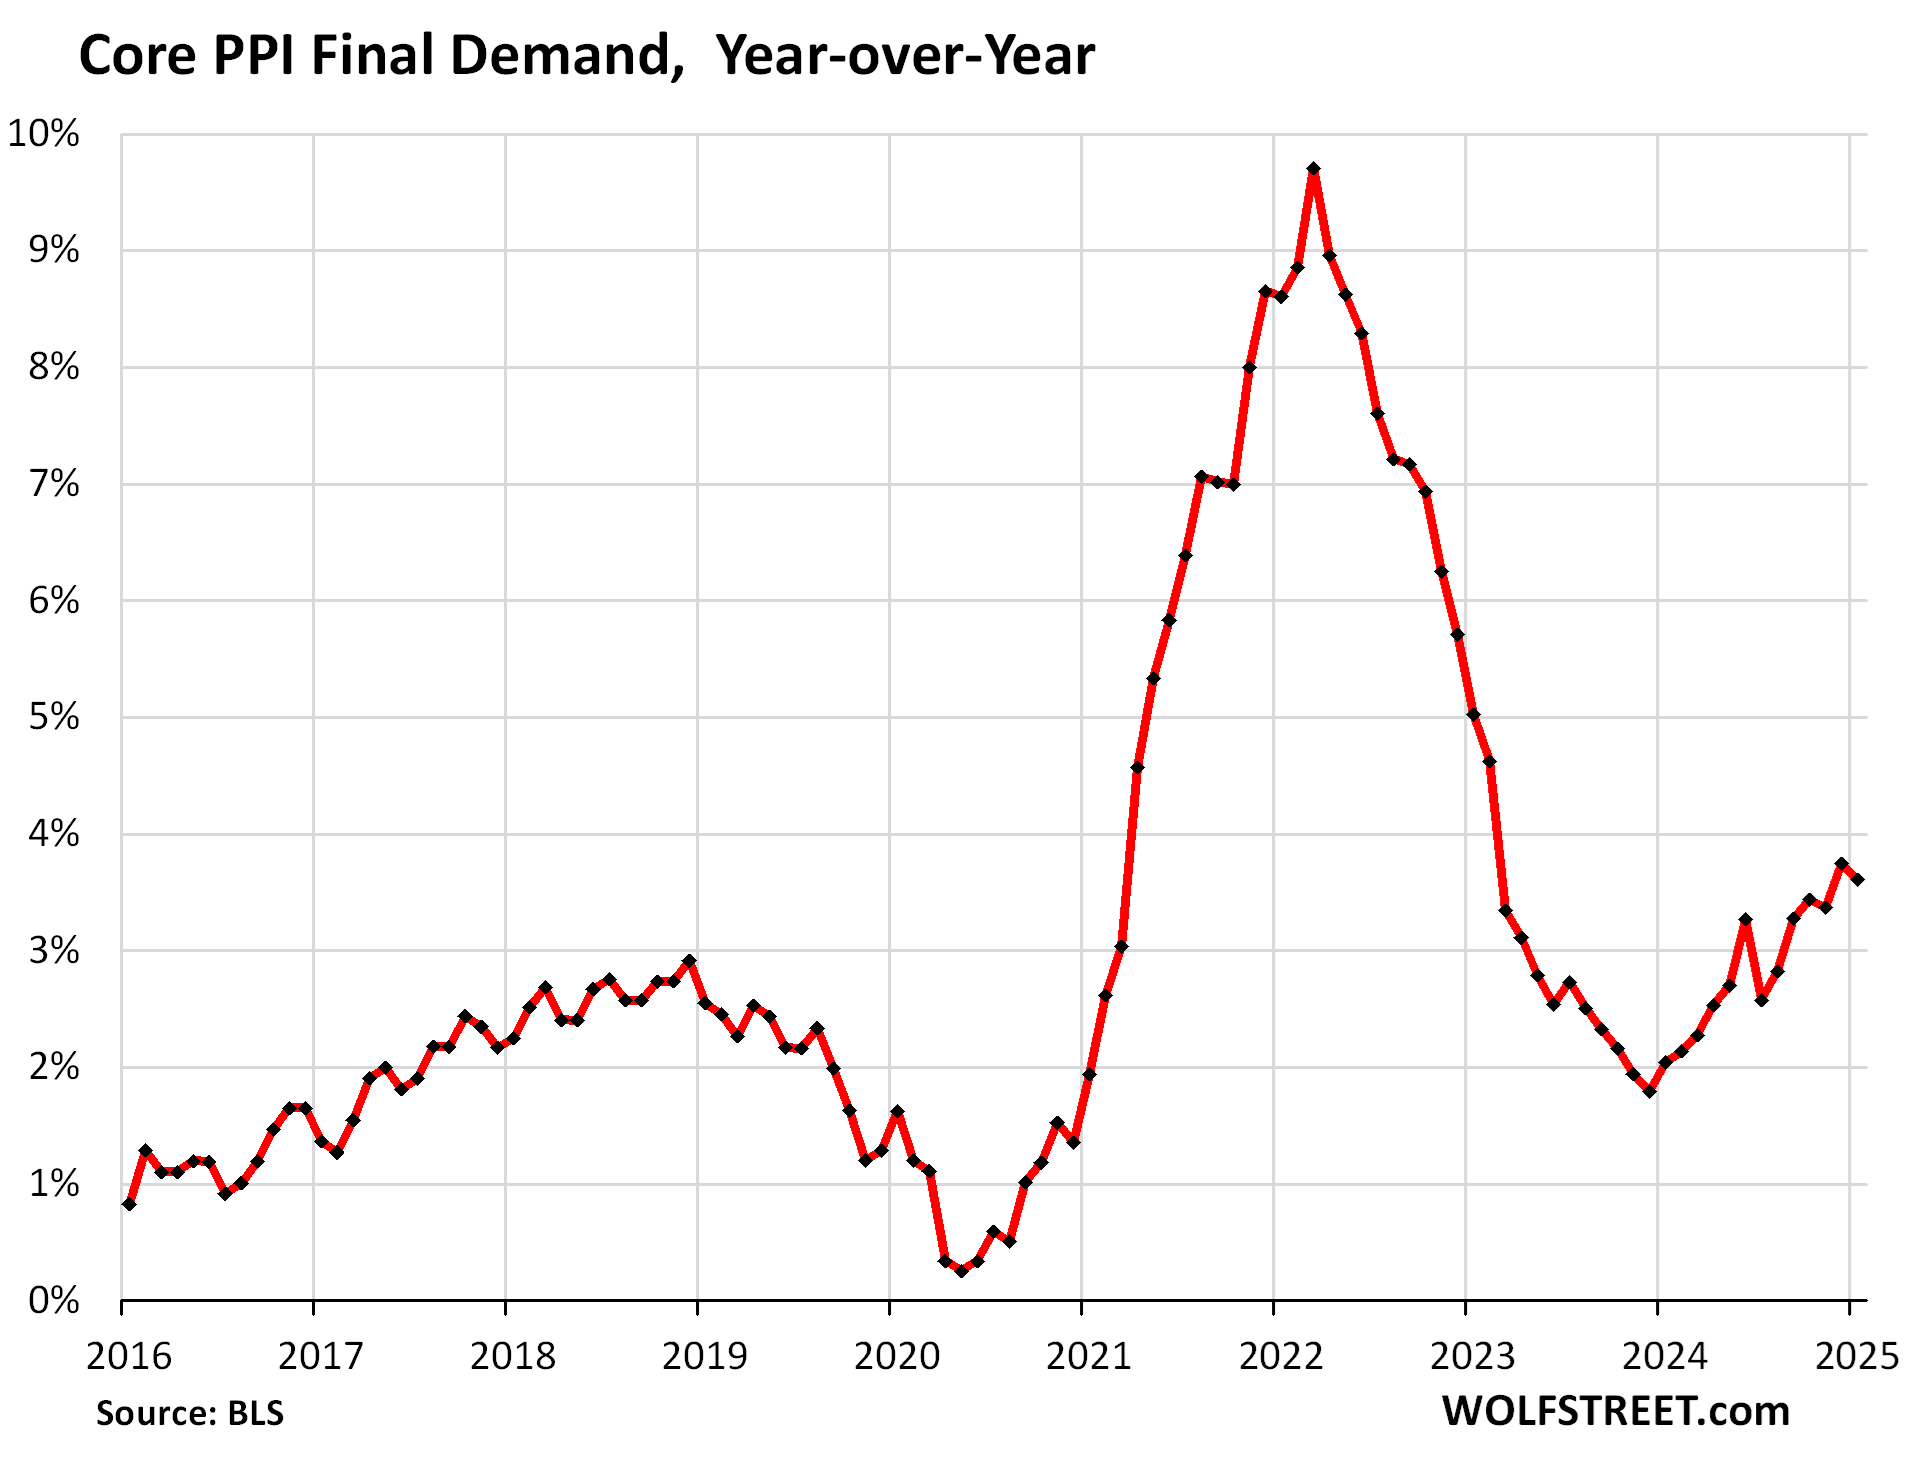
Without food, energy, and eggs: “Core” PPI, which excludes food and energy, was revised up massively for December.
The month-to-month increase for December had originally been reported as +0.04% (0.5% annualized). Today it was revised up by 36 basis points to an increase of +0.40% (4.9% annualized). All seasonally adjusted.
On top of the up-revised December rates came January’s increase of 0.28% (3.4% annualized), which accelerated the 6-month PPI to 3.8% annualized, the worst since September.
Year-over-year, core PPI for December was revised up by 20 basis points, from the previously reported +3.55% to today’s December figure of +3.75%.
Year-over-year data are not seasonally adjusted since they cover 12 months and wash out any seasonal effects. Not seasonally adjusted, the January core PPI jumped by 0.49% (not annualized). But the January 2023 increase of +0.63% fell out of the 12-month window. So year-over-year in January 2025, the index rose by 3.61%, a notch slower than the upwardly revised increase of 3.75% in December (originally reported at 3.55%).
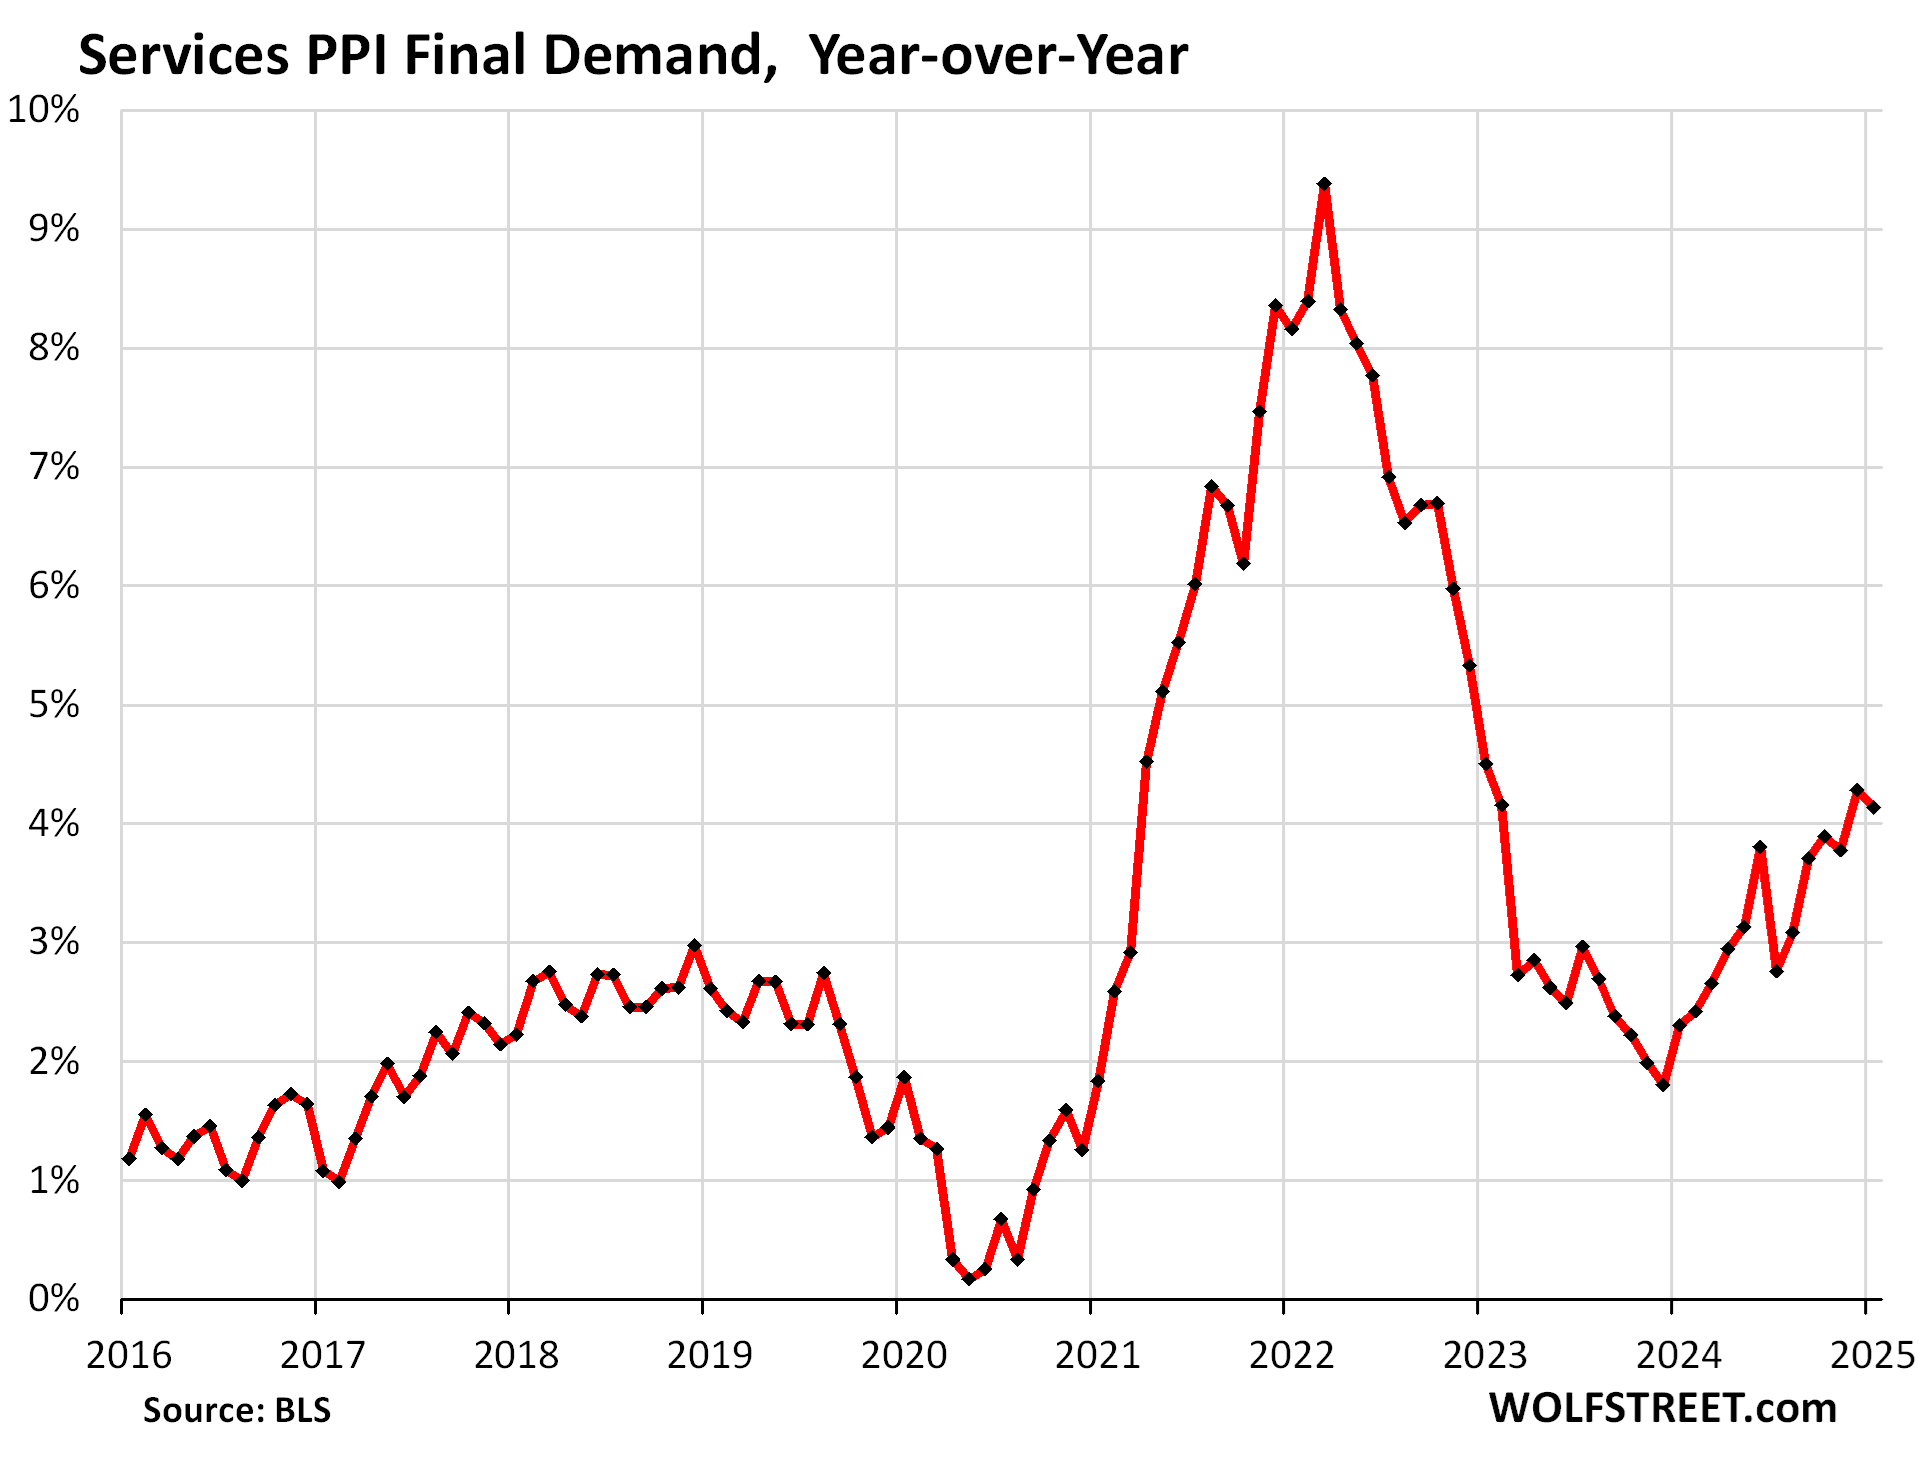
The services PPI, which accounts for two-thirds of the overall PPI but excludes energy services, had the whopper 47-basis-point up-revision for December, from the originally reported month-to-month increase of 0.04% (not annualized), so from nearly no change, to +0.51% as revised today.
On top of this upwardly revised 0.51% surge in December (+6.2% annualized), the services PPI rose another 0.32% in January (3.9% annualized).
This pushed the six-month services PPI to +4.5% annualized, the worst since September.
The year-over-year December increase was revised up by 25 basis points, to +4.28%, from the previously reported +4.03%.
With the January 2023 reading of +0.71% (not seasonally adjusted) dropping out of the 12-month window, and the January 2025 reading of +0.54% (not seasonally adjusted) moving into the 12-month window, the year-over-year increase in January cooled a hair to +4.14% from December’s up-revised 4.28% (originally reported as 4.03%).
These up-revisions have the effect that the entire zigzag line keeps shifting higher:
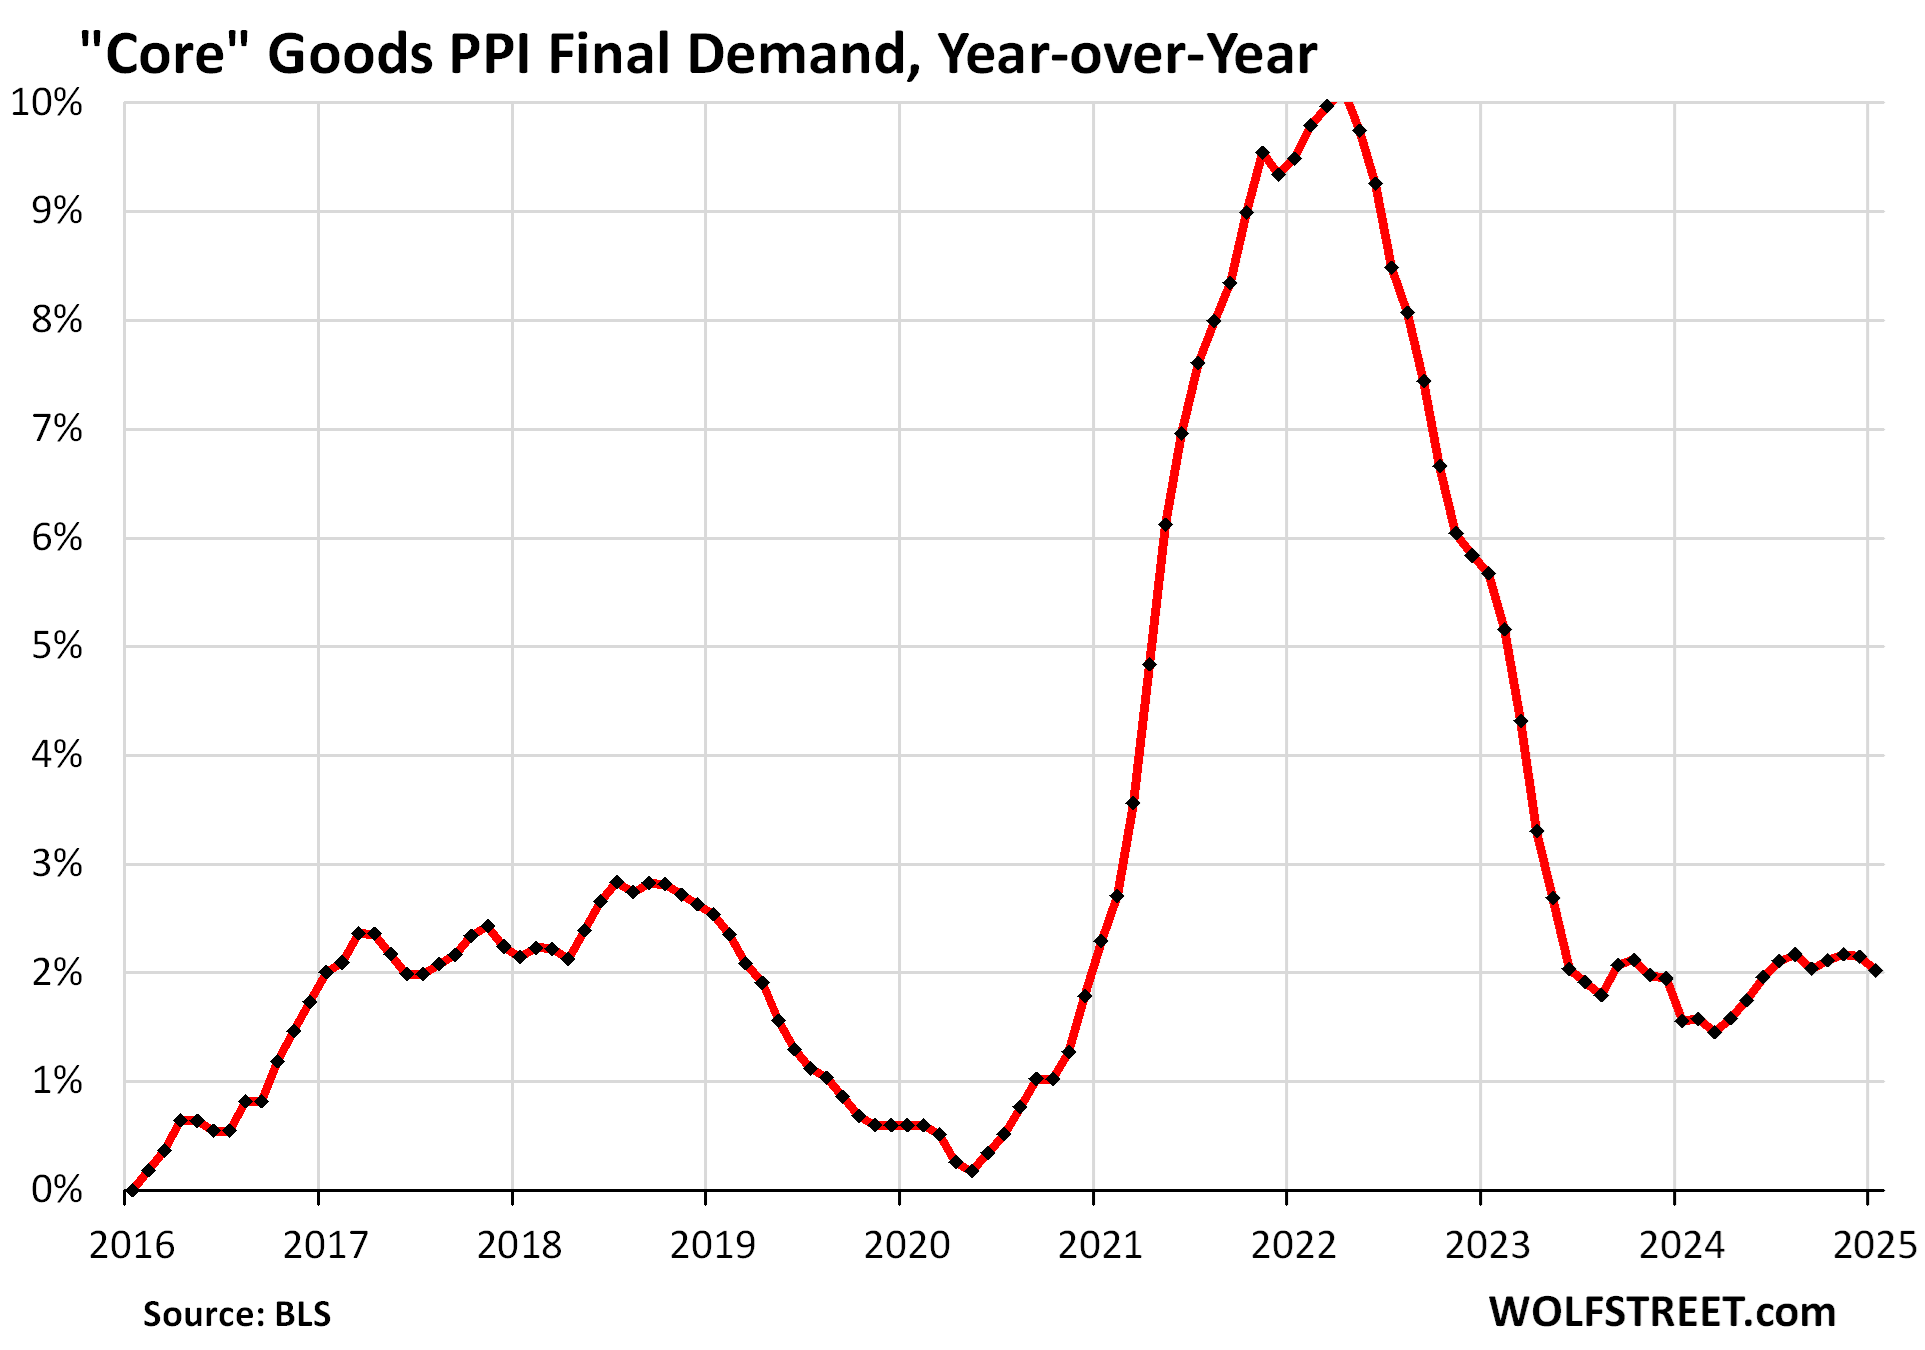
The “core goods” PPI was only minimally revised up. In January, it rose by 0.13% (+.5% annualized) from December.
Year-over-year, it rose by 2.0%, in the same 2%-plus range of increases for the seventh month in a row. The goods sector is not where inflation is a big issue at the moment. The issue with inflation is in services.
The PPI for “core goods” covers goods that companies buy but excludes food and energy products.
With these underlying trends, as shown by the PPI, it’s no surprise that consumer price inflation, as tracked by CPI, continues to accelerate, and that there too, inflation is festering in services, and in January it was non-housing services where inflation accelerated sharply.
Enjoy reading WOLF STREET and want to support it? You can donate. I appreciate it immensely. Click on the beer and iced-tea mug to find out how:

Would you like to be notified via email when WOLF STREET publishes a new article? Sign up here.
![]()
The post PPI Inflation Accelerates to +3.5% yoy, Worst in 2 Years, Driven by Services amid Massive Up-Revision of Services Inflation appeared first on Energy News Beat.