Energy News Beat
December, prior months revised higher. Goods prices jump month-to-month by most since August 2023, turn positive for first time in a year.
By Wolf Richter for WOLF STREET.
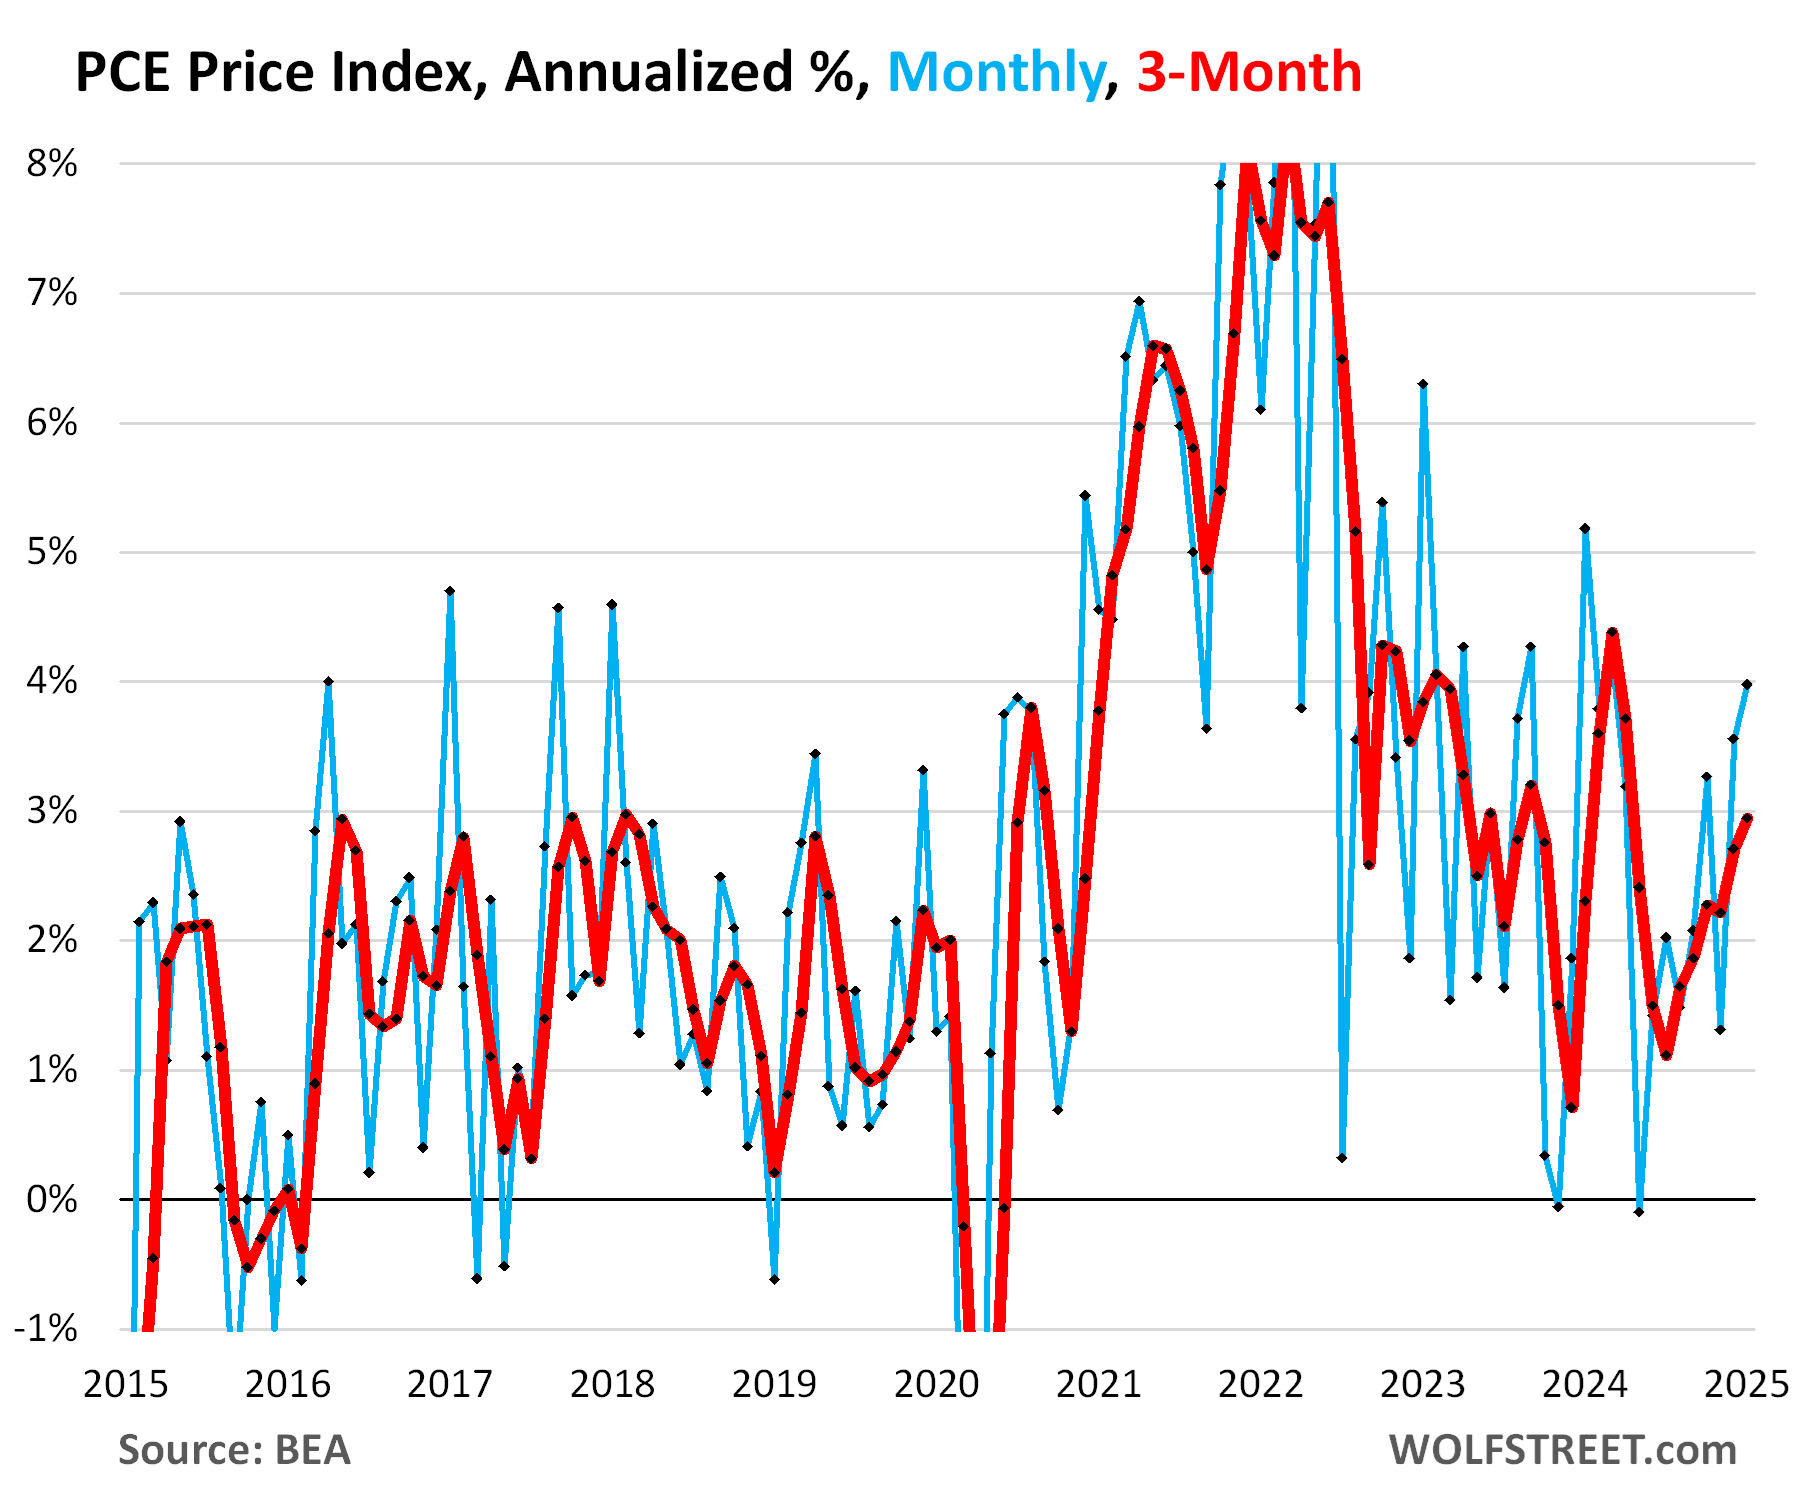
The inflation measure released today – the PCE price index favored by the Fed as yardstick for its inflation target – jumped by 0.33% in January from December, or by 4.0% annualized, the worst month-to-month increase since March 2024. And this was on top of the upwardly revised December increase.
So, the 3-month PCE price index accelerated to +2.94% annualized, the worst increase since April 2024. The low point of the three-month index was in July (+1.6% annualized), and it has been accelerating ever since. The chart shows the month-to-month changes (blue) and the three-month changes (red), all annualized.
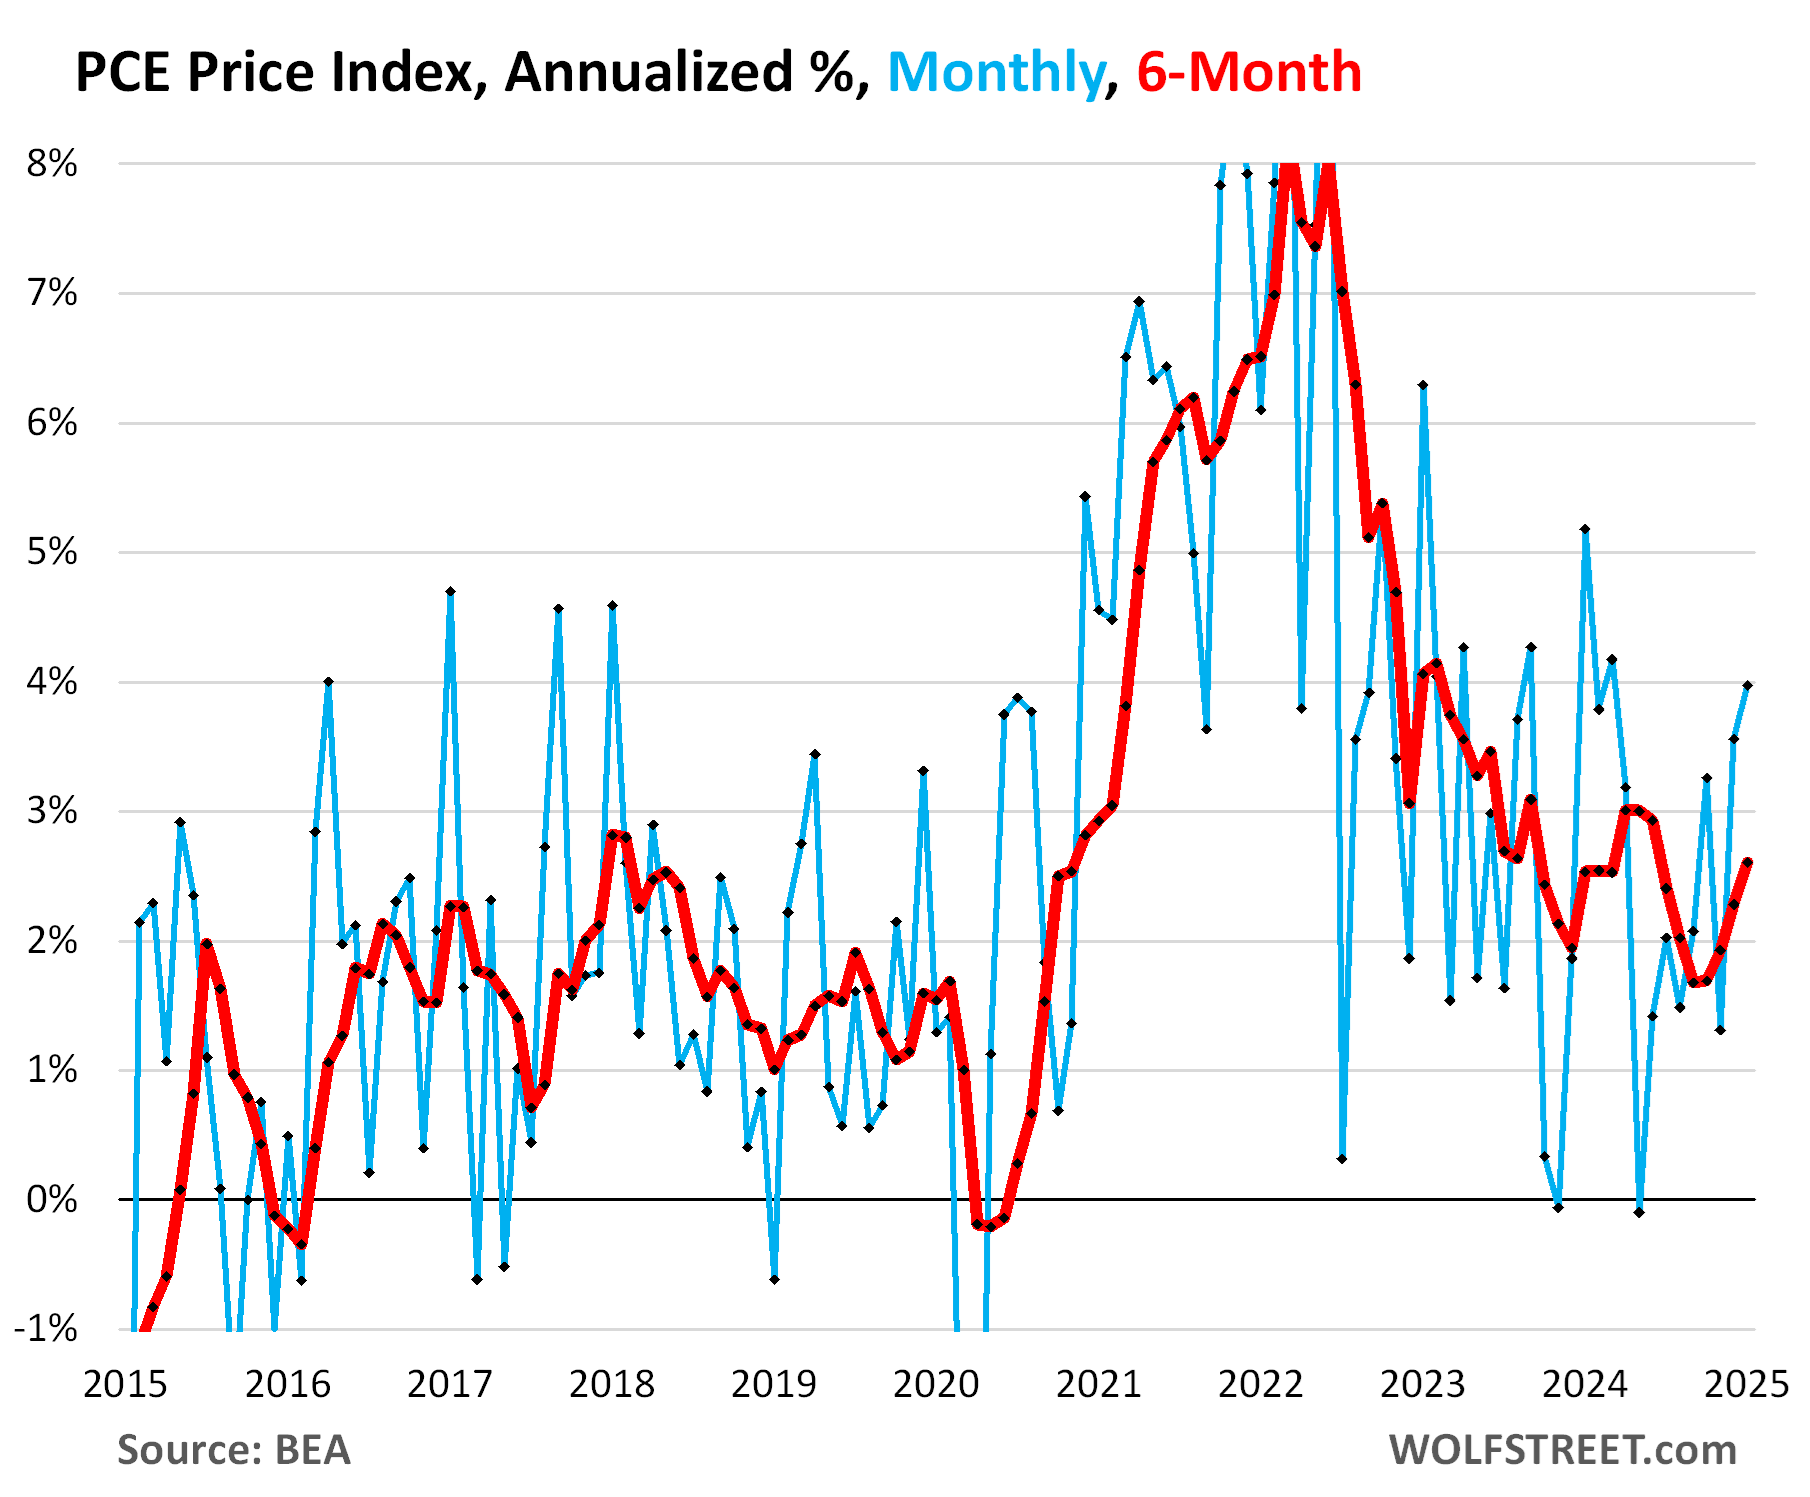
The 6-month PCE price index accelerated to +2.6% annualized, the worst increase since June 2024.
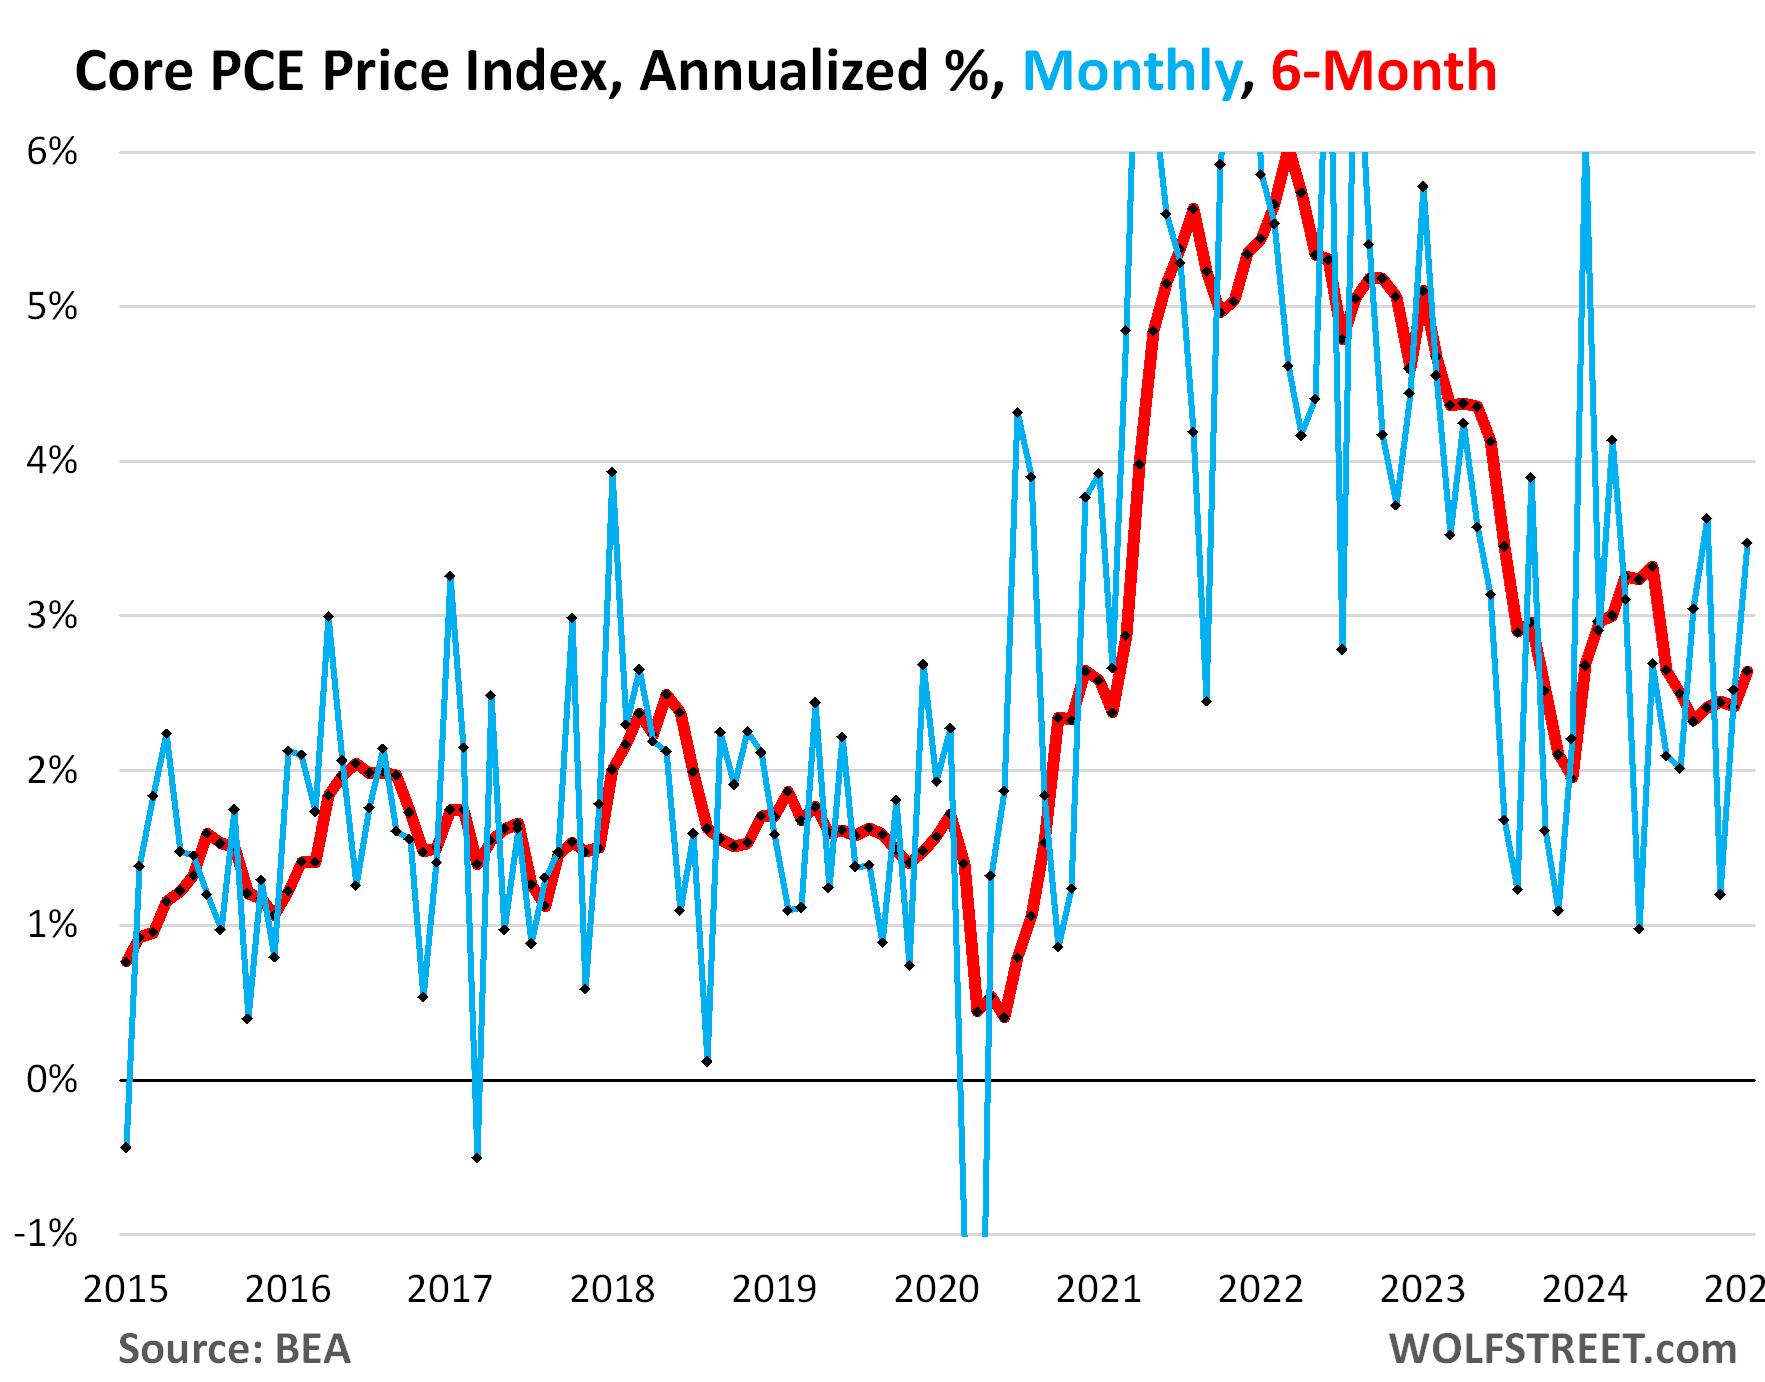
The core PCE price index, which excludes food and energy items, accelerated to +0.28% in January from December, or 3.5% annualized, the worst increase since October, and before then since March 2024.
The 6-month core PCE price index accelerated to +2.6%, the biggest increase since July 2024.
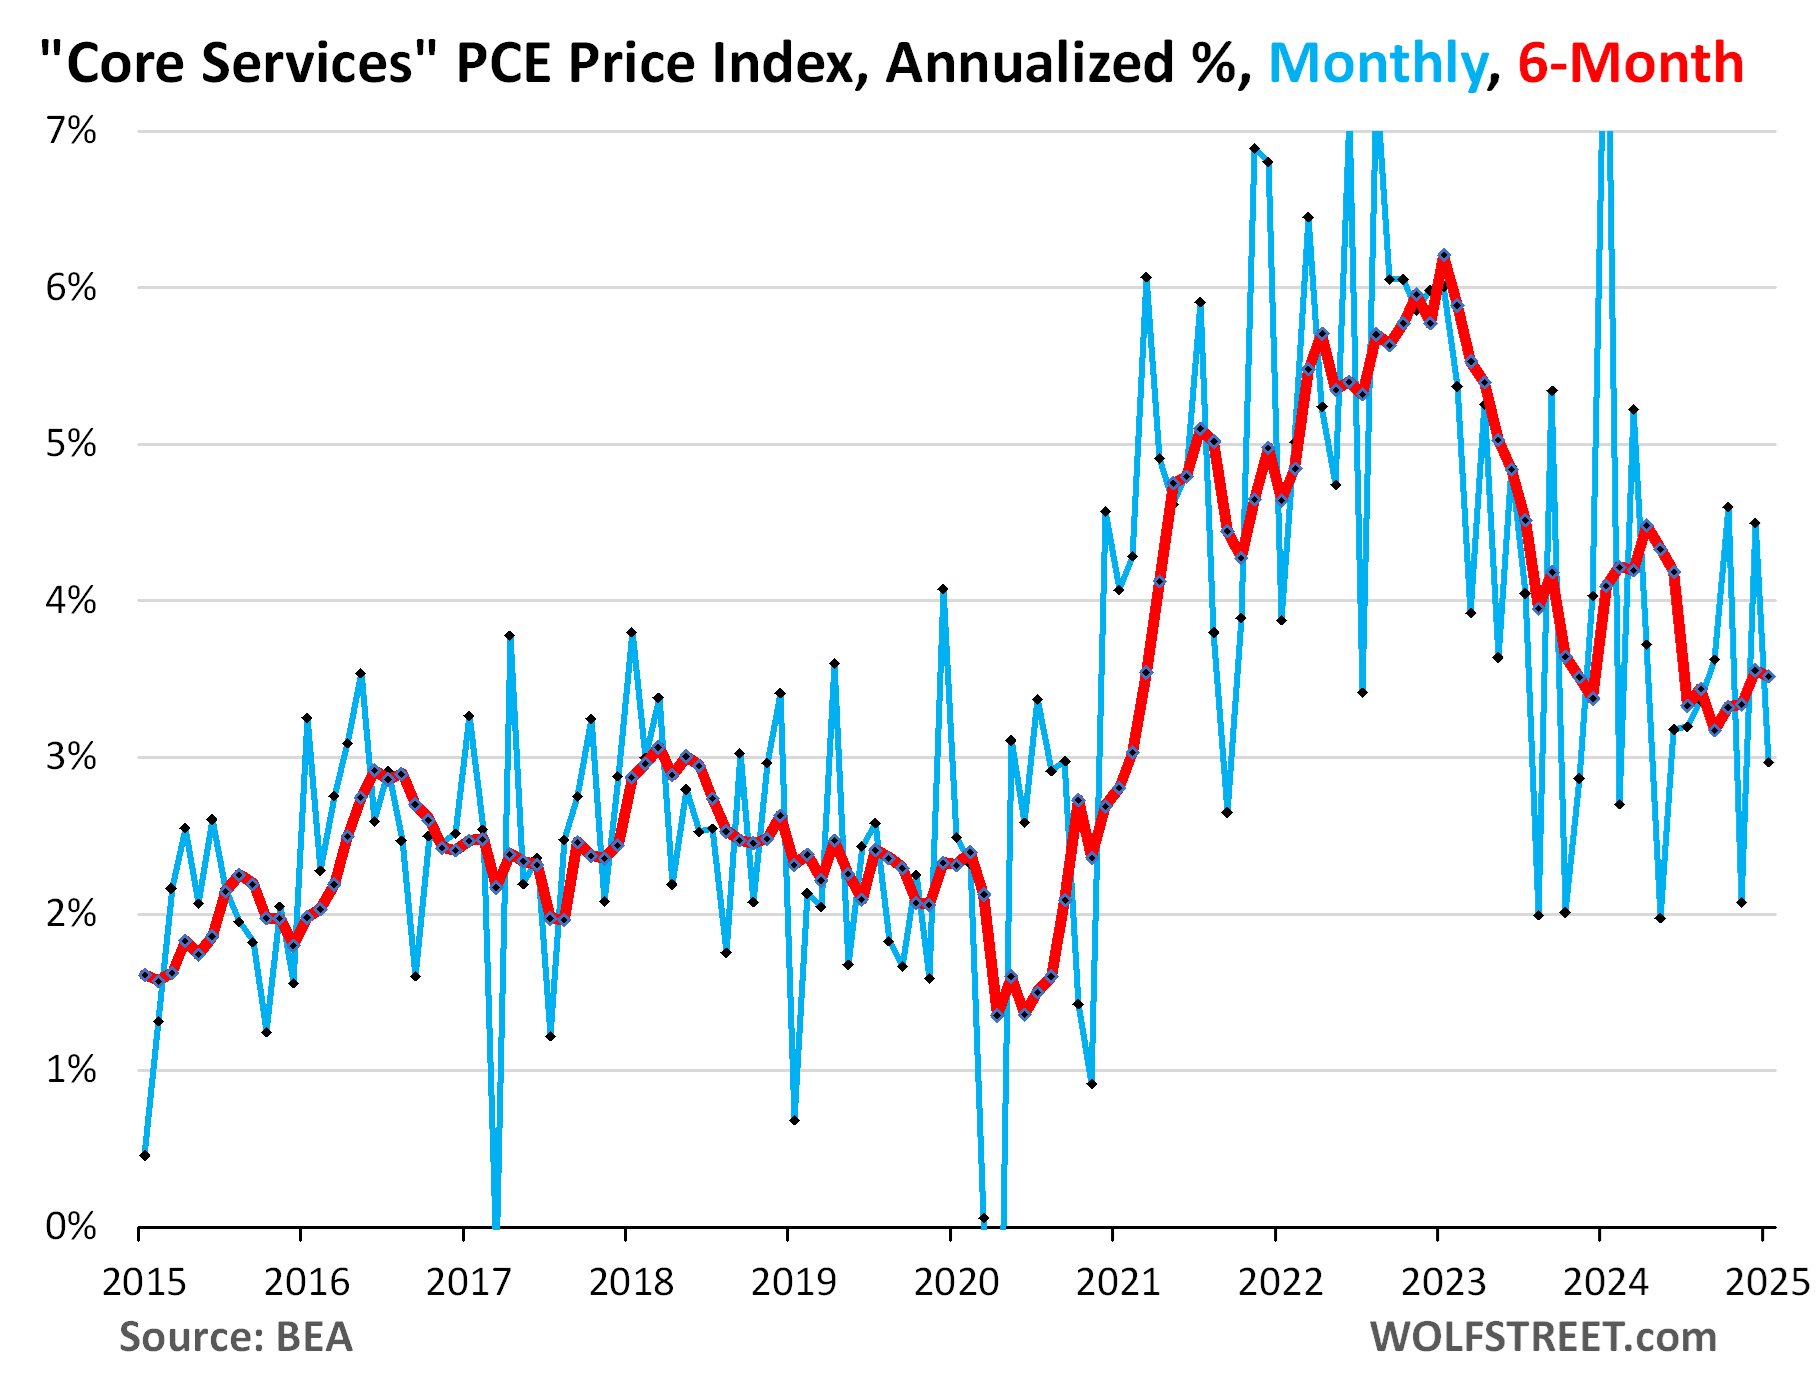
The core services PCE Price Index, which excludes energy services, decelerated in January, pushed down by three sub-indices that had month-to-month declines (negative readings).
On a month-to-month basis, this is very volatile data, except for the housing index. And these individual month-to-month changes tend to spike and plunge. So these are the changes in January from December, annualized:
Three subindices of services had negative readings:
- Healthcare services (-1.5% annualized)
- Transportation services (-4.9% annualized)
- Insurance (-5.1% annualized)
Four subindices of services accelerated:
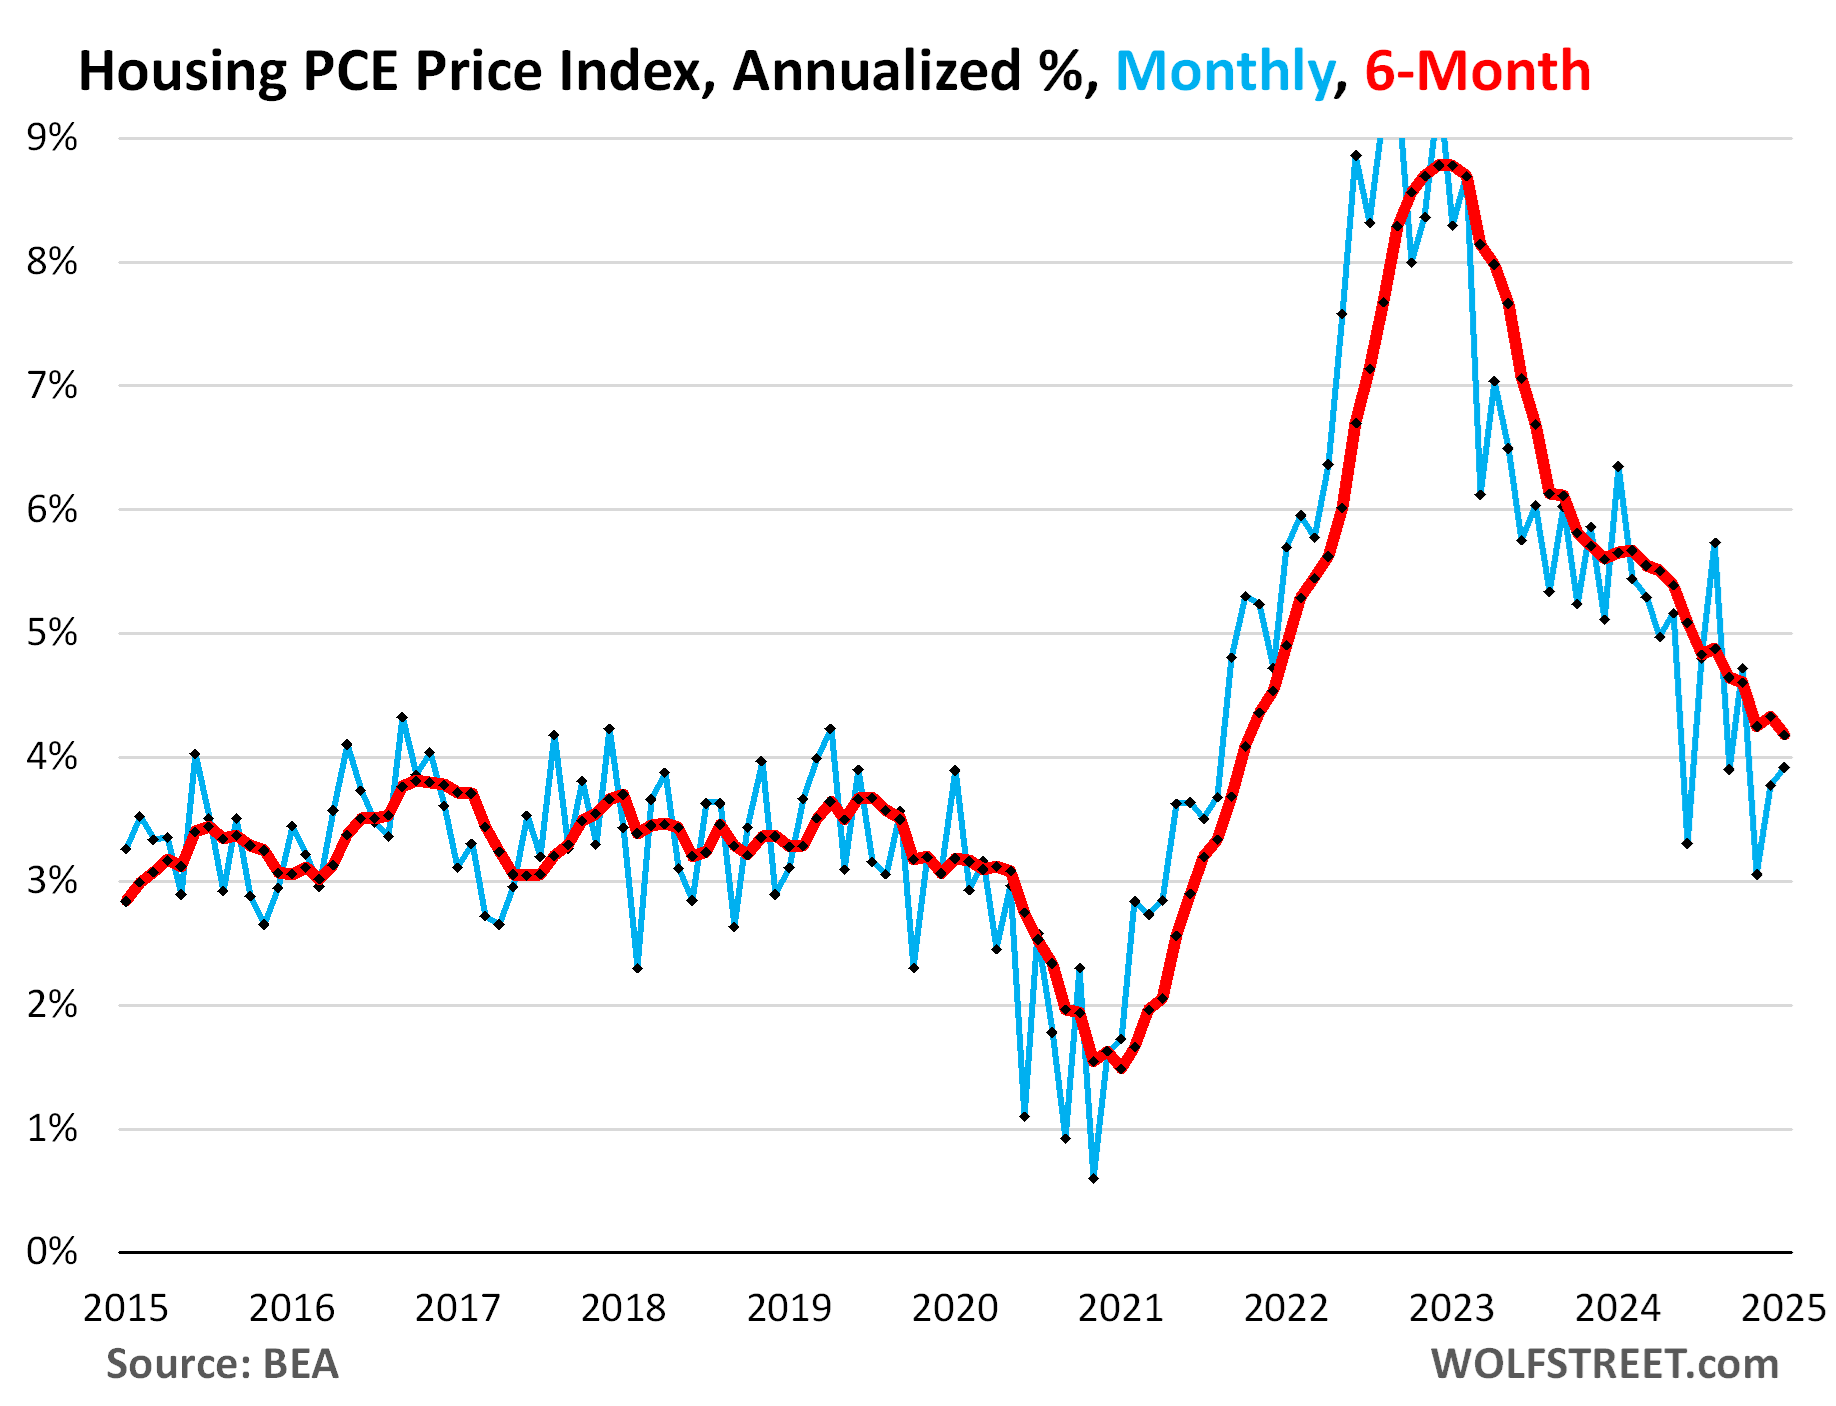
- Housing index (+3.9% annualized).
- Food services index (+4.8% annualized)
- Non-energy utilities (+8.0% annualized)
- Recreation services (+14.6%)
Two subindices decelerated:
- Financial Services (+7.3% annualized).
- Other services (+1.9% annualized)
The PCE price index for housing, which is part of core services, rose by 3.9% in January from December, the second month of acceleration. The six-month index decelerated to 4.2%
The base effect, as always, but this time it was big.
The year-over-year change in January was the sum of the 12 month-to-month changes of February 2024 through January 2025. The December year-over-year increase was the sum of changes from January 2024 through December 2024.
In January 2024, the services PCE price index had spiked month-to-month by 0.68% (the off-the-chart 8.5% annualized). This high reading of 0.68% fell out of the 12-month time frame of the year-over-year change in January 2025, and was replaced by the January 2025 reading of 0.24%. And this caused the year-over-year change to decelerate to 3.4%.
This is the infamous “base effect.” It happens with all year-over-year measures every month. And it’s usually not big. But this time in services, it was big and deserves this special mention (yellow in the chart below).
Because the services index weighs so heavily, it caused the year-over-year readings of the core PCE price index (blue) and of the overall PCE price index (red) to decelerate as well. Details below the chart:
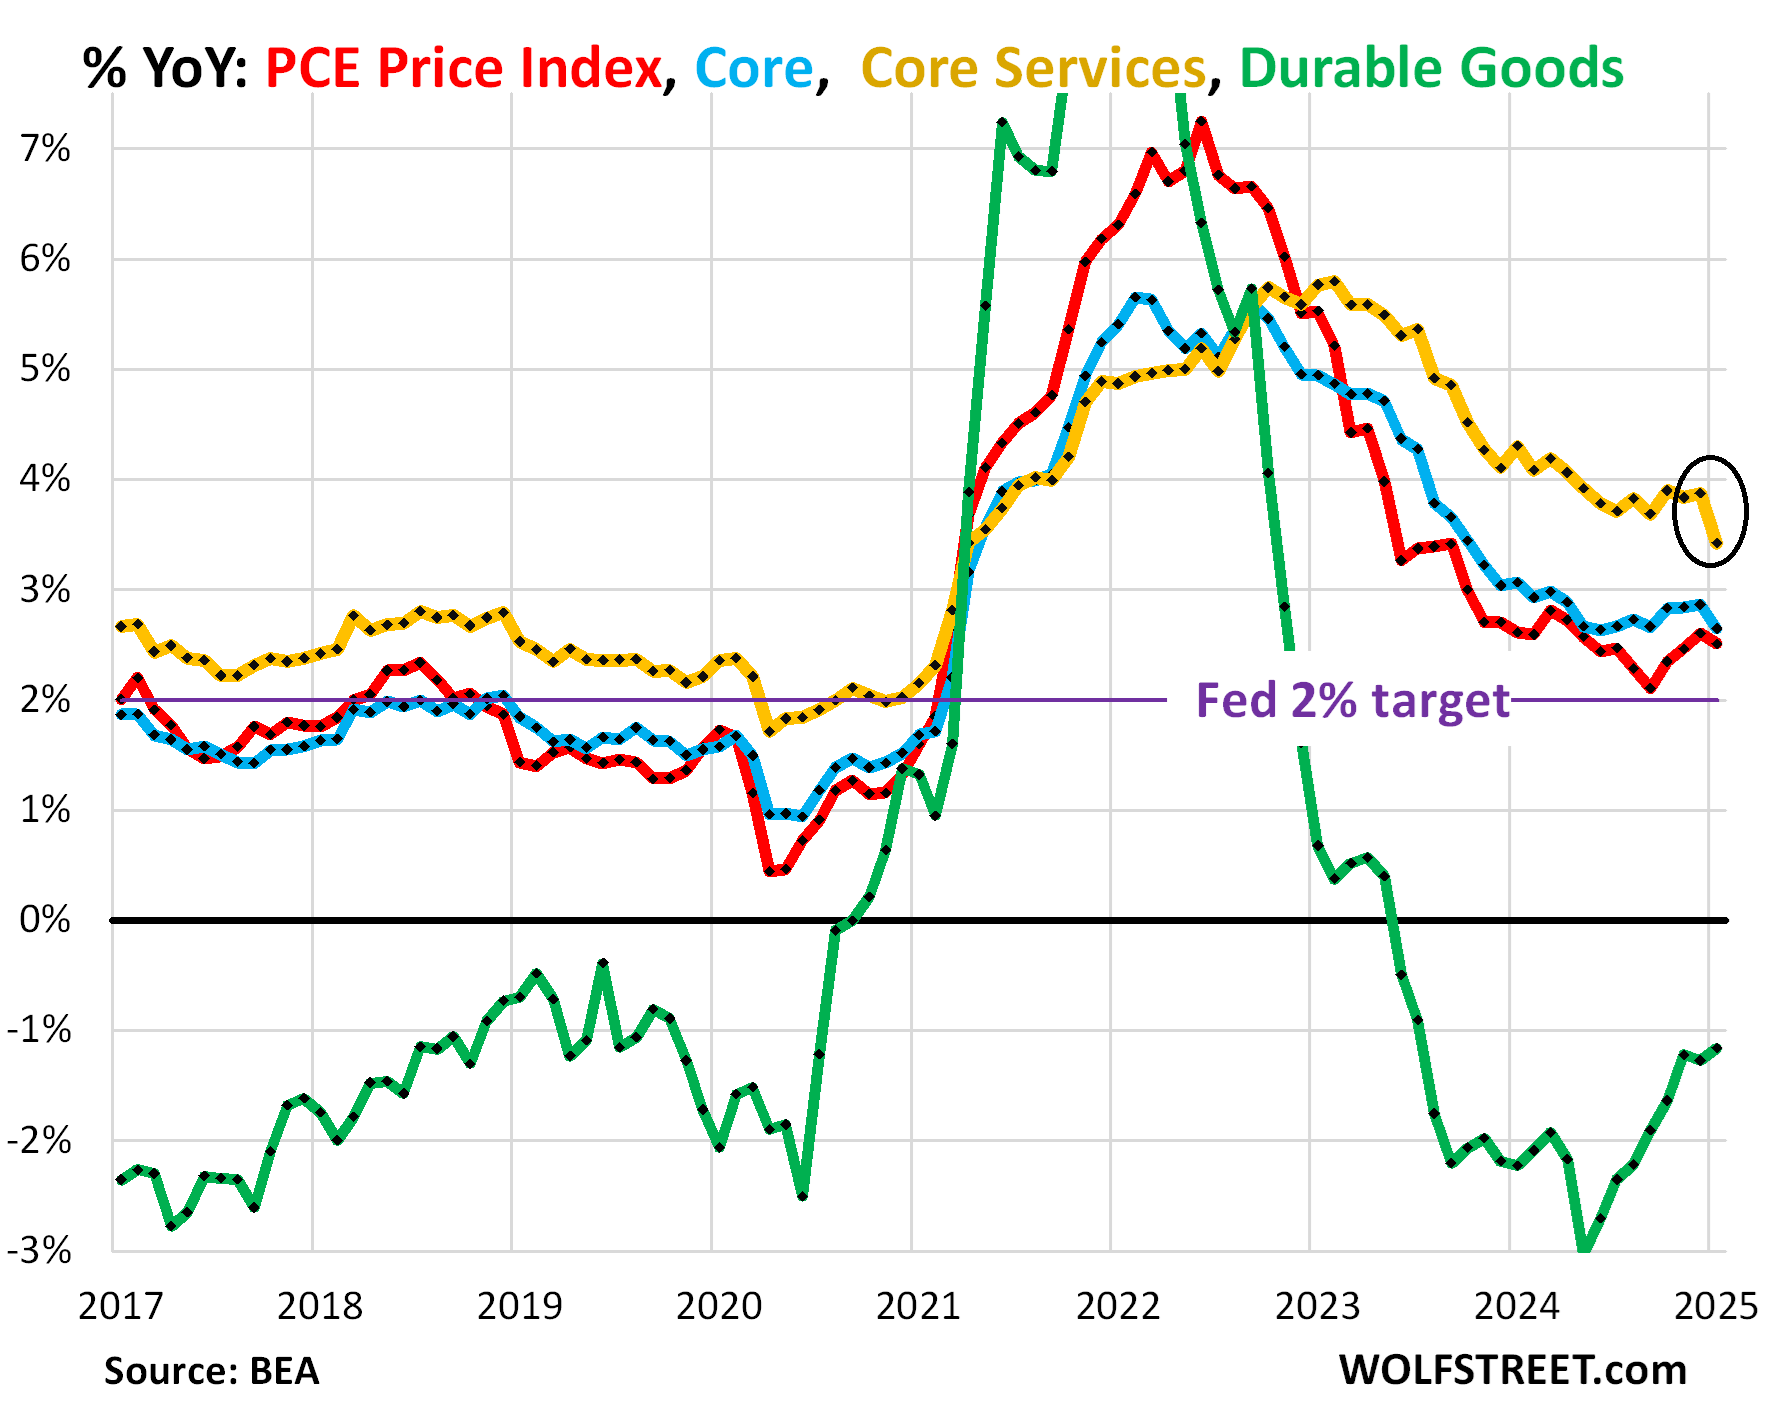
The PCE price index decelerated a tad to 2.51% in January, from 2.60% in December, after three months of acceleration. The Fed’s target for this measure is 2%.
The “core” PCE price index decelerated to 2.65% in January from 2.86% in December, which was rounded to 2.6% in January from the upwardly revised 2.9% in December (originally reported as 2.8%).
The “core services” PCE price index decelerated to 3.42% (see the base effect above), from the upwardly revised 3.87% in December.
The durable goods PCE price index became less negative, declining by 1.16% year-over-year in January, the smallest decline since July 2023.
The durable goods category is dominated by new and used vehicles, and includes appliances, furniture, computers, cellphones, other consumer electronics, sporting goods, such as bicycles, etc.
The all-goods price index.
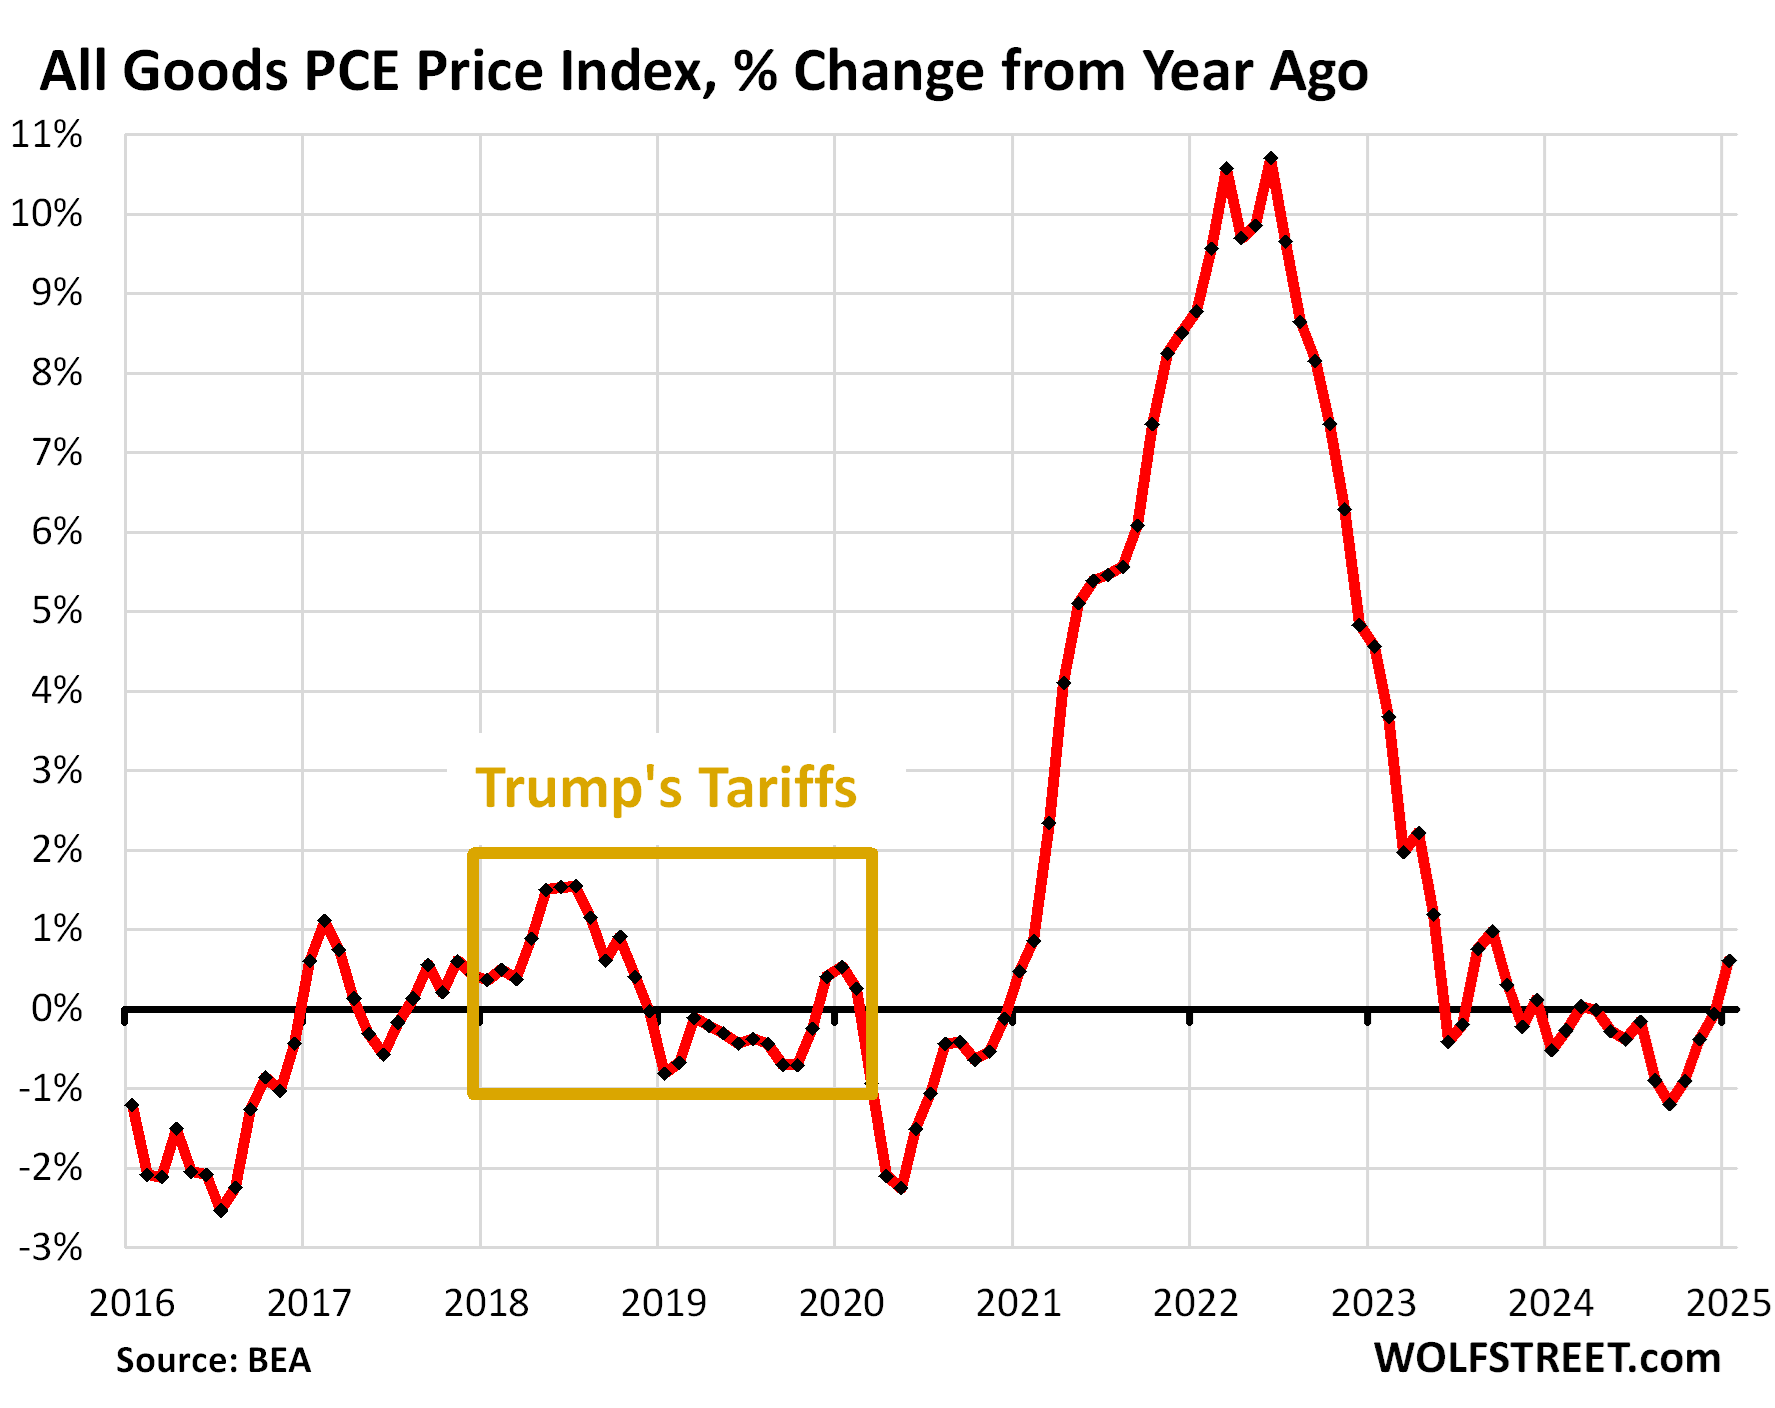
The PCE Price index for all goods, including durable goods, apparel and shoes, food, energy products, household supplies, etc. jumped by 0.5% in January from December (6.2% annualized), the biggest month-to-month increase since August 2023.
Year-over-year, the goods index accelerated from negative readings to +0.6% in January, thereby becoming positive for the first time in a year. It was the biggest year-over-year increase since September 2023.
Year-over-year changes of major goods categories:
- Durable goods: -1.2%
- Food: +1.6%
- Energy products (dominated by gasoline): +0.4%
- Apparel & footwear: +1.1%
The gold box marked the period of Trump’s first round of tariffs. As we can see, companies overall were largely not able to pass them on to consumers, though they tried – creating wild and wooly headlines in the media – but consumers refused to buy those products with higher prices, and companies ended up rolling them back [we discussed this here: What Trump’s Tariffs Did Last Time (2018-2019): No Impact on Inflation, Doubled Receipts from Customs Duties, and Hit Stocks].
Note that the tariffs Trump is now talking about, and even those that were announced in January, have not hit the goods that consumers bought in January. Those goods, if imported, came into the US before January, before any new tariffs were implemented.
Enjoy reading WOLF STREET and want to support it? You can donate. I appreciate it immensely. Click on the mug to find out how:

![]()
The post PCE Inflation Hits 4.0% Month-to-Month Annualized, Worst since March. 3-Month PCE Hits 2.9%, Worst since April. But Massive “Base Effect” in Services Cools YoY Increases appeared first on Energy News Beat.