
Energy News Beat
ENB Pub Note: Excellent Article from RBN Energy – I recommend following them and checking out their articles: In Texas and Louisian Gulf Coast, we need the six new pipelines for LNG and Natural Gas takeaway. Without the pipelines, it would be tough to maintain the demand for gas flow for AI, data centers, and new LNG export trains. We will be covering this on tomorrow’s podcast, and it’s crucial impact on the Texas ERCOT Grid.
Over the next couple of years, six new pipelines and expansion projects will bring 11.8 Bcf/d of incremental natural gas supplies to the Texas/Louisiana Gulf Coast. During the same period, more than 8 Bcf/d of new LNG export capacity will move that gas to international markets. The impact of this onslaught of gas flows will be anything but orderly. Inflows will never equal outflows. Pipes will arrive early with supplies, with LNG terminals coming along later. Gas flows will shift from west to east, and north to south, in chaotic patterns that will upend historical price relationships. Is there any way to make sense of all this? There sure is, as we discuss in today’s RBN blog. All you need is the right arrow pointing the way.
Fast-rising gas production in the Permian, growth potential in the Haynesville and Eagle Ford, and the rapid buildout of new gas pipelines and LNG export capacity make this a particularly exciting — and challenging — time for gas market players in Texas and Louisiana. One thing is clear: With so much going on, it’s never been more important to have a solid understanding of how the market will evolve, month by month and year by year, as all this new infrastructure comes online. Why? Because the new pipeline capacity and liquefaction trains will have continually changing impacts not only on gas flows throughout the two-state region but on gas basis at every hub.
With all that in mind, RBN has developed — and now made available for our subscription customers — the Arrow Model, which (1) aggregates gas production, demand and net outflows or inflows for each market hub over time; (2) quantifies the degree to which gas is pushed/pulled between and among hubs, again over time; (3) anticipates gas flows on each corridor (and the need for incremental pipeline capacity); and (4) forecasts the basis differentials that underlie and support the aforementioned flows of gas.
We’ll get to the details in a moment, but first a quick summary of where things stand today — and how much things will change over the next two years or so. Permian gas production exceeds 21 Bcf/d, Haynesville and Eagle Ford E&Ps are poised to increase their output, and new pipelines (and pipeline expansions) from production areas to the Gulf Coast (and along the coast) are in the works, including the 2.5-Bcf/d Blackcomb Pipeline (dashed red-and-black line in Figure 1 below) from Waha to Agua Dulce, the 1.5-Bcf/d Hugh Brinson Pipeline (dashed blue-and-black line) from Waha to the Dallas/Fort Worth area, and the 1.5-Bcf/d Trident Pipeline (dashed orange-and-black line) from the Katy, TX, hub to Sabine Pass. And that’s just the supply side of the equation. After a pause in LNG capacity additions last year, Plaquemines LNG is increasing its output and several new LNG export projects are slated to come online, starting with Corpus Christi LNG Stage III (the first element of which is already sending out LNG) and followed in short order by Golden Pass LNG (Sabine Pass), Rio Grande LNG (Brownsville, TX) and Port Arthur LNG (see dash-bordered diamonds). These projects will add 6.9 Bcf/d of gas demand by mid-2027 and another 4.1 Bcf/d by 2030, dramatically altering regional gas flows as they do.

Figure 1. Selected Gas Pipelines and LNG Terminals in Texas and Louisiana. Source: RBN
This ratcheting up of gas pipeline capacity and LNG terminal demand will be lumpy and bumpy — and at least a tad unpredictable. As a result, gas flows across Texas and Louisiana will be in a near-constant state of flux, with flows up and down the Gulf Coast — and across the state line at the Sabine River — the most changeable of all. And, as gas-market veterans know very well, highly dynamic flow patterns can wreak havoc with traditional price/basis relationships.
Which brings us back to RBN’s Arrow Model, depicted in Figure 2 below. We carved the Texas/Louisiana region into pipeline “corridors” that can be used to assess changes in the region’s inflows, outflows and flows within each state via groups of pipes that serve similar markets from comparable supply sources. These pipeline corridors (green arrows) are aggregations of dozens of pipelines connecting 16 market hubs (black dots), some of which are within the two states and others that are outside the region. There also are six more corridors that track volumes from LNG terminals, through which gas exits Texas and Louisiana in liquefied form on LNG carriers (dark-blue and light-blue arrows, respectively). The red arrows show gas exports to Mexico.
The attributes of each arrow include capacities, historical flows, projected flows, constraints and other factors. The net flows for each arrow move in the direction indicated by the arrow, but — as you’ll see — they can (and do) flip around over time when modeled market conditions dictate.
RBN’s Arrow Model for Texas/Louisiana Gas Flows
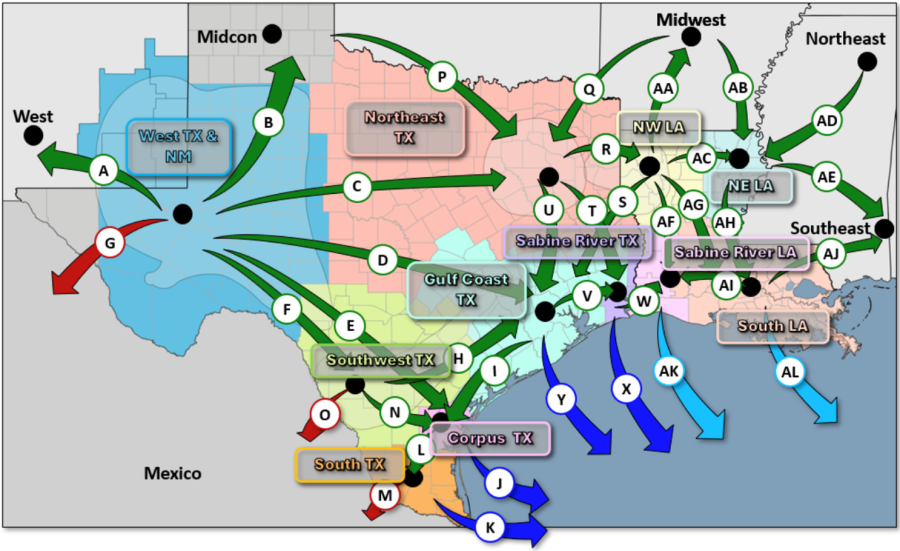
Figure 2. RBN’s Arrow Model for Texas/Louisiana Gas Flows. Source: RBN’s Arrow Model
The Arrow Model gives you access to a host of monthly historical data and forecasts for gas production, pipeline flows, supply, storage, demand, regional balances and basis from January 2022 through December 2026, while similar sets of annual data and forecasts run from 2022 through 2035. (For more on what you get, click here.)
The massive changes just ahead — rising gas production, new takeaway and coastal pipelines, new LNG export capacity chief among them — provide an ideal opportunity to run Arrow through its paces and show you what it’s capable of. Figure 3 below shows a timeline for the new gas pipelines in Texas and Louisiana (orange and purple arrows, respectively) and new LNG export capacity (green arrows for Texas projects and blue arrows for Louisiana) in the 2025-27 period, plus (at the far left of the timeline) the 2.5-Bcf/d Matterhorn Express pipeline from the Waha Hub to the Katy area, which came online in October 2024, and the 2.9-Bcf/d Plaquemines LNG, whose operation has been ramping up for several months.

Figure 3. RBN Arrow Model Timeline. Source: RBN
As you move across the timeline from left to right, the Arrow Model reveals how gas flows along each corridor increase, decrease and even flip from one direction to the other. The model also indicates how prices at key hubs shift to encourage — and discourage — flows to ensure gas moves to where it’s needed.
Before we provide several examples from the model’s set of monthly data, we should take a moment to explain Figure 4 below, which relates to our first example. The blue-shaded area in the map shows the West Texas and New Mexico (West TX & NM) production area; the green arrows (labeled A through F) show the gas pipeline corridors out of the Permian, and the red arrow (labeled G) shows the pipeline corridor to Mexico. The corresponding graphs, labeled to identify the corridor and the destination market (A-West, B-MidCon, C-NE TX, etc.), show the physical capacity of the corridor (solid orange line), effective capacity (factoring in any constraints; dashed red line), with the blue line showing historical flows (from January 2022 through February 2025) and forecast flows (March 2025 through December 2026).
Pipeline Corridor Capacities and Flows Out of Waha

Figure 4. Pipeline Corridor Capacities and Flows Out of Waha. Source: RBN’s Arrow Model
With that in mind, here are a few examples from the model’s set of monthly data:
- In Q4 2024, Matterhorn Express came online, potentially increasing the Arrow D corridor capacity to 6 Bcf/d. Gas flows on the pipeline corridor ramped up (see D-Gulf Coast graph to center-right), relieving pressure on Waha basis, which improved from minus $2.53/MMBtu in October to minus $0.82/MMBtu in December. But the new pipeline is not flowing at full rates, and has received new supplies quickly. By March the basis differential is already in trouble again with most of the last two weeks at negative Waha prices and the basis widening out to more than negative $4.30/MMBtu.
- With more Permian gas coming into the Gulf Coast, the market needed to balance and that happened by gas being pushed back into the Corpus region (Arrow I in Figure 2) and more gas moving from the Gulf Coast region to Beaumont/Port Arthur and the Sabine River area on both sides of the Texas/Louisiana state line (Arrows V and W in Figure 2). These flows added downward pressure on Houston Ship Channel (HSC) and Agua Dulce basis, but not enough to be able to differentiate the oversupply impact from the usual seasonal trading patterns of these hubs.
- In Q1 2025, production commenced at the first of seven liquefaction trains at Corpus Christi LNG Stage III (Arrow J in Figure 2; capacity 0.2 Bcf/d per train), with trains 2 and 3 to follow later this year and trains 4 through 7 starting up through 2026. The model has flows on Arrow J increasing from 2.5 Bcf/d in January 2025 (virtually all of it from the original trains at Corpus Christi LNG) to an even 4 Bcf/d in December 2026, with most of the incremental flows for those exports coming from the Southwest TX area (Eagle Ford; Arrow N in Figure 2) until June 2026. That’s when the capacity on Gulf Coast Express expands by 0.5 Bcf/d on Arrow E from the West TX area to Corpus. Then, in Q4 2026, the 2.5-Bcf/d Blackcomb Pipeline (also part of Arrow E) comes online, providing Corpus with more gas than it can handle.
Unfortunately, the other area where we’ve seen big Texas/Louisiana production growth a few years back is not looking as good. We are showing the Louisiana side of Haynesville production declining by 580 MMcf/d through 2025, and the Texas side up, but only by about 350 MMcf/d. The better news is that the combined Haynesville region is expected to grow more the following year — by about 1.4 Bcf/d during 2026.
During 2025, Louisiana flows should follow basic seasonal patterns, pulling more gas from outside the region during periods of strong demand. The most significant flow shift is gas moving from Plaquemines LNG (Arrow AL in Figure 2), which started exports in December 2024 and is projected to ramp to full capacity of 2.9 Bcf/d in late 2025. Gas for Plaquemines LNG comes in on Gator Express, which receives most of its incremental supply from Northeast Louisiana on Arrow AH, which in turn receives most of that gas from supplies on Arrow AB (Midwest) from the Tennessee Gas, Texas Eastern and Transco pipelines.
The only other major infrastructure event that happens in Louisiana in 2025 is at the end of the year when the 1.8-Bcf/d Louisiana Energy Gateway (LEG; dashed magenta-and-black line in Figure 1) pipeline on Arrow AF begins flows. The pipe moves gas from the Haynesville area to Gillis, LA, where it joins with many other systems, including Transco, which can get gas over to the Texas side of the Sabine River on Arrow V, where the first 0.8 Bcf/d of Golden Pass LNG’s capacity (Arrow X) comes online in January 2026. (The other 1.6 Bcf/d of Golden Pass’s capacity follows in mid-2026 and early 2027.)
The startup of Golden Pass LNG also syncs up with the latest in-service date for Momentum Midstream’s New Generation Gas Gathering Pipeline (NG3; dashed green-and-black line in Figure 1; also Arrow AF), which will transport 2.2 Bcf/d, also from the Haynesville to Gillis. As flows on NG3 and LEG increase on Arrow AF the Louisiana Gulf Coast will need less inflows from other regions. The most pronounced reduction is from South Louisiana, which conveniently has less gas that needs to move toward Gillis on Arrow AI because it is feeding more gas to Plaquemines LNG on Arrow AL.
Which gets us back to the Texas side of the Arrow Model. As noted above, in Q4 2026, Blackcomb starts up with 2.5 Bcf/d down to Agua Dulce on Arrow E, with much of that gas headed to Corpus Christi LNG (Arrow J) and Mexico exports (Arrow M). Later, some of that incremental gas will flow south on the 2.25-Bcf/d first phase of the Rio Bravo Pipeline (dashed yellow-and-black line in Figure 1) from Agua Dulce to South Texas (Arrow L), which is designed to feed gas to the 2.3-Bcf/d Rio Grande LNG facility starting in mid-2027 (Arrow K; initial volume 0.8 Bcf/d).
Finally, there is one more major pipeline coming on at the end of 2026. That is when Energy Transfer’s 1.5-Bcf/d Hugh Brinson Pipeline from the Permian to the Dallas/Fort Worth area starts up (Arrow C), providing additional relief to Waha — something the hub will need badly by then. In 2027 and beyond, still more gas-related infrastructure will be on tap, including the Port Arthur Pipeline Louisiana Connector (Arrow W), the Port Arthur LNG terminal itself (Arrow X), an expected expansion of Hugh Brinson and an as-yet-unnamed pipeline from the Permian to the Gulf Coast (Arrow D).
We’ll look at the longer-term outlook for flow capacity relationships in the next episode of this Arrow Model blog series. Again, for more information on the model and how to get your hands on it, click here.
The post New Natural Gas Pipes and LNG Terminals Shake Up Texas/Louisiana Gulf Coast – RBN Energy appeared first on Energy News Beat.