Energy News Beat
The low point was in September. The Fed faces a scenario of re-accelerating inflation amid a retightening labor market.
By Wolf Richter for WOLF STREET.
The Fed has cited the underlying dynamics of the labor market that were deteriorating through September as one of the reasons for its rate cuts. But since September, these dynamics of the labor market, and other metrics of the labor market, have U-Turned, with the labor market solid and tightening just a tad, while inflation has been re-accelerating since July. And these underlying dynamics are further backing the Fed’s pivot to wait-and-see:
On a month-to-month and on a three-month average basis, all metrics today tightened up further: Job openings rose, with the three-month average reaching the highest level since May. Quits jumped. Hires rose to the most since July. And layoffs and discharges dropped sharply from already relatively low levels.
The triangular relationship in job openings, quits, and hires shows the churn in the labor market. This churn went haywire during the pandemic, as workers quit in huge numbers to get a better job somewhere else, even jumping to other industries. These quits left gigantic numbers of job openings behind, creating gigantic numbers of hires to fill those openings. The entire labor market got reshuffled and many people ended up with better jobs, better working conditions, higher pay, often in other industries.
Then came the corporate crackdown on the churn with announcements of massive layoff in their global workforce starting in 2022 to scare the bejesus out of workers. Only a portion of these announcements actually happened in the US, while these companies were still hiring at the same time. For companies, the pandemic churn had been costly, in terms of lost productivity and higher wages and all the expenses and inefficiencies associated with onboarding lots of workers. And they put a stop to it by scaring people into not quitting – and also by paying them more and trying to hang on to them in other ways.
Workers settled in and stopped quitting. Quits plunged to very low levels, leaving companies with far fewer job openings to fill, and far fewer hires to fill those job openings. So job openings and hires followed quits down. This is the triangular relationship between quits, job openings, and hires that describes churn in the labor market.
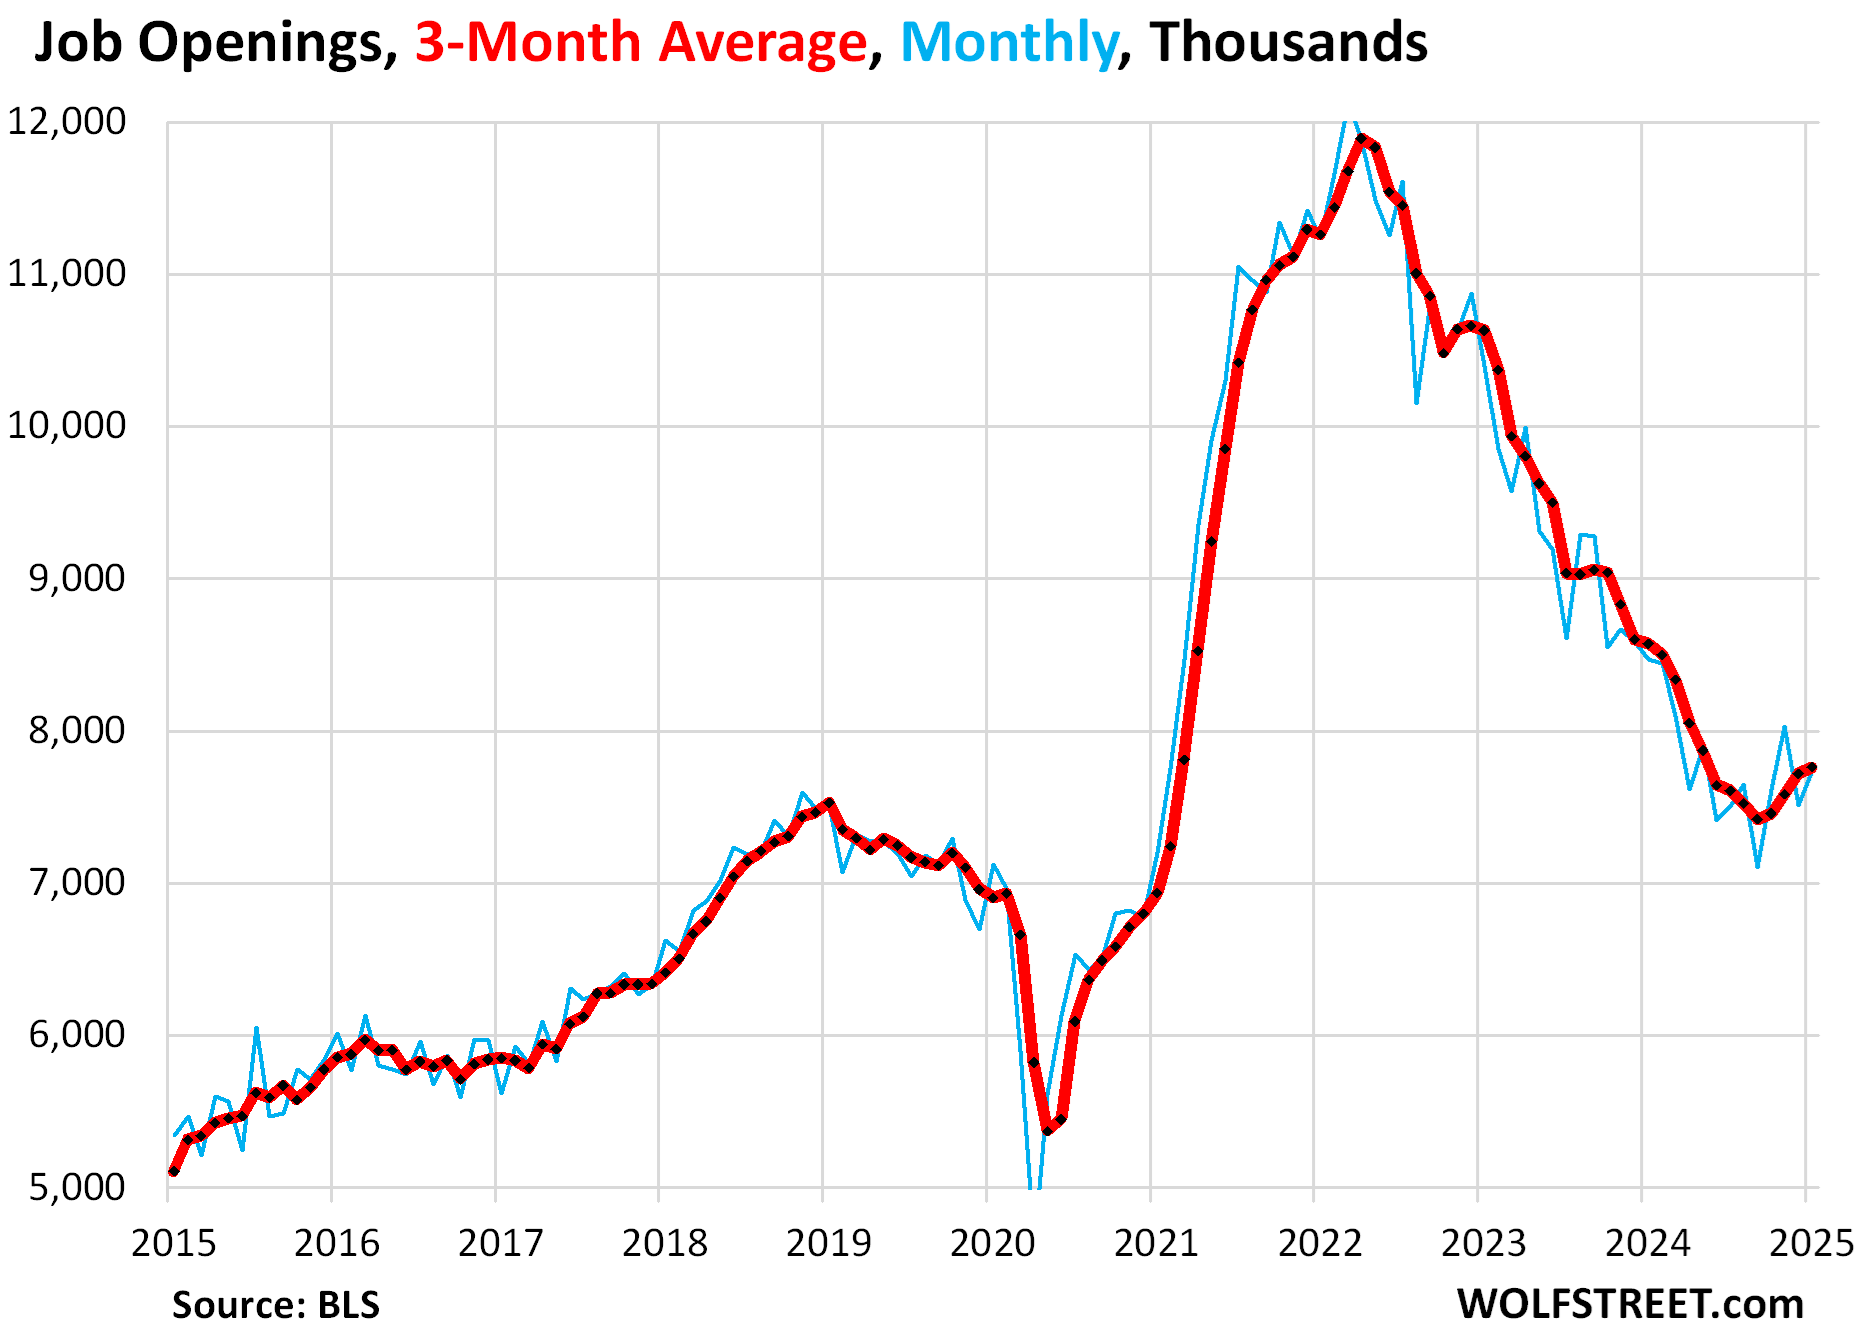
Job openings rose by 232,000 – nearly all in the private sector, with federal, state, and local governments combined just adding 3,000 openings – to 7.74 million in January, seasonally adjusted. The low point was in September with 7.10 million openings (blue in the chart below).
This data from the Job Openings and Labor Turnover Survey (JOLTS) by the Bureau of Labor Statistics today is based on surveys of about 21,000 work locations, and not on online job postings.
The three-month average job openings rose for the fourth month in a row from the low point in September. But even the September low point was still above the prior historic high point in late 2018 (red).
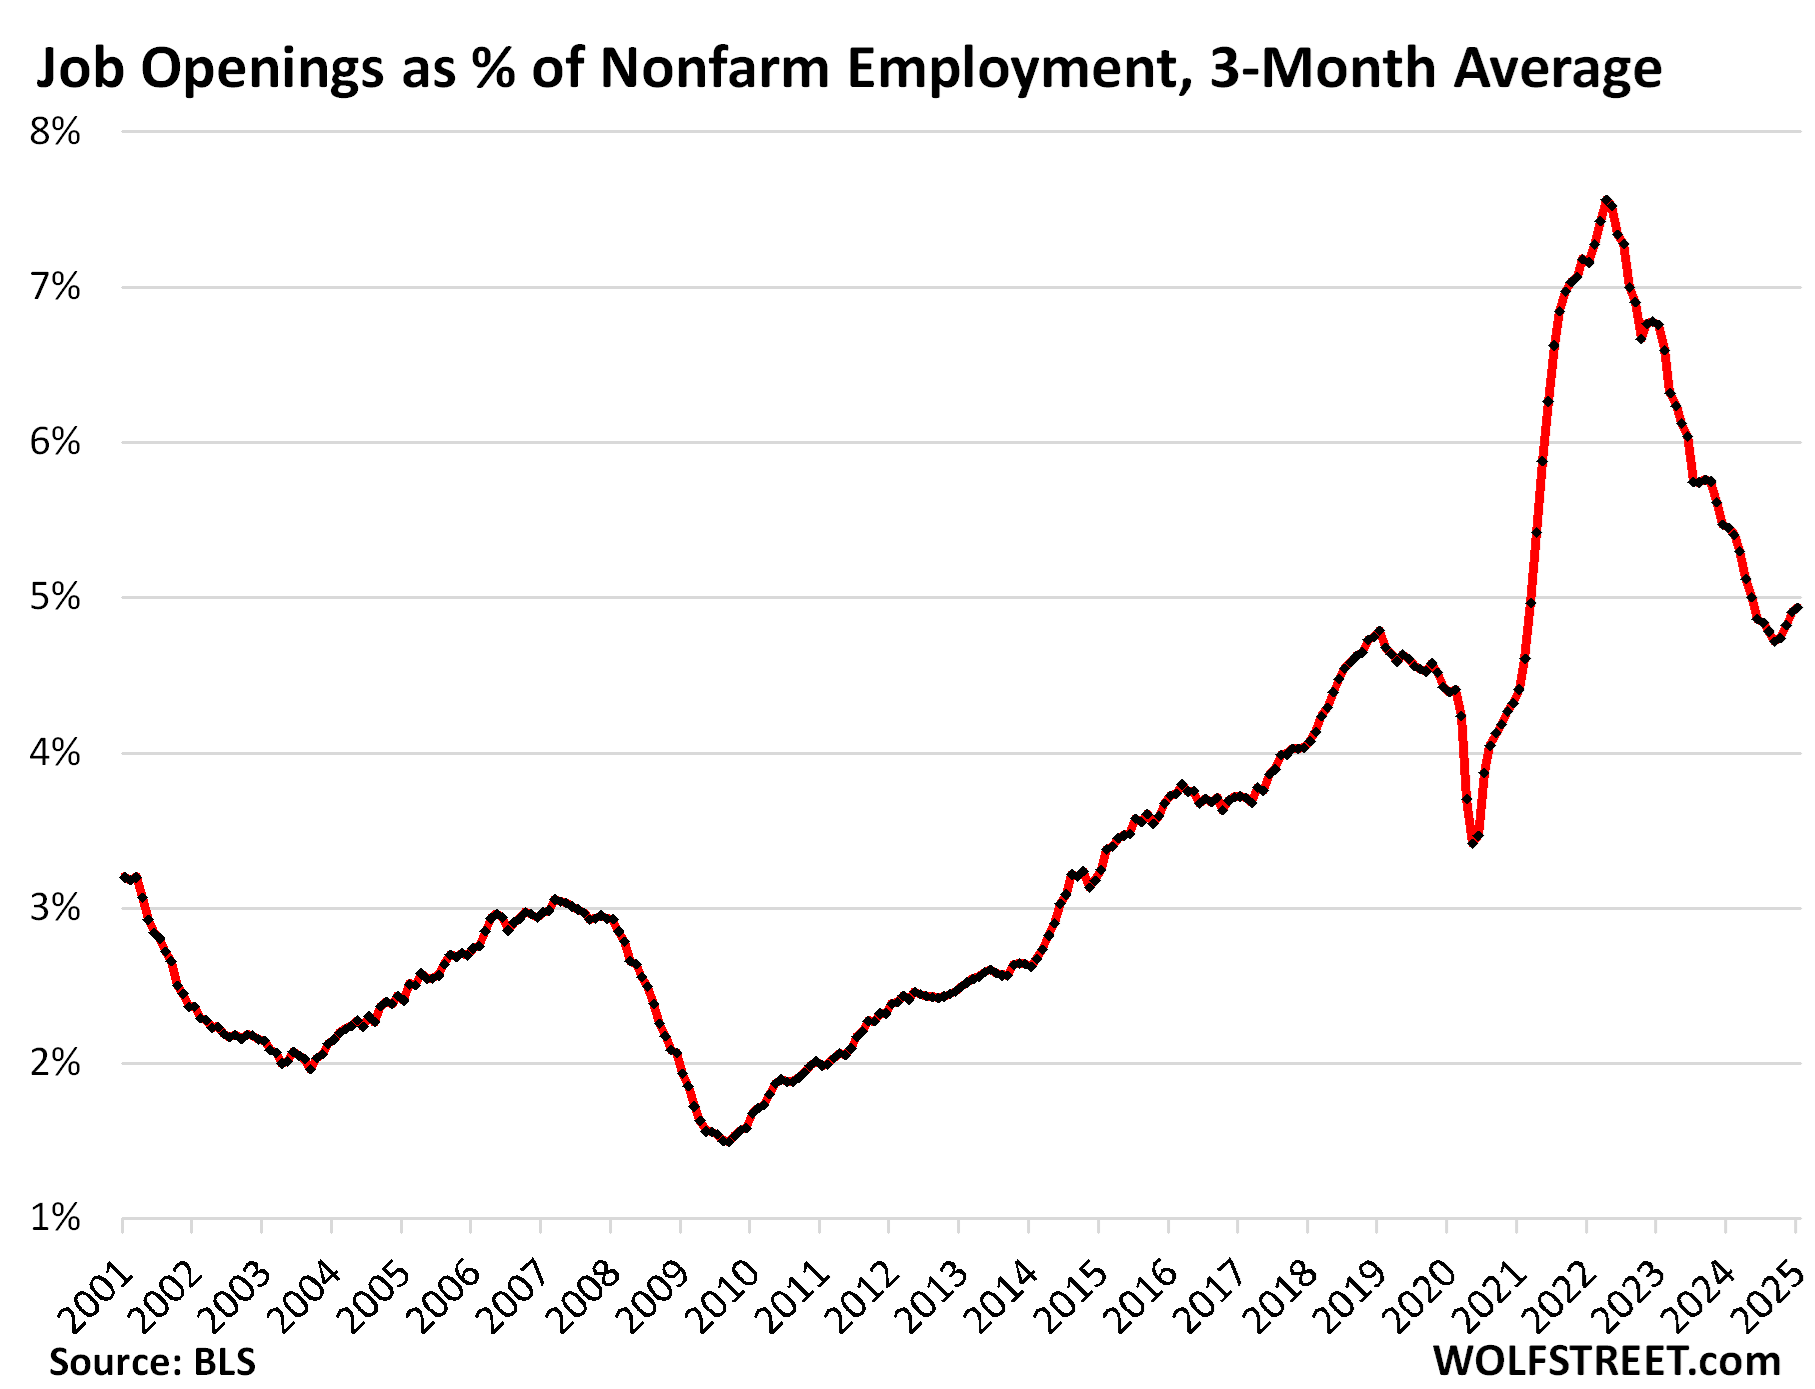
Job openings as percent of nonfarm payrolls ticked up for the fourth month in a row, to 4.93% of nonfarm payrolls, on a three-month average basis. This shows that the labor market is still historically tight, though not nearly as tight as it had been during the period of labor shortages and maximum churn of the pandemic.
During the employment crisis of the Great Recession, that ratio plunged to 1.5%:
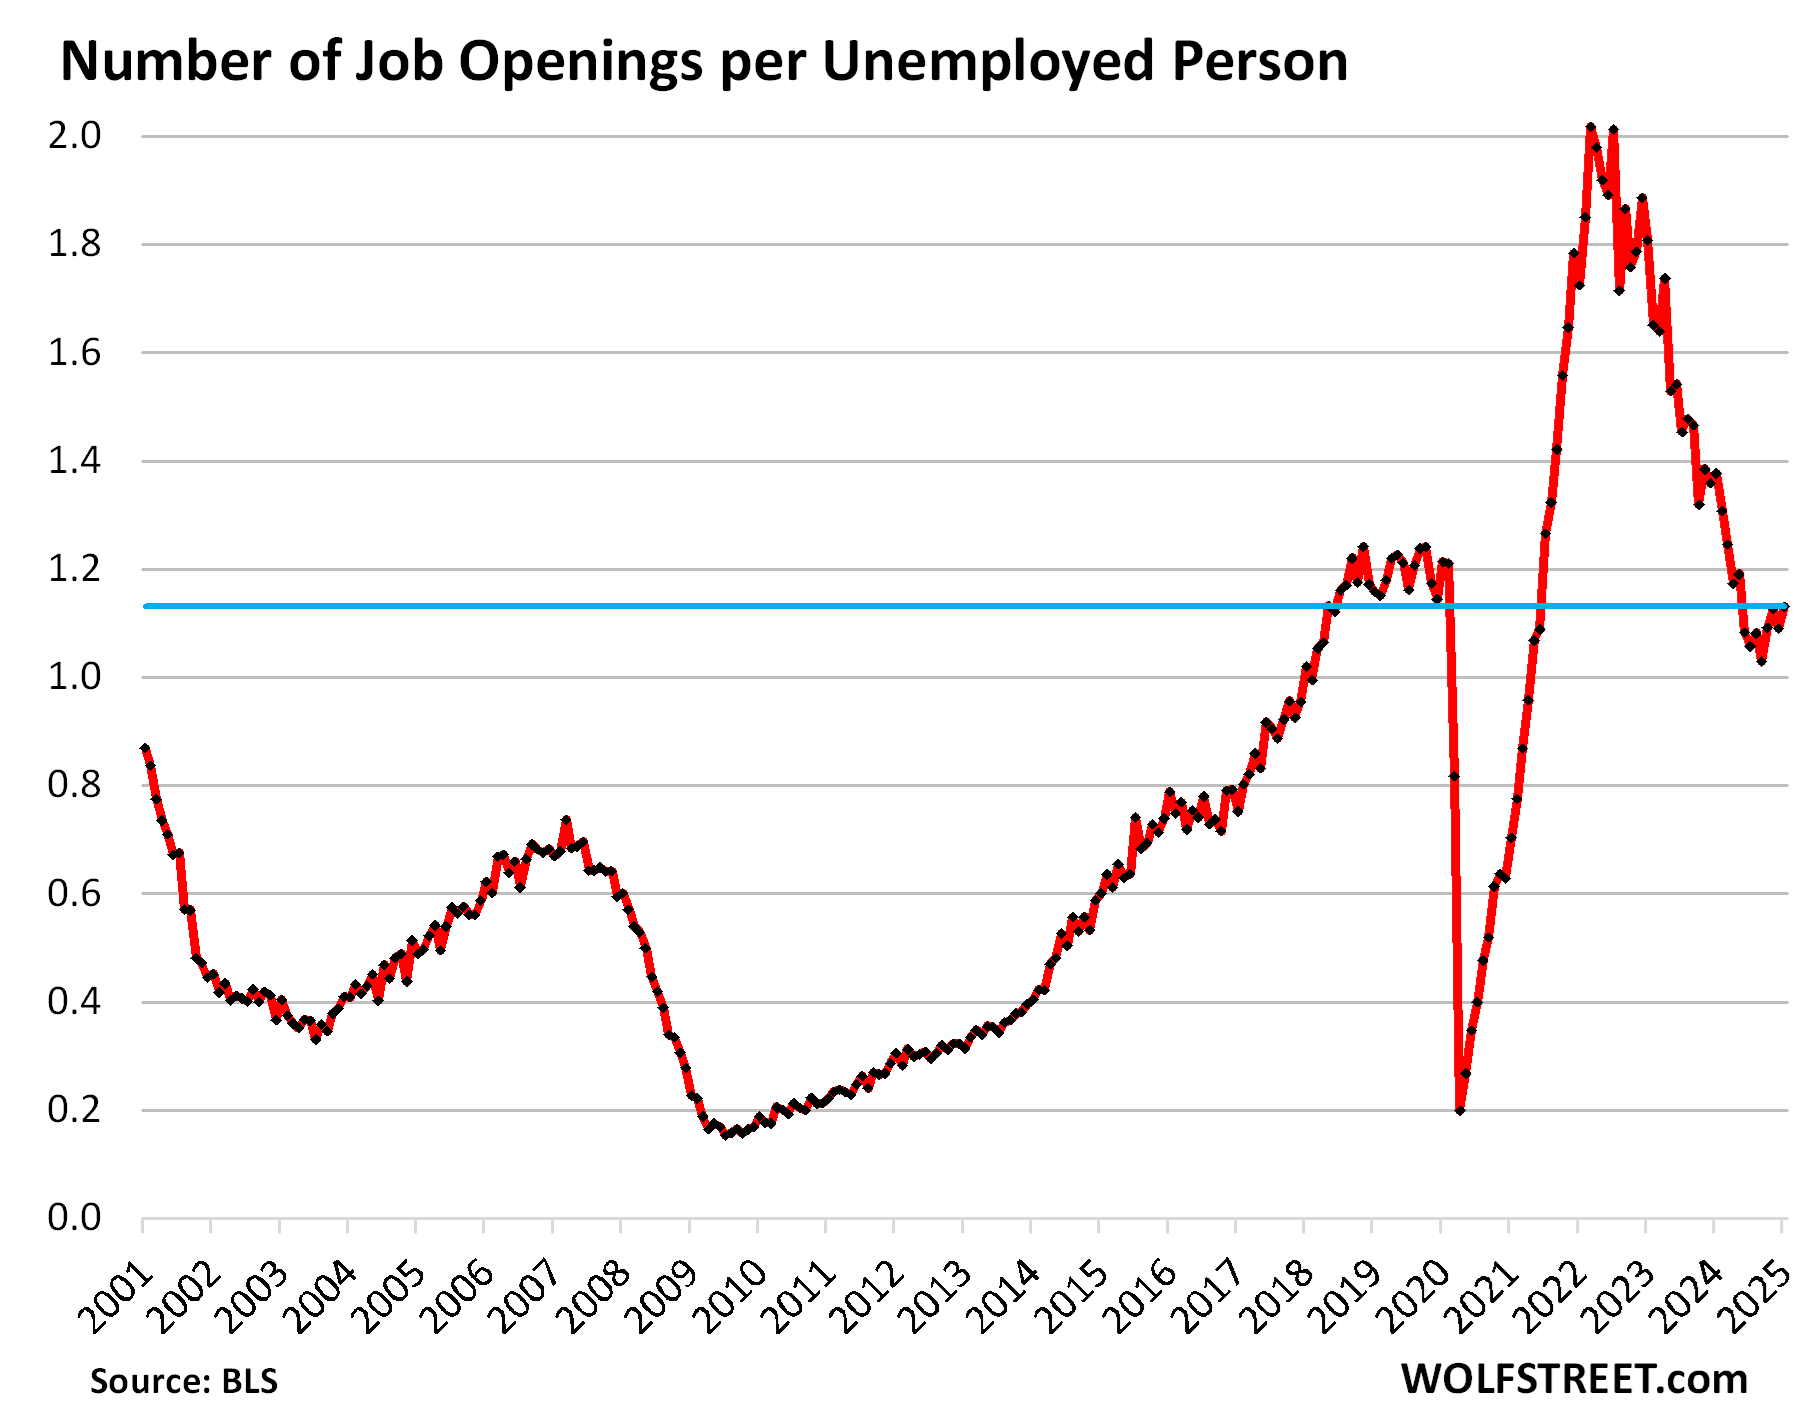
The figure Powell cites a lot: The number of job openings per unemployed person ticked up to 1.13 job openings for each person who was unemployed and looking for a job during the reference period (7.74 million openings for 6.85 million unemployed).
The ratio is the highest since May. The low point had been in September, when the Fed got spooked. It shows a relatively tight labor market compared.
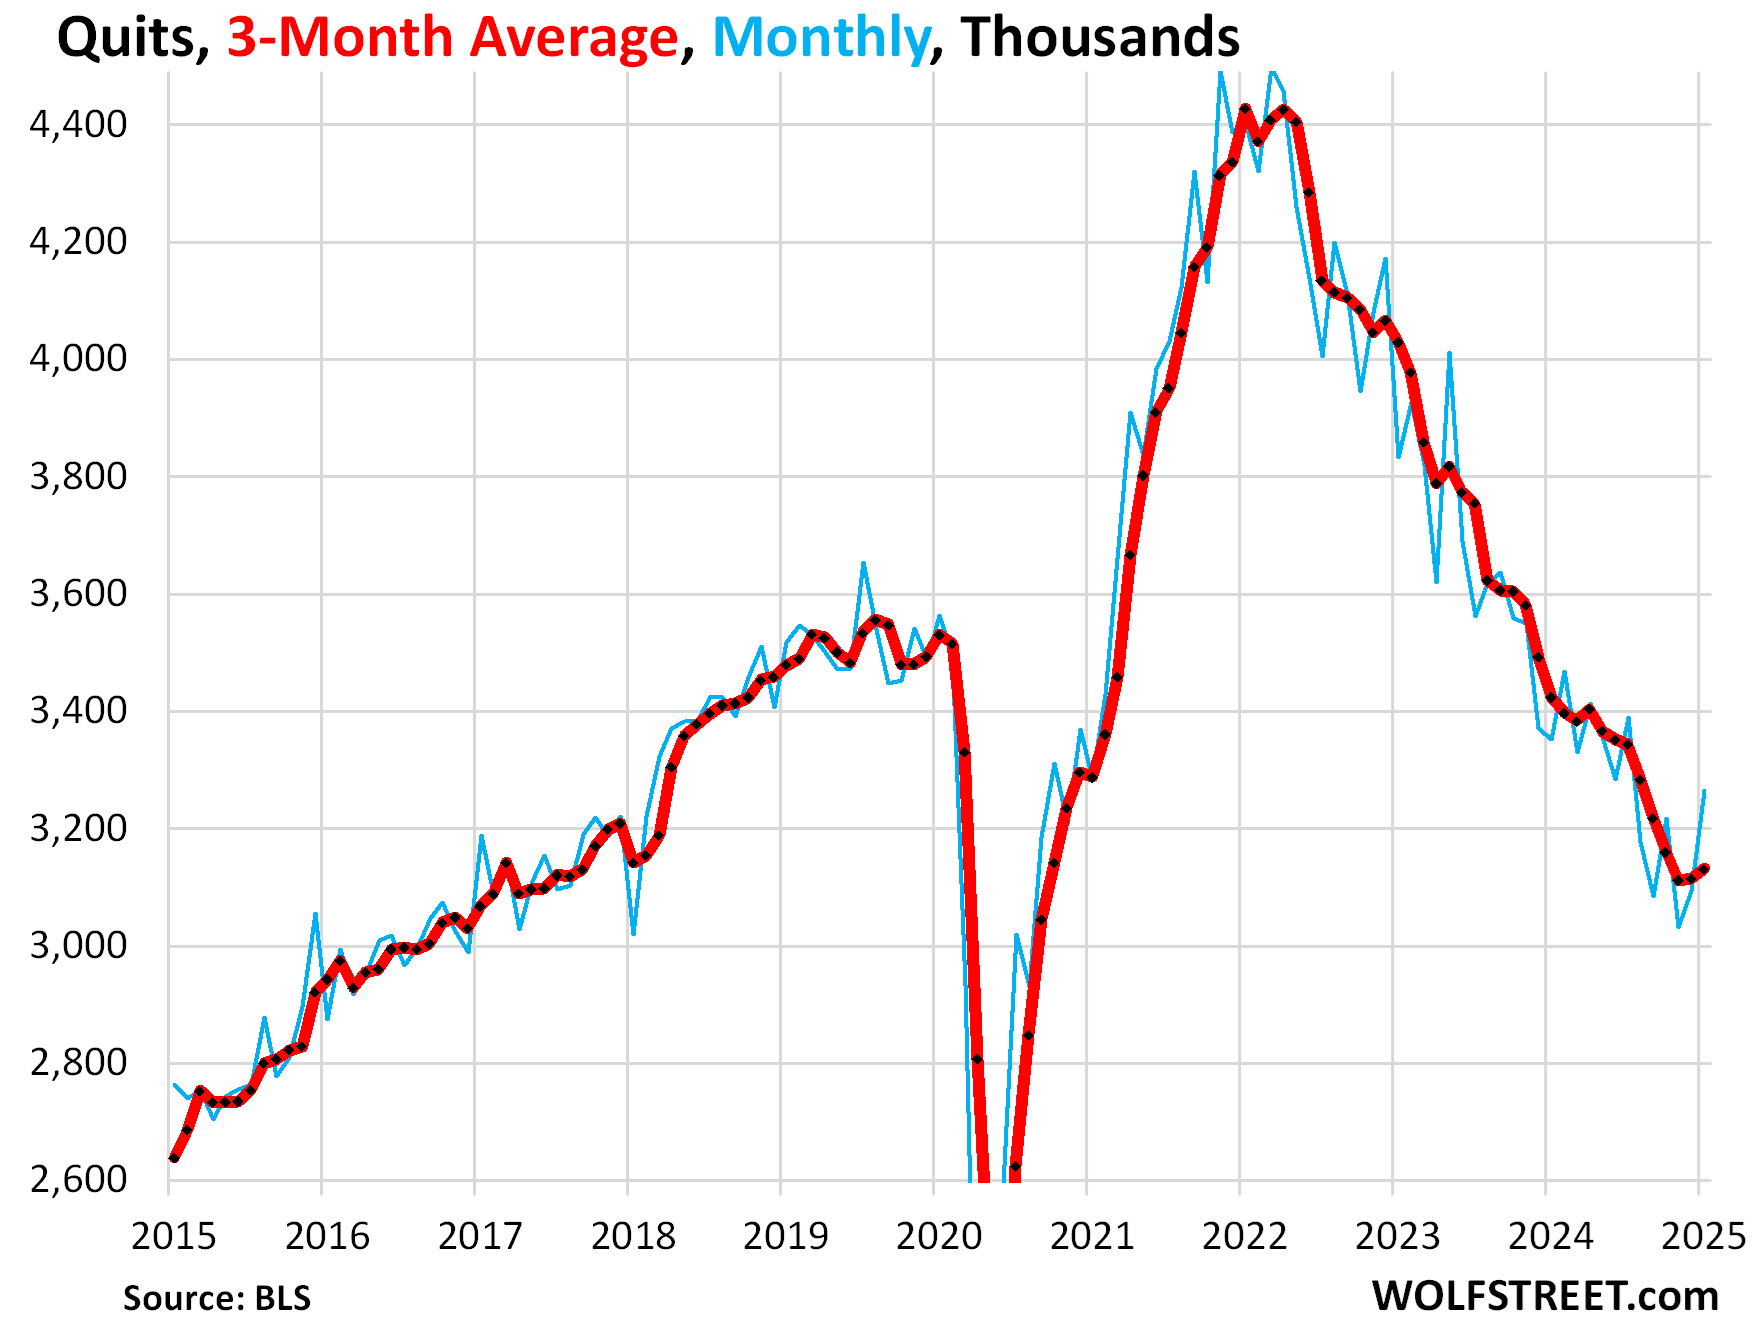
Quits jumped by 171,000 to 3.27 million, the highest since July.
The three-month average rose to 3.13 million, the highest since October, and the second month in a row of increases.
Quits are an indication of how emboldened employees feel to quit a job and go for a better job. Retirements, deaths, etc. are not included in “quits” but in “other separations.”
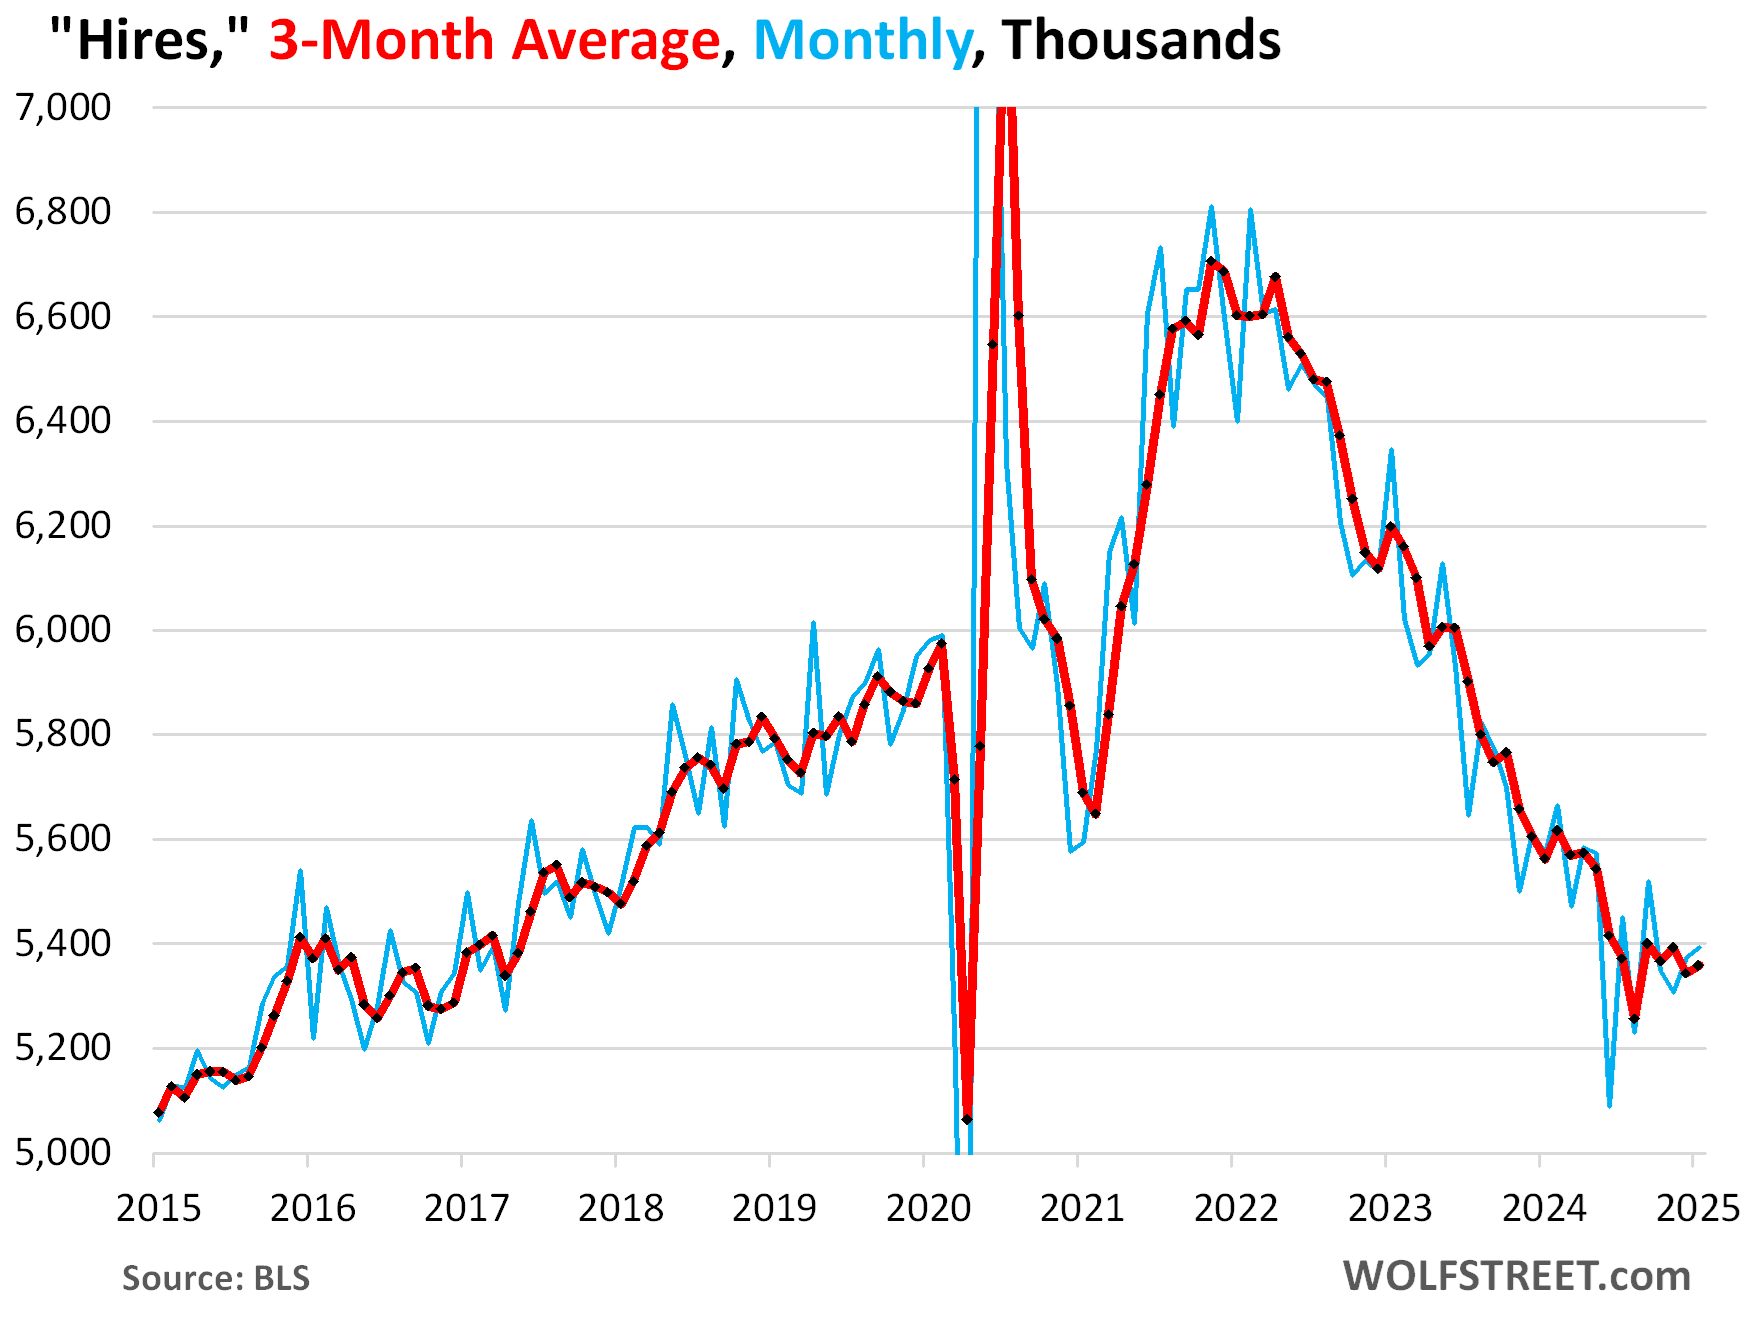
Hires rose by 19,000 to 5.39 million in January, seasonally adjusted. The low point was in June (5.09 million hires). The three-month average ticked up to 5.36 million.
Hiring is very seasonal. Not seasonally adjusted, hires spiked by 1.32 million to 5.26 million.
When the churn began to cool in the second half of 2022, fewer workers quit, so fewer jobs were left behind, and job openings plunged, and fewer people needed to be hired to fill those left-behind openings, and so hires plunged along with it.
Layoffs and discharges dropped to 1.63 million in January, the lowest since June.
The three-month average dropped for the second month in a row, to 1.68 million, the lowest since August.
They have “normalized” to the low end of the range during the Good Times before the pandemic. Getting fired is a standard feature in the American workplace even during the best times.
Layoffs and involuntary discharges include people getting fired with or without cause. It does not include retirements, deaths, etc., which are in the category of “other separations.”

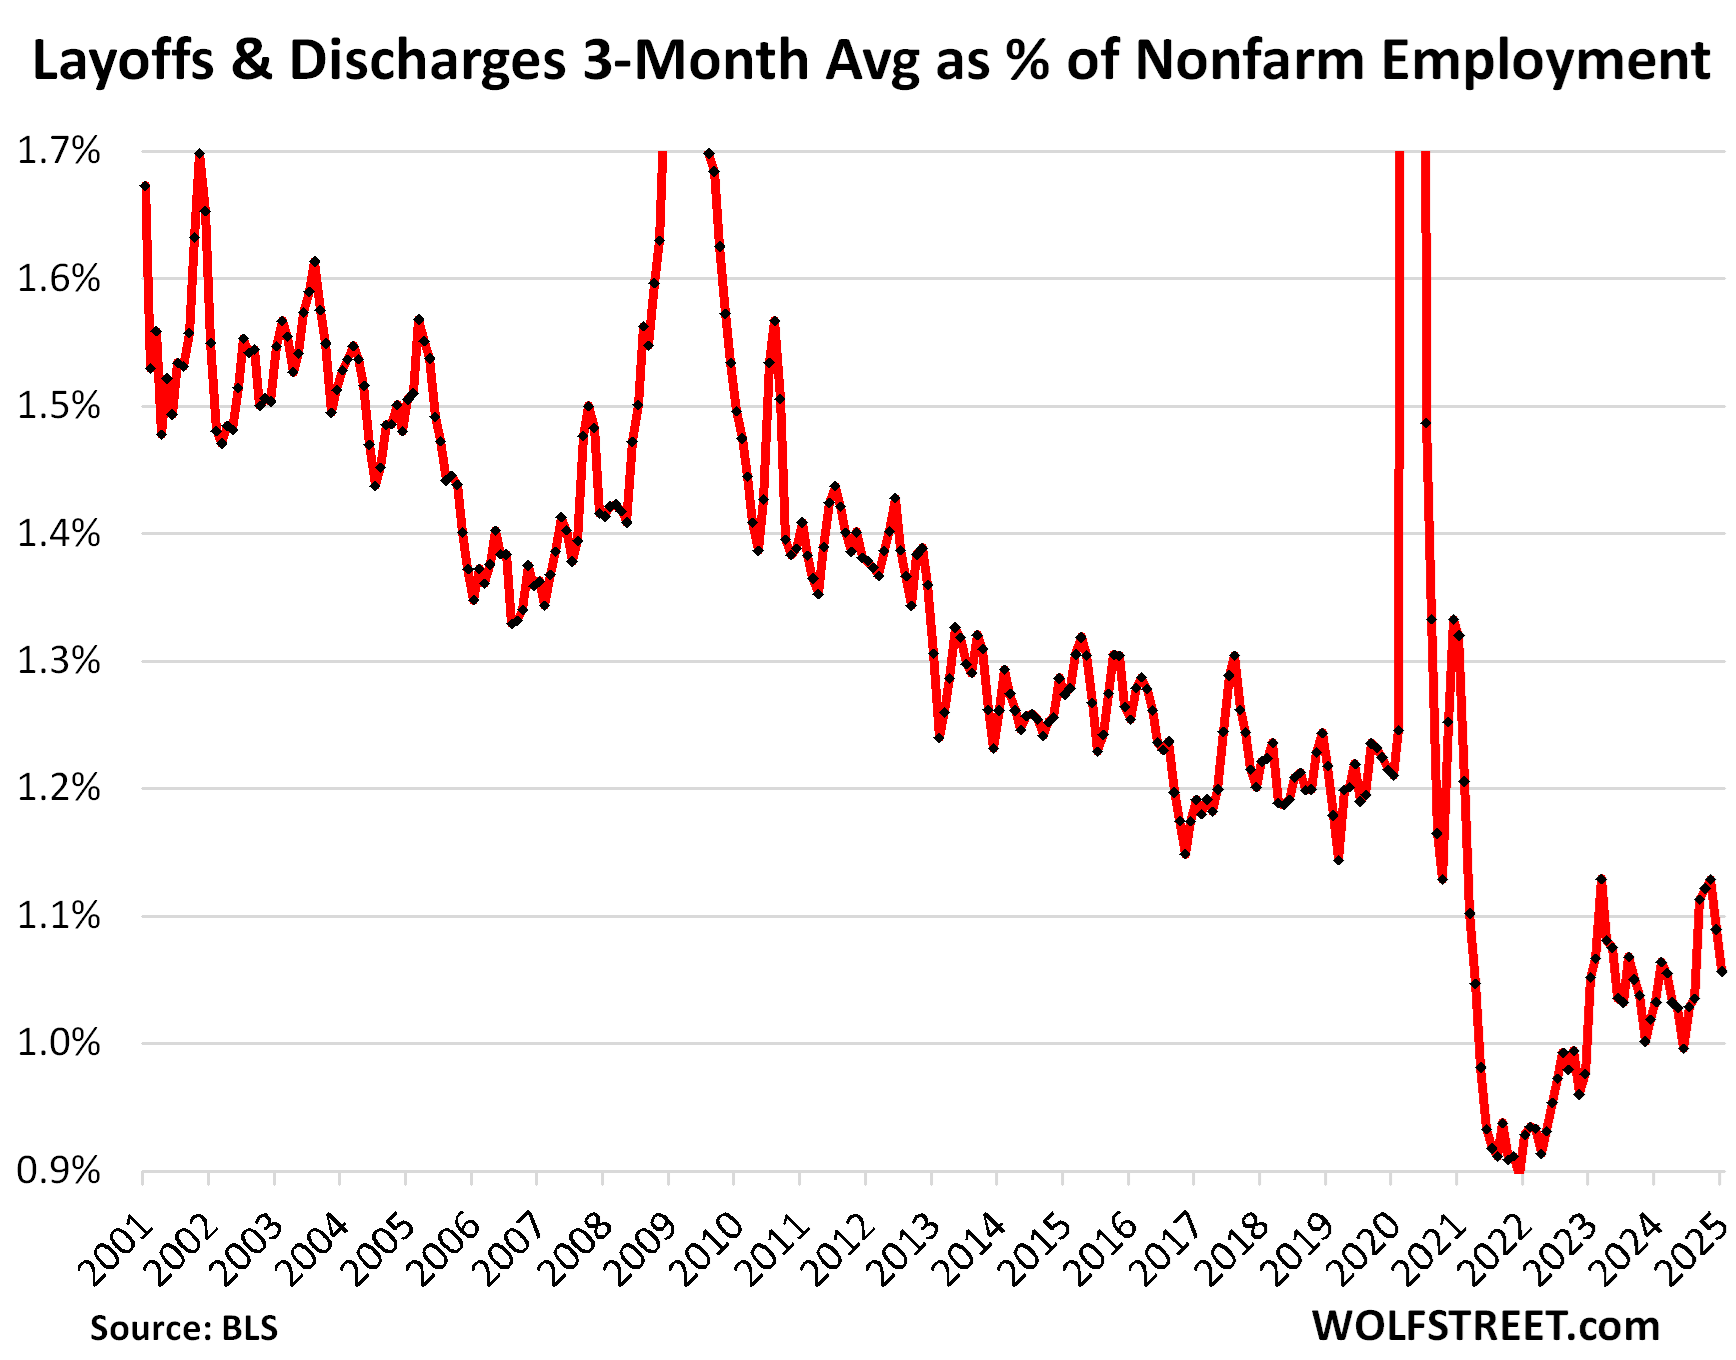
Layoffs and discharges as percent of nonfarm payrolls fell to 1.06%, the lowest since August, well below any time during the pre-pandemic years in the JOLTS data going back to 2001.
This ratio accounts for growing employment over the years and is the better metric to look at for a long-term view.
It shows that, compared to the size of nonfarm employment, layoffs and discharges are historically low, as employers are hanging on to their workers.
Enjoy reading WOLF STREET and want to support it? You can donate. I appreciate it immensely. Click on the mug to find out how:

![]()
The post Labor Market Dynamics Tighten Further. Job Openings, Quits, Hires Rise, Layoffs & Discharges Drop, Back Fed’s Wait-and-See appeared first on Energy News Beat.