
Energy News Beat
Listings YoY: San Diego +66%, Los Angeles +47%, Orange County +79%, Riverside-San Bernadino +51%, San Jose & Silicon Valley +56%; San Francisco metro +40%, Sacramento +55%, Fresno +42%.
By Wolf Richter for WOLF STREET.
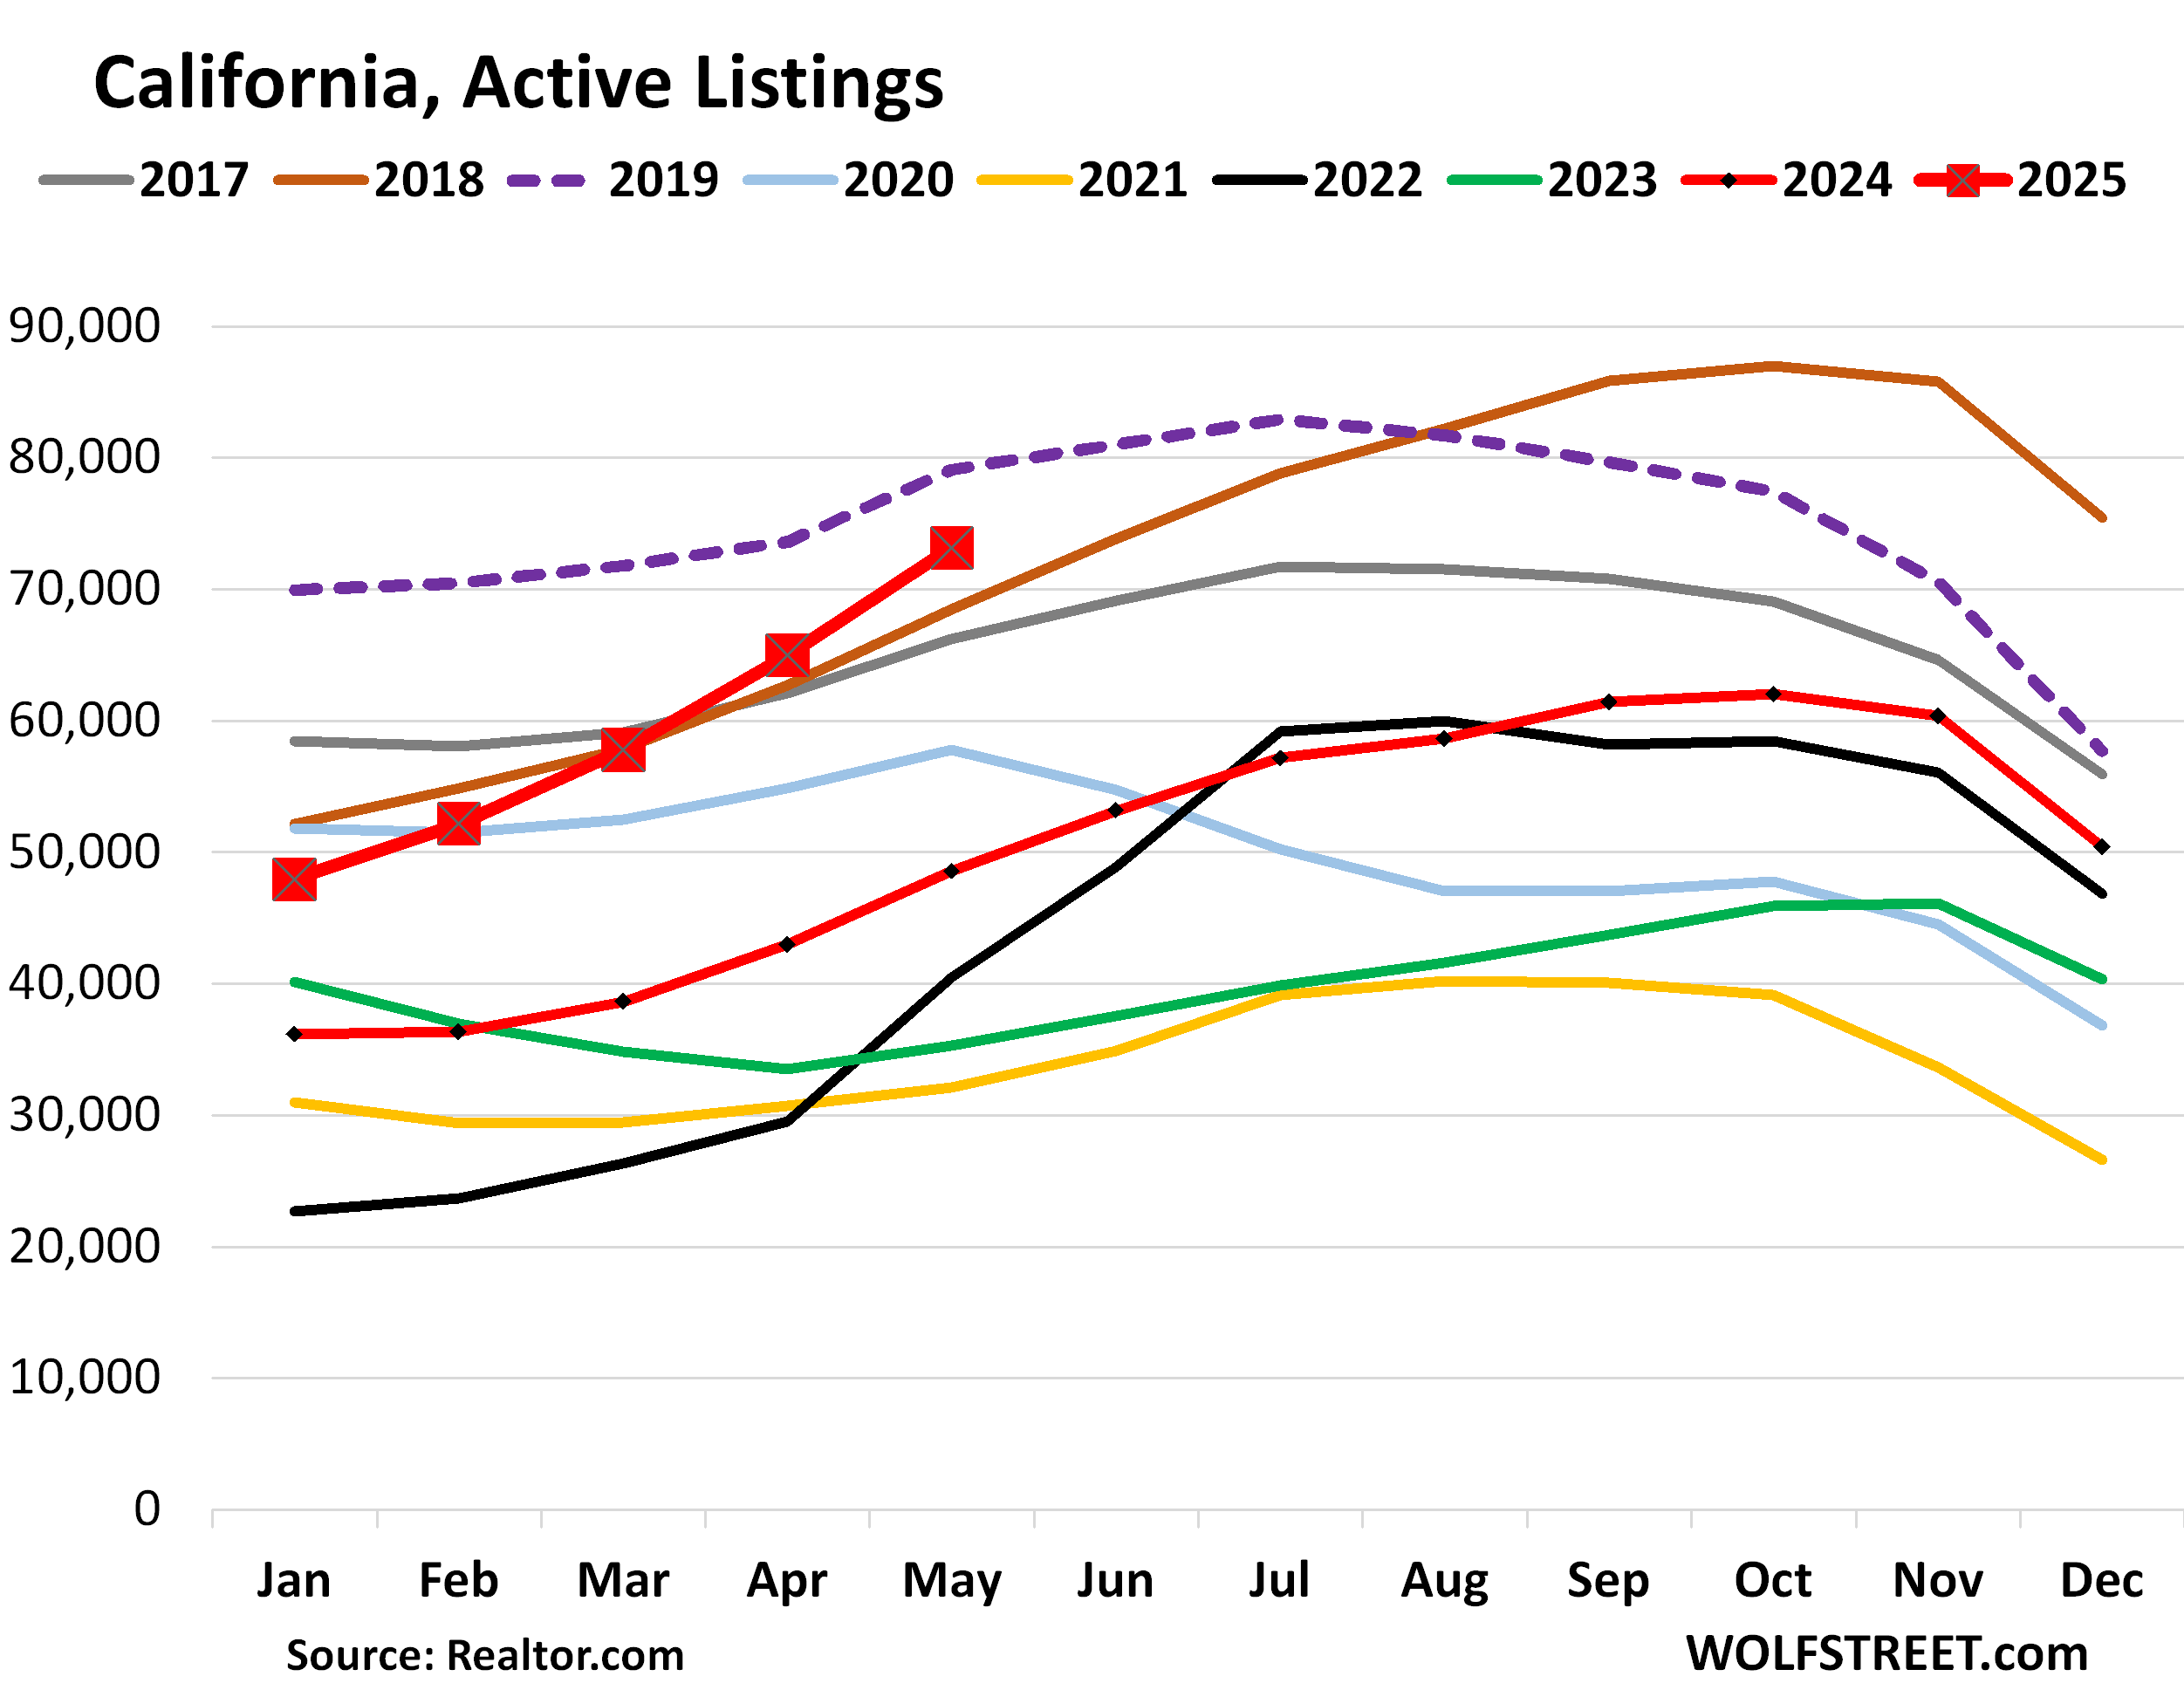
The problem is demand in California. It has essentially collapsed. New listings aren’t that high. But because the inventory of homes for sale doesn’t sell, and new listings are added to it, the total piled up. And it has been doing that for three years, albeit from very low levels. But now active listings are ballooning at an astonishing rate. For all of California, active listings in May have surged by 51% year-over-year and marked the second highest May since 2016, behind only 2019. Active listings are surging in all of the largest markets, but in some more so than others.
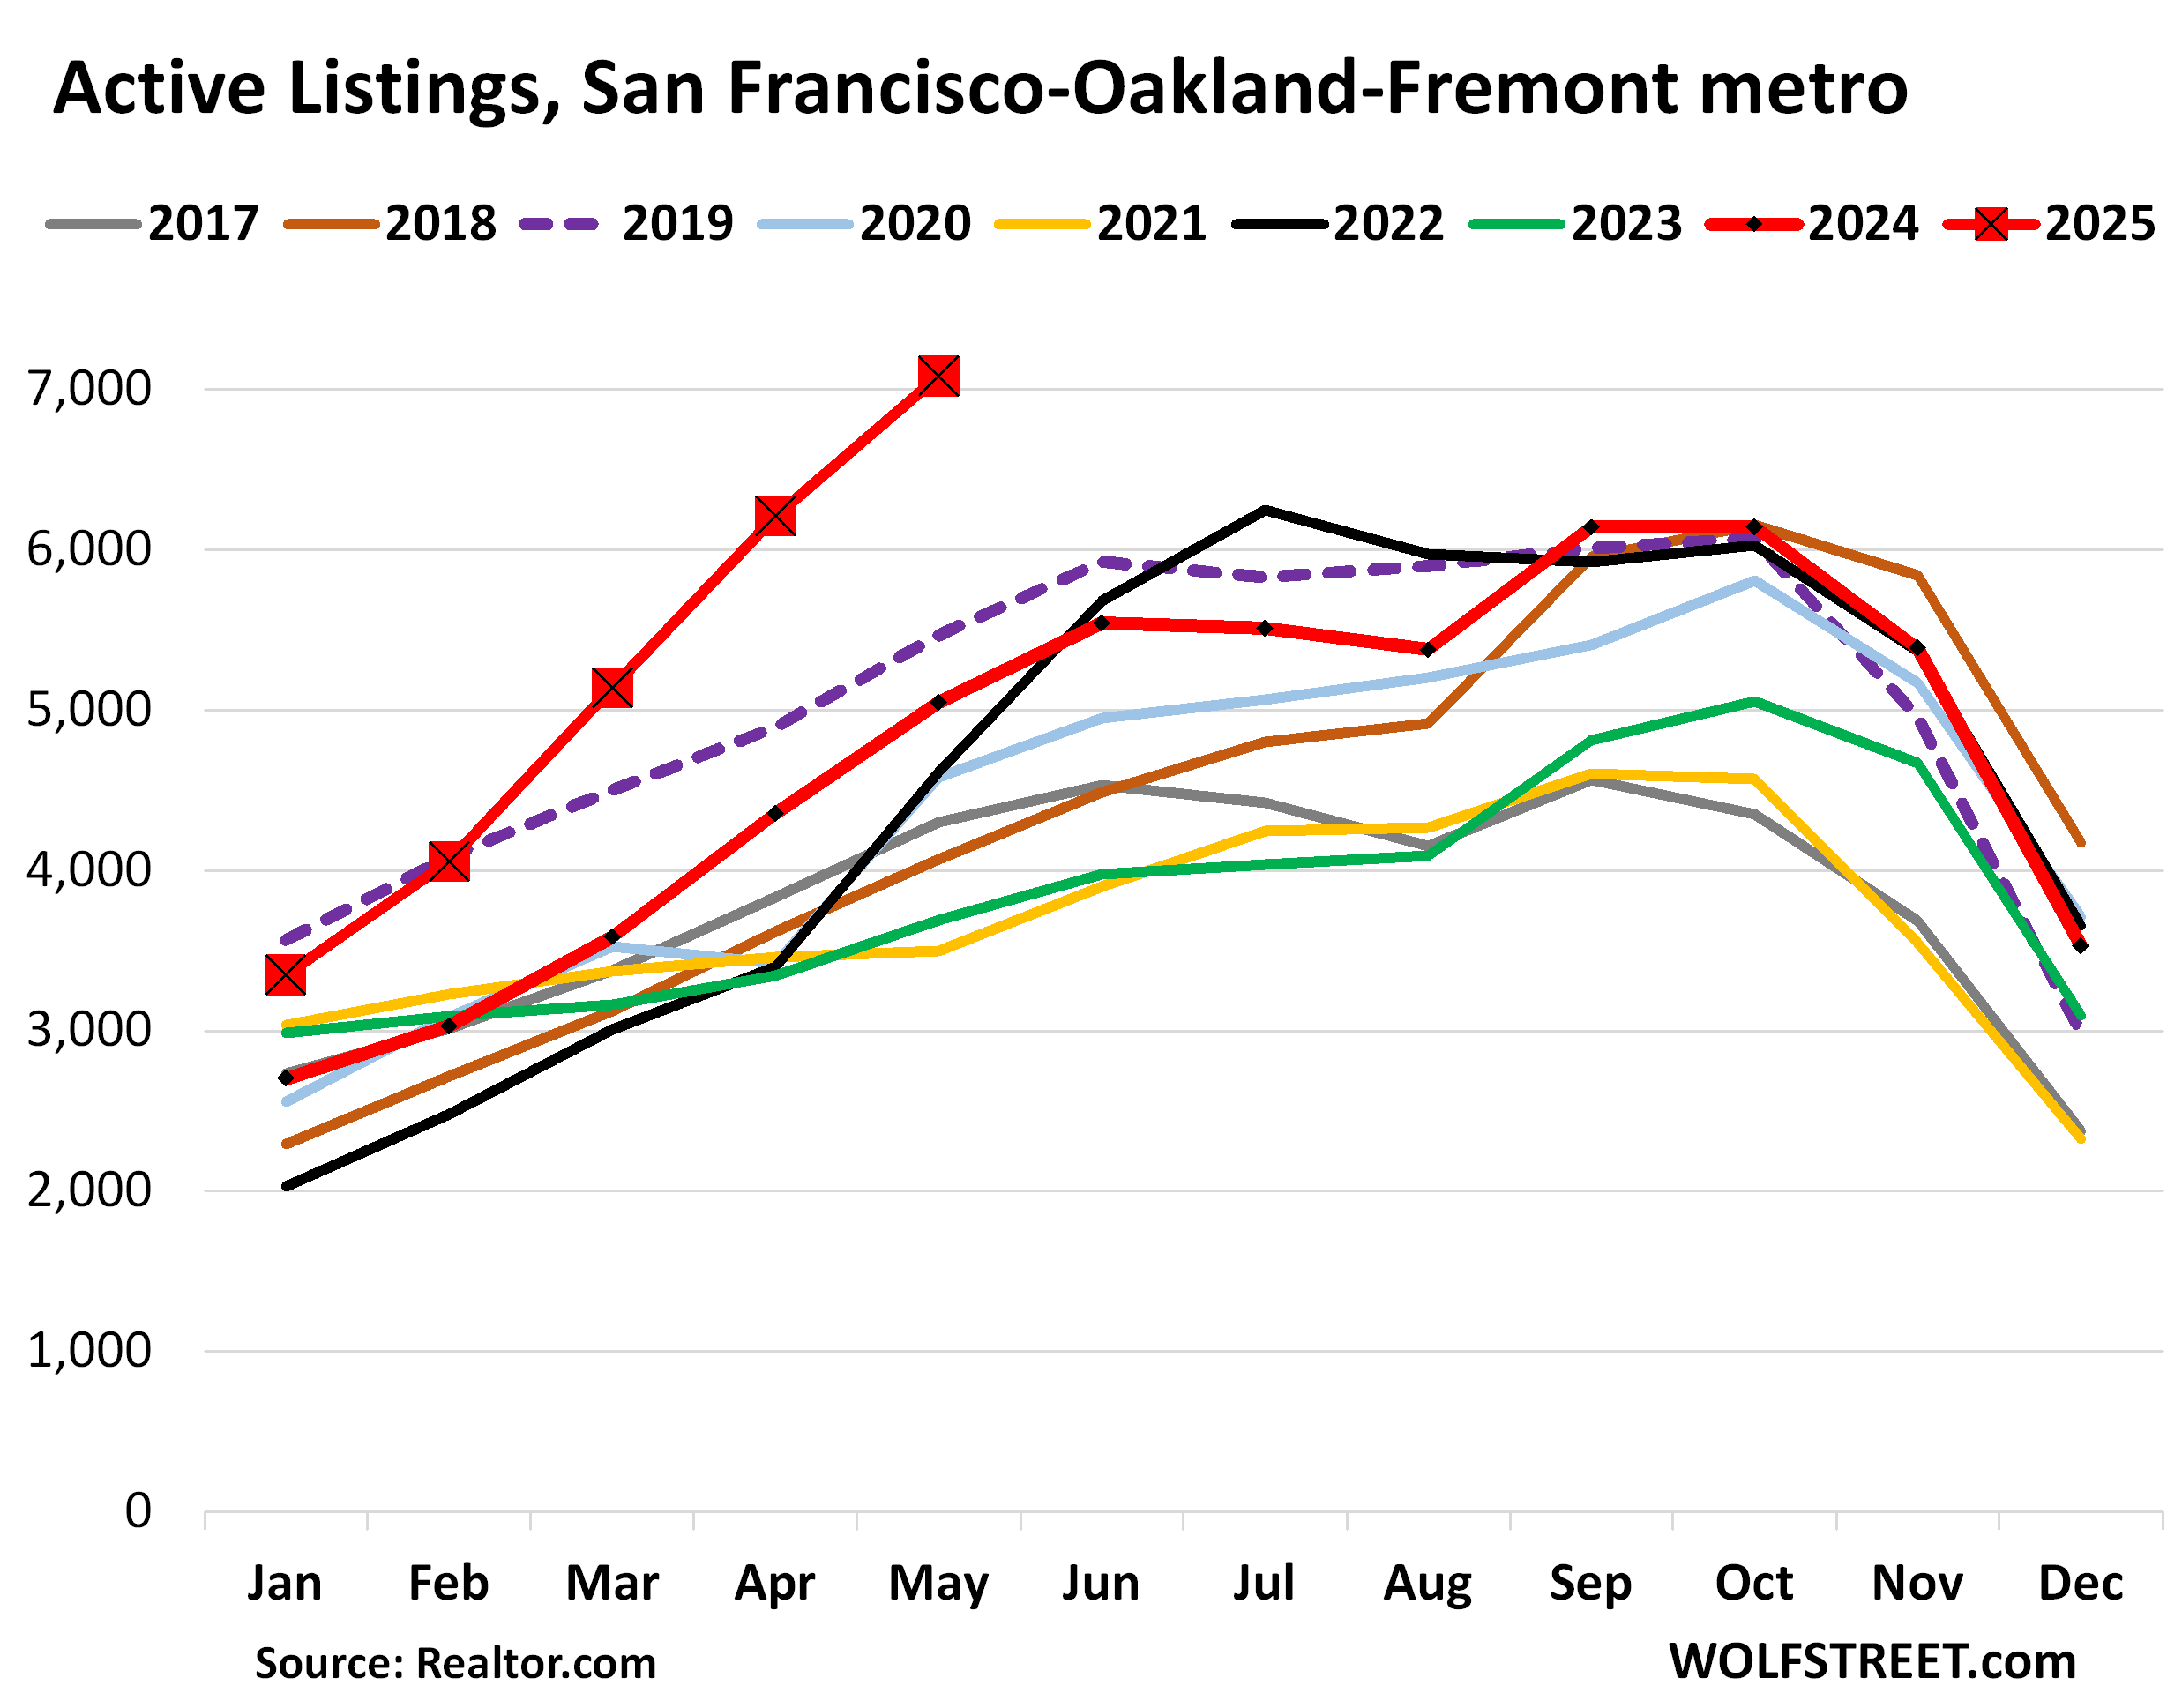
San Francisco-Oakland-Fremont metro: Year-over-year, active listings jumped by 40% in May, to 7,080 homes for sale, by far the most for any month in the data from realtor.com going back to 2016. Compared to May 2019, the second highest May in the data (purple dotted line), active listings were up by 30%. Amazing how fast that endlessly hyped “housing shortage” has become a housing flood.
This metropolitan statistical area (MSA) includes the counties of San Francisco and San Mateo (which includes the northern portion of Silicon Valley), part of the East Bay, and part of the North Bay.
Active listings are homes for sale that do not have a pending sale. They’re the “unsold” inventory. Total inventory, on the other hand, includes active listings (unsold inventory) plus inventory with a pending sale (sold inventory).
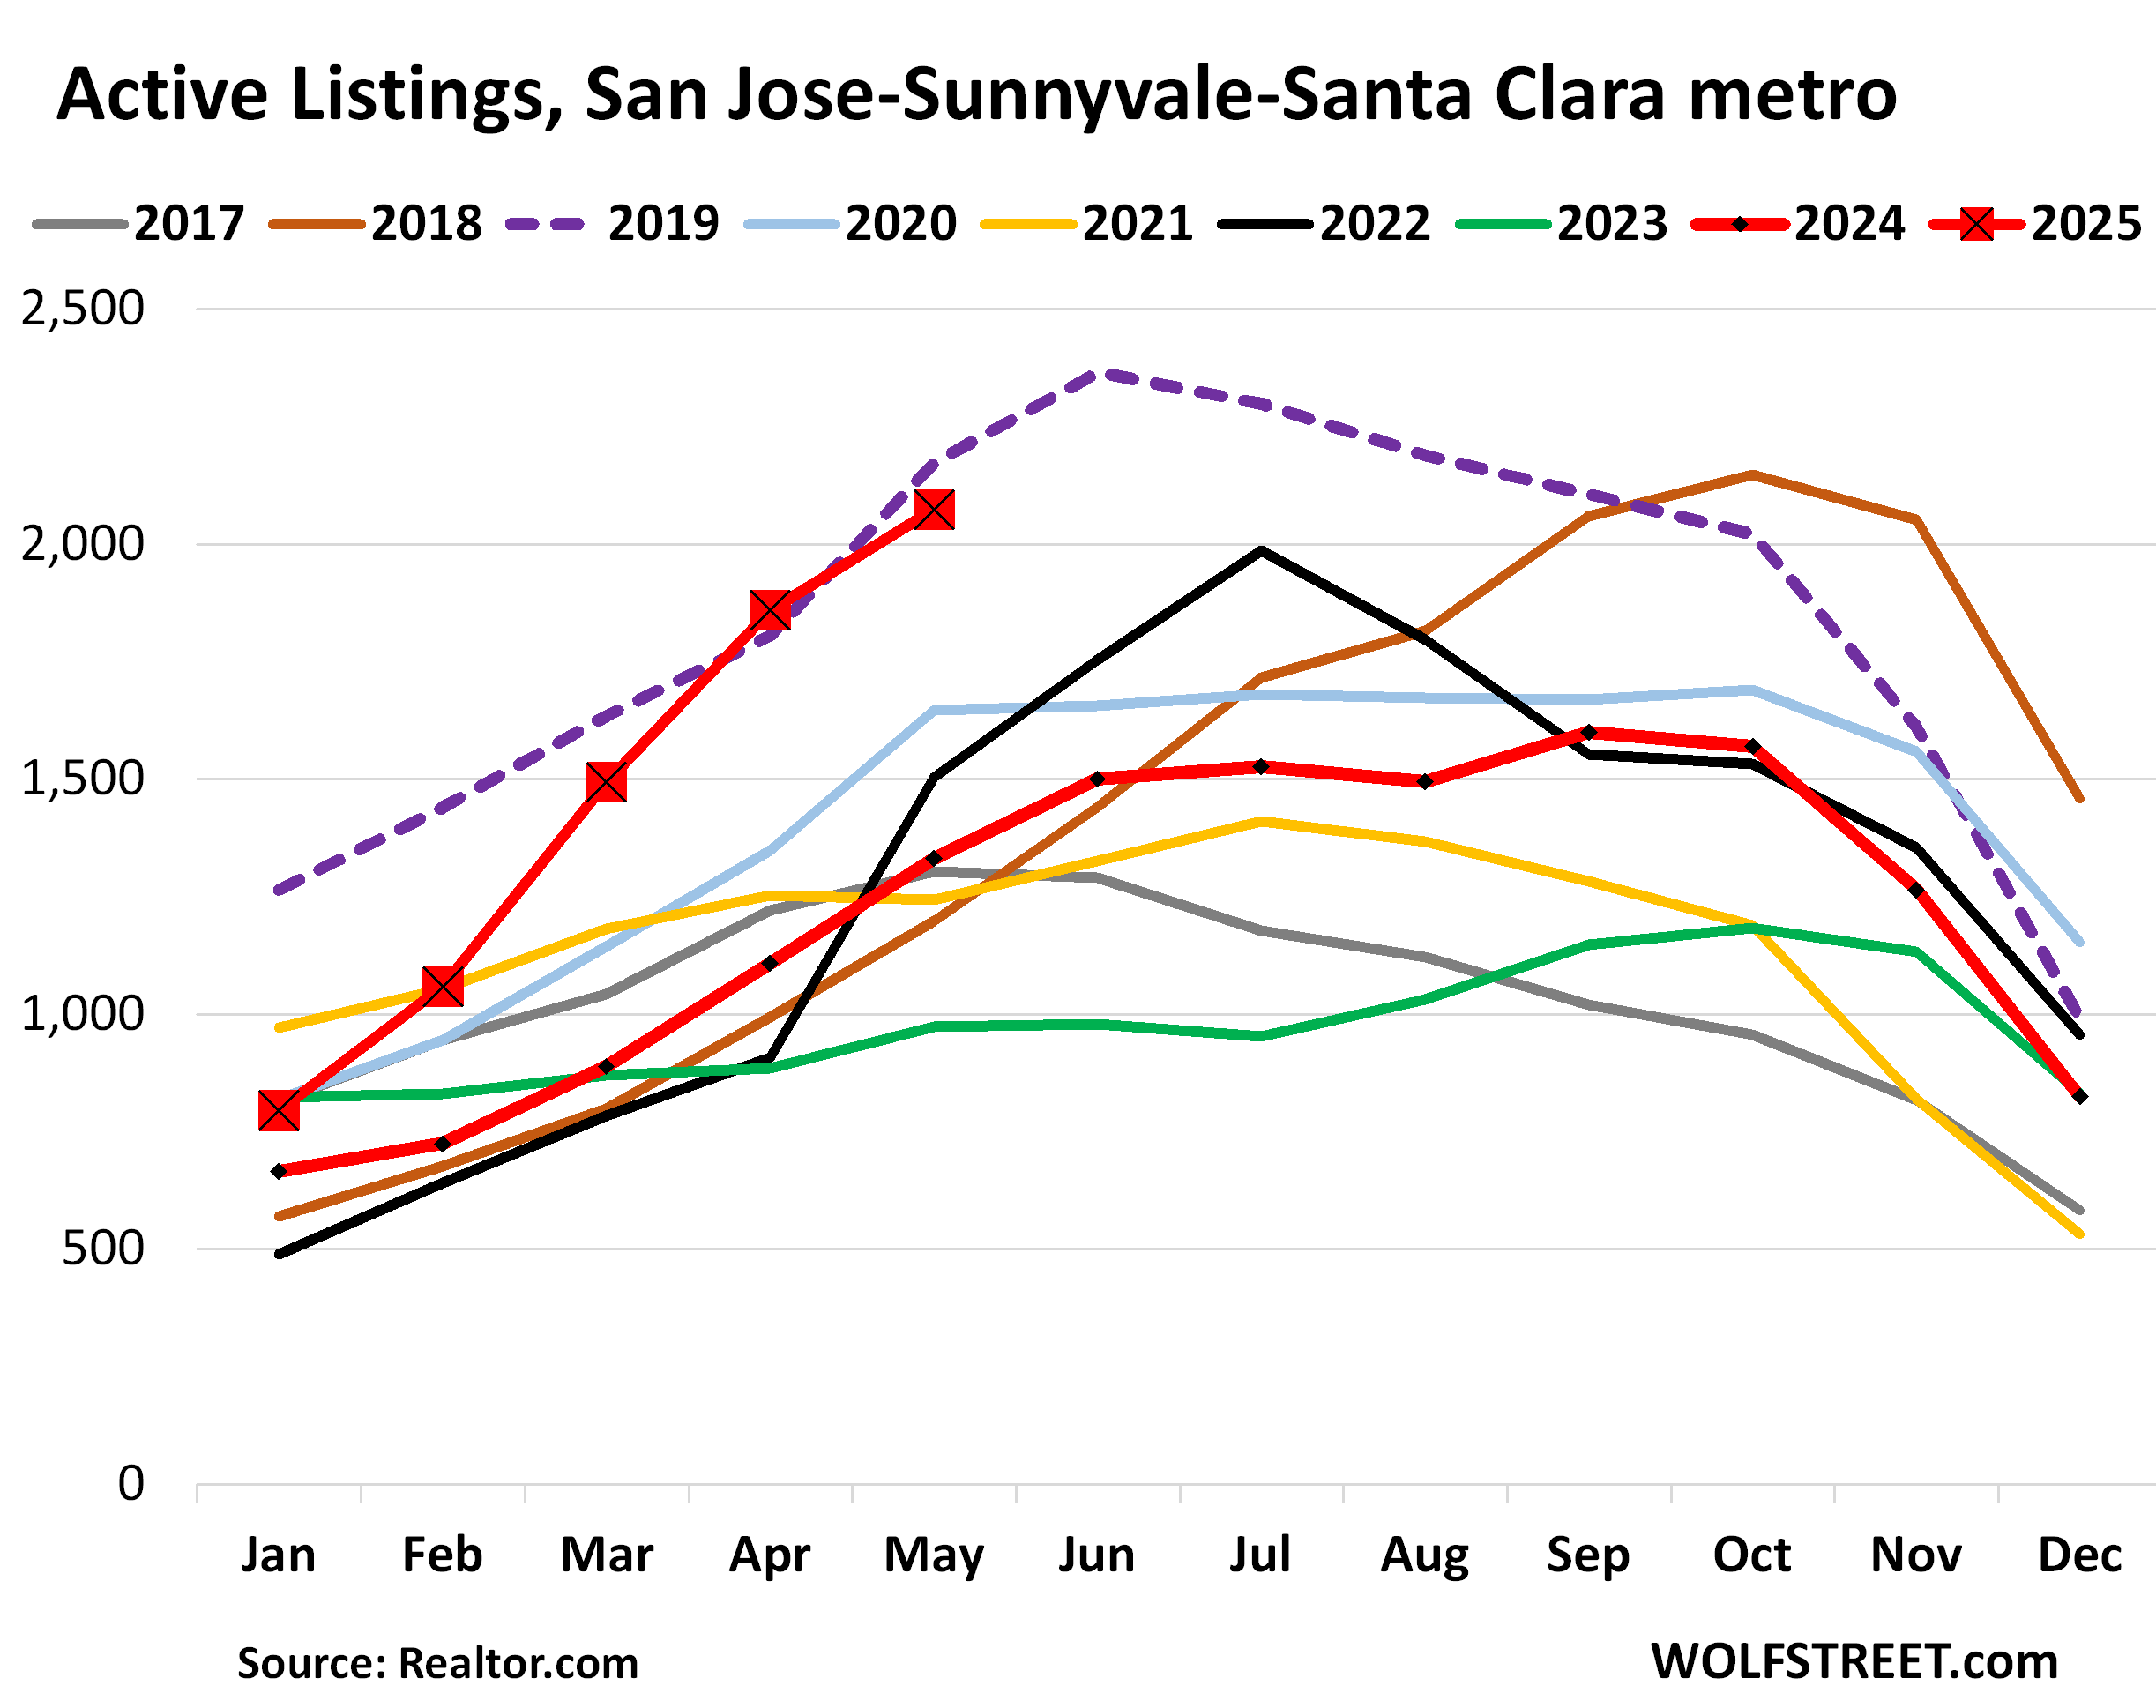
San Jose-Sunnyvale-Santa Clara metro: Active listings spiked by 56% year-over-year in May, to 2,074 homes for sale, the most for any May since the surge in 2019, in the data from realtor.com going back to 2016.
In January, active listings had still been down by 37% from January 2019. Now they’re neck to neck, even though they’d also surged in 2019.
In 2018, the Fed was hiking rates, and the average 30-year fixed mortgage rate rose to 5% by November 2018, and home sales stalled, and inventories piled up in the second half of 2018 (brown line) and into mid-2019 (dotted purple line), by which time mortgage rates had come down:
The MSA includes Santa Clara County (San Jose and the southern part of Silicon Valley) and goes south into rural areas.
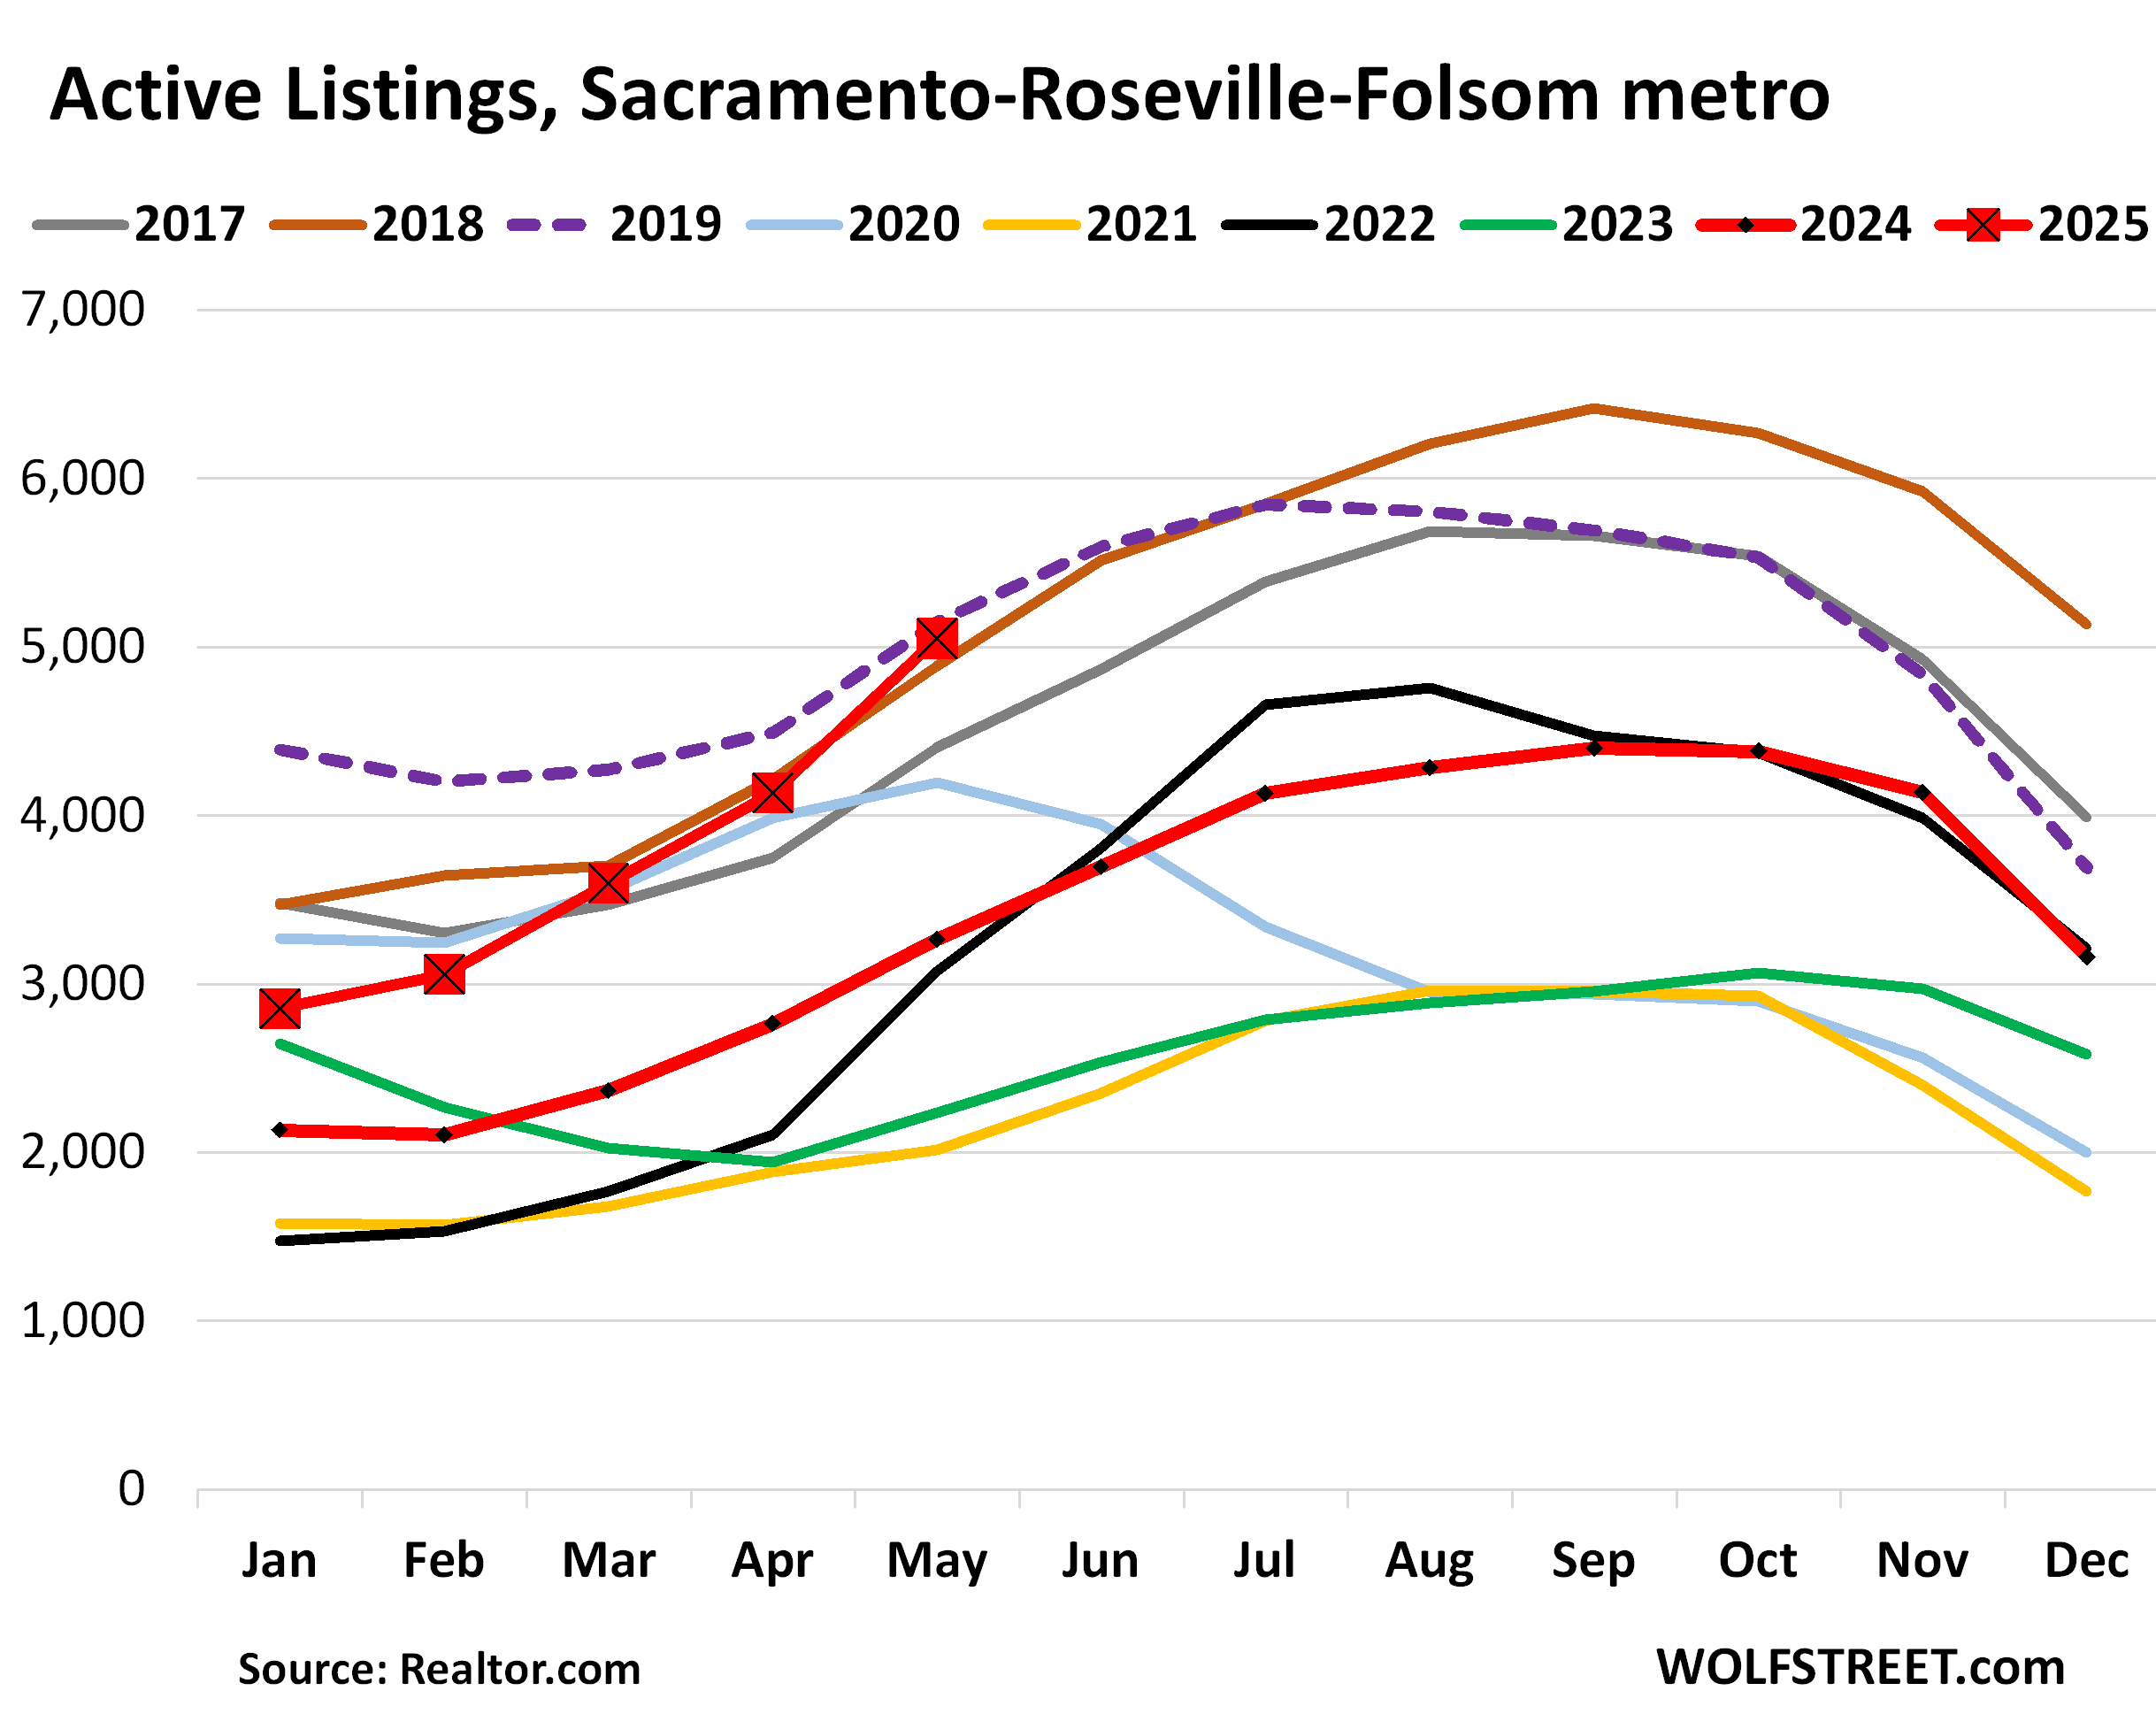
Sacramento-Roseville-Folsom metro: Active listings spiked by 55% to 5,050 homes for sale, the second highest in the data going back to 2016, just a hair below May 2019 (dotted purple line)
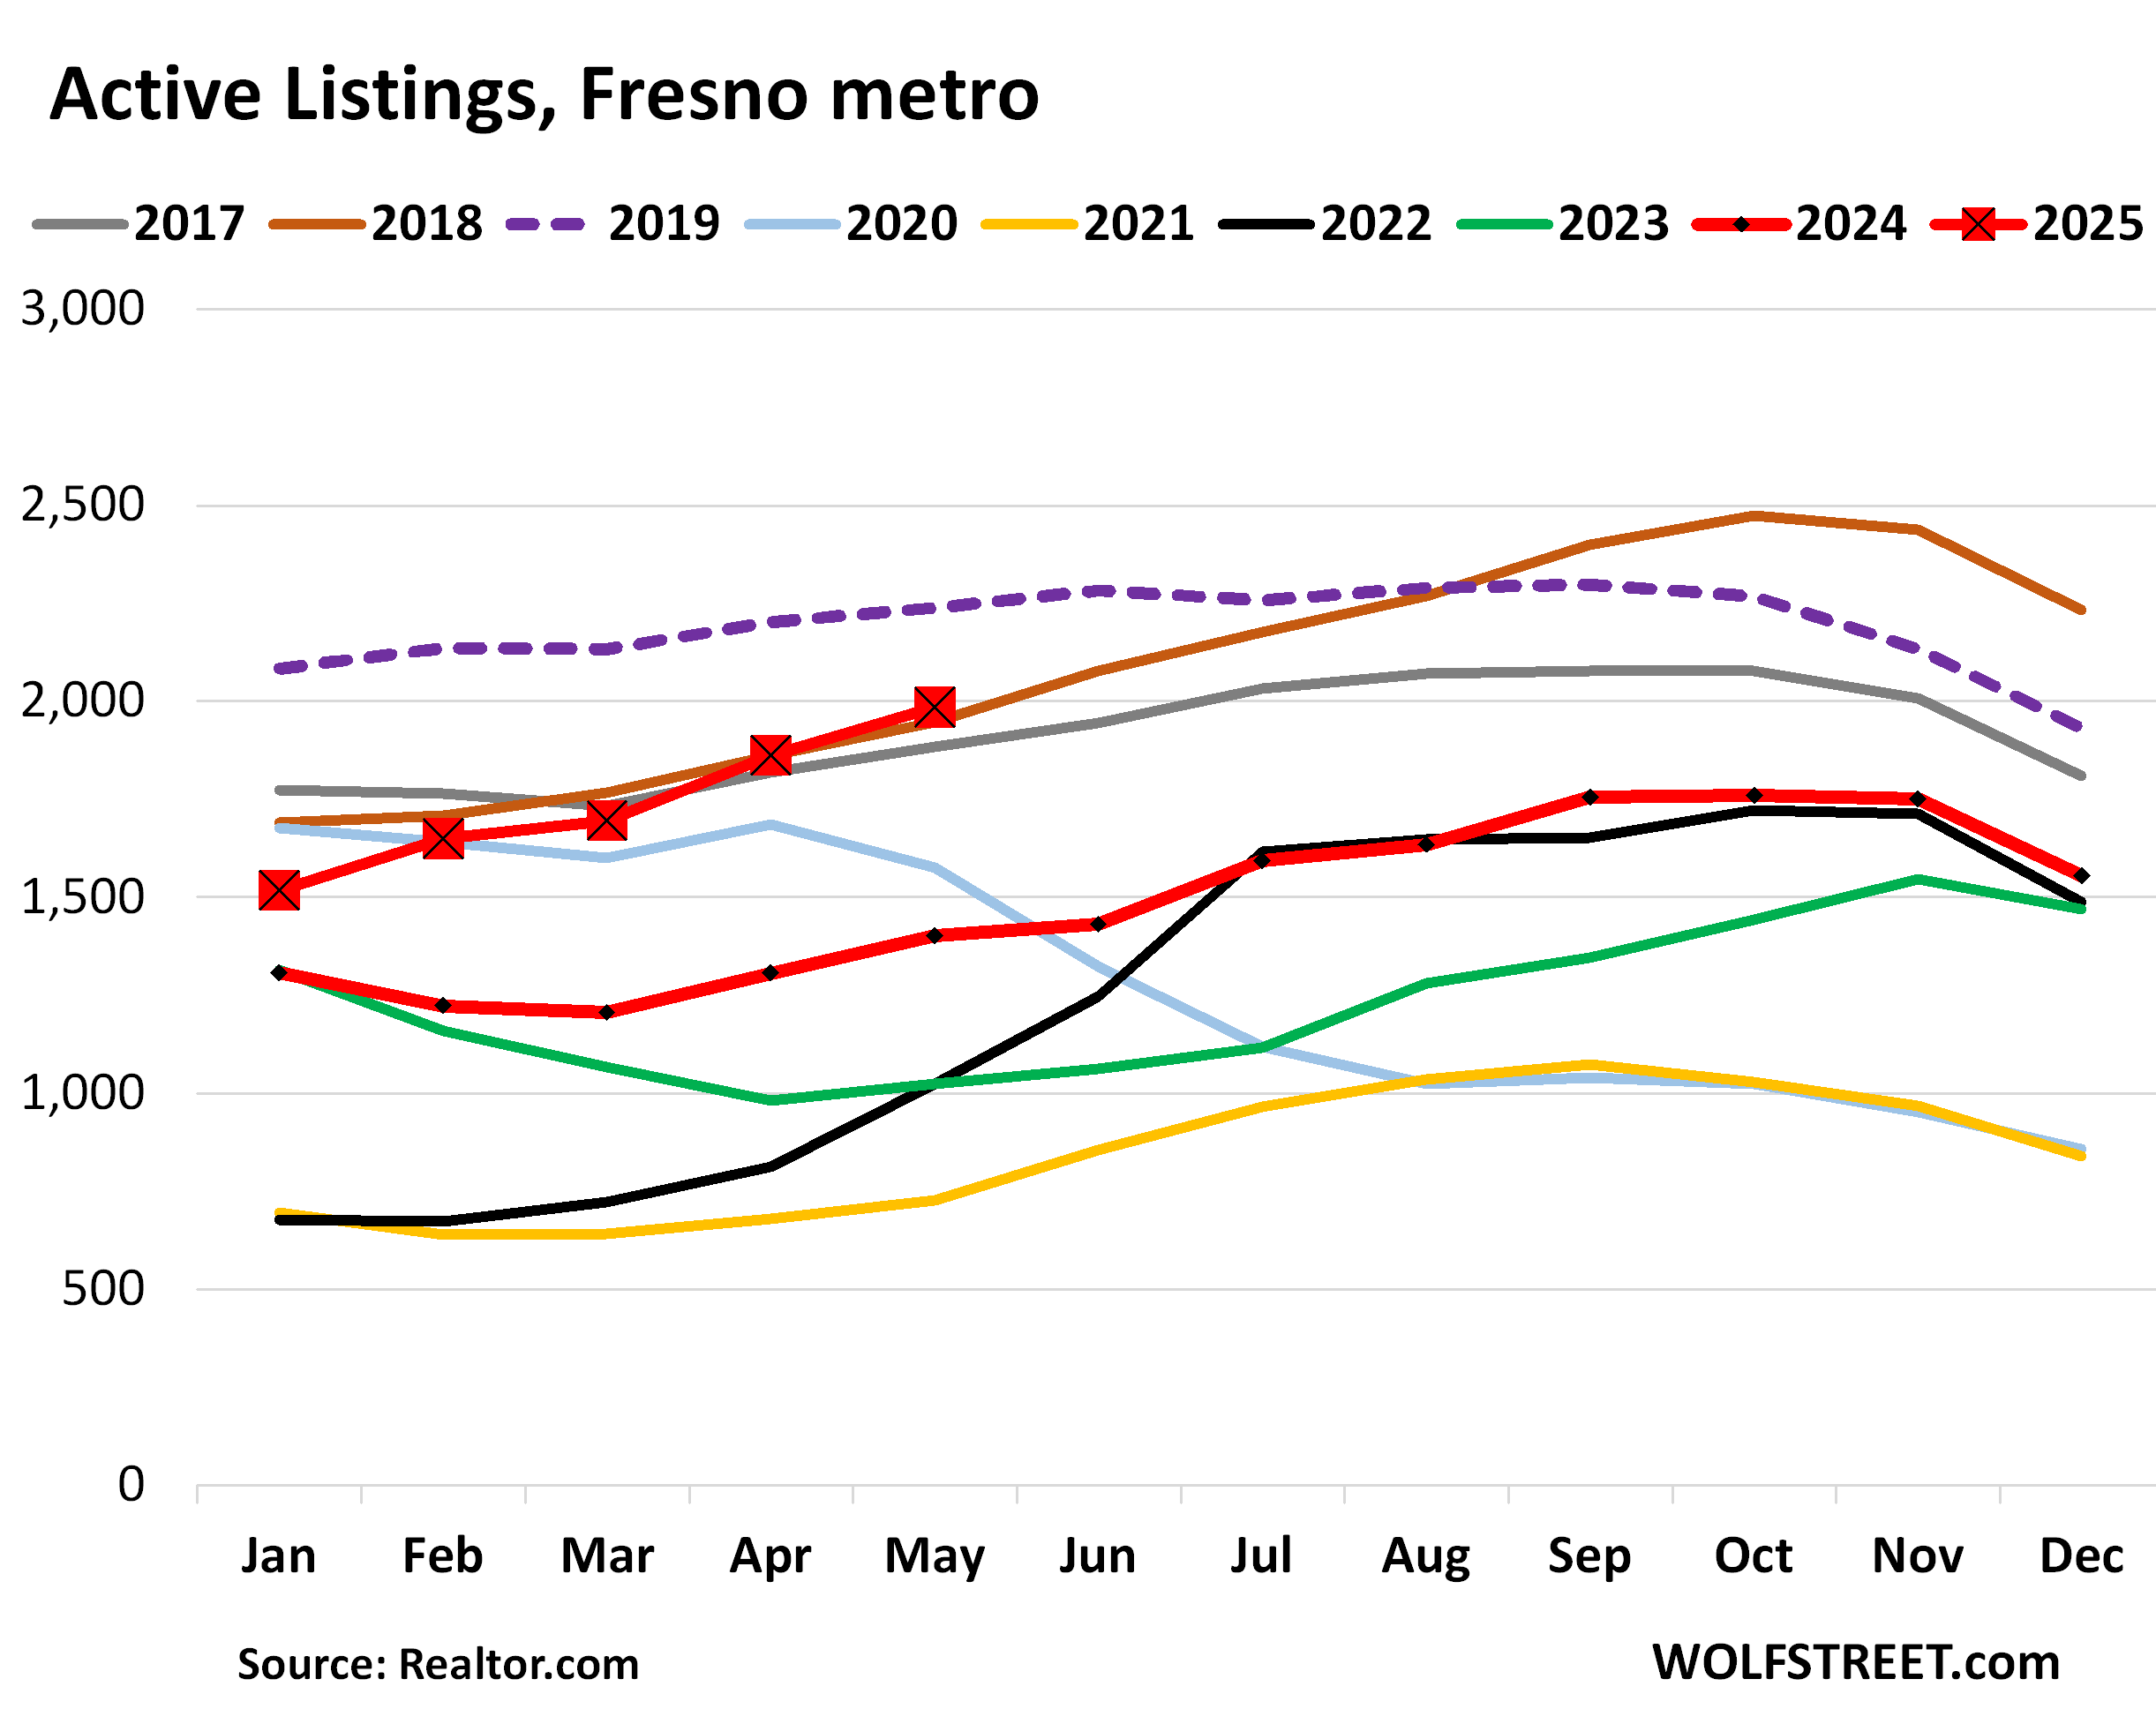
Fresno metro: Active listings spiked by 42% year-over-year to 1,984 homes for sale, the second-highest in the data going back to 2016:
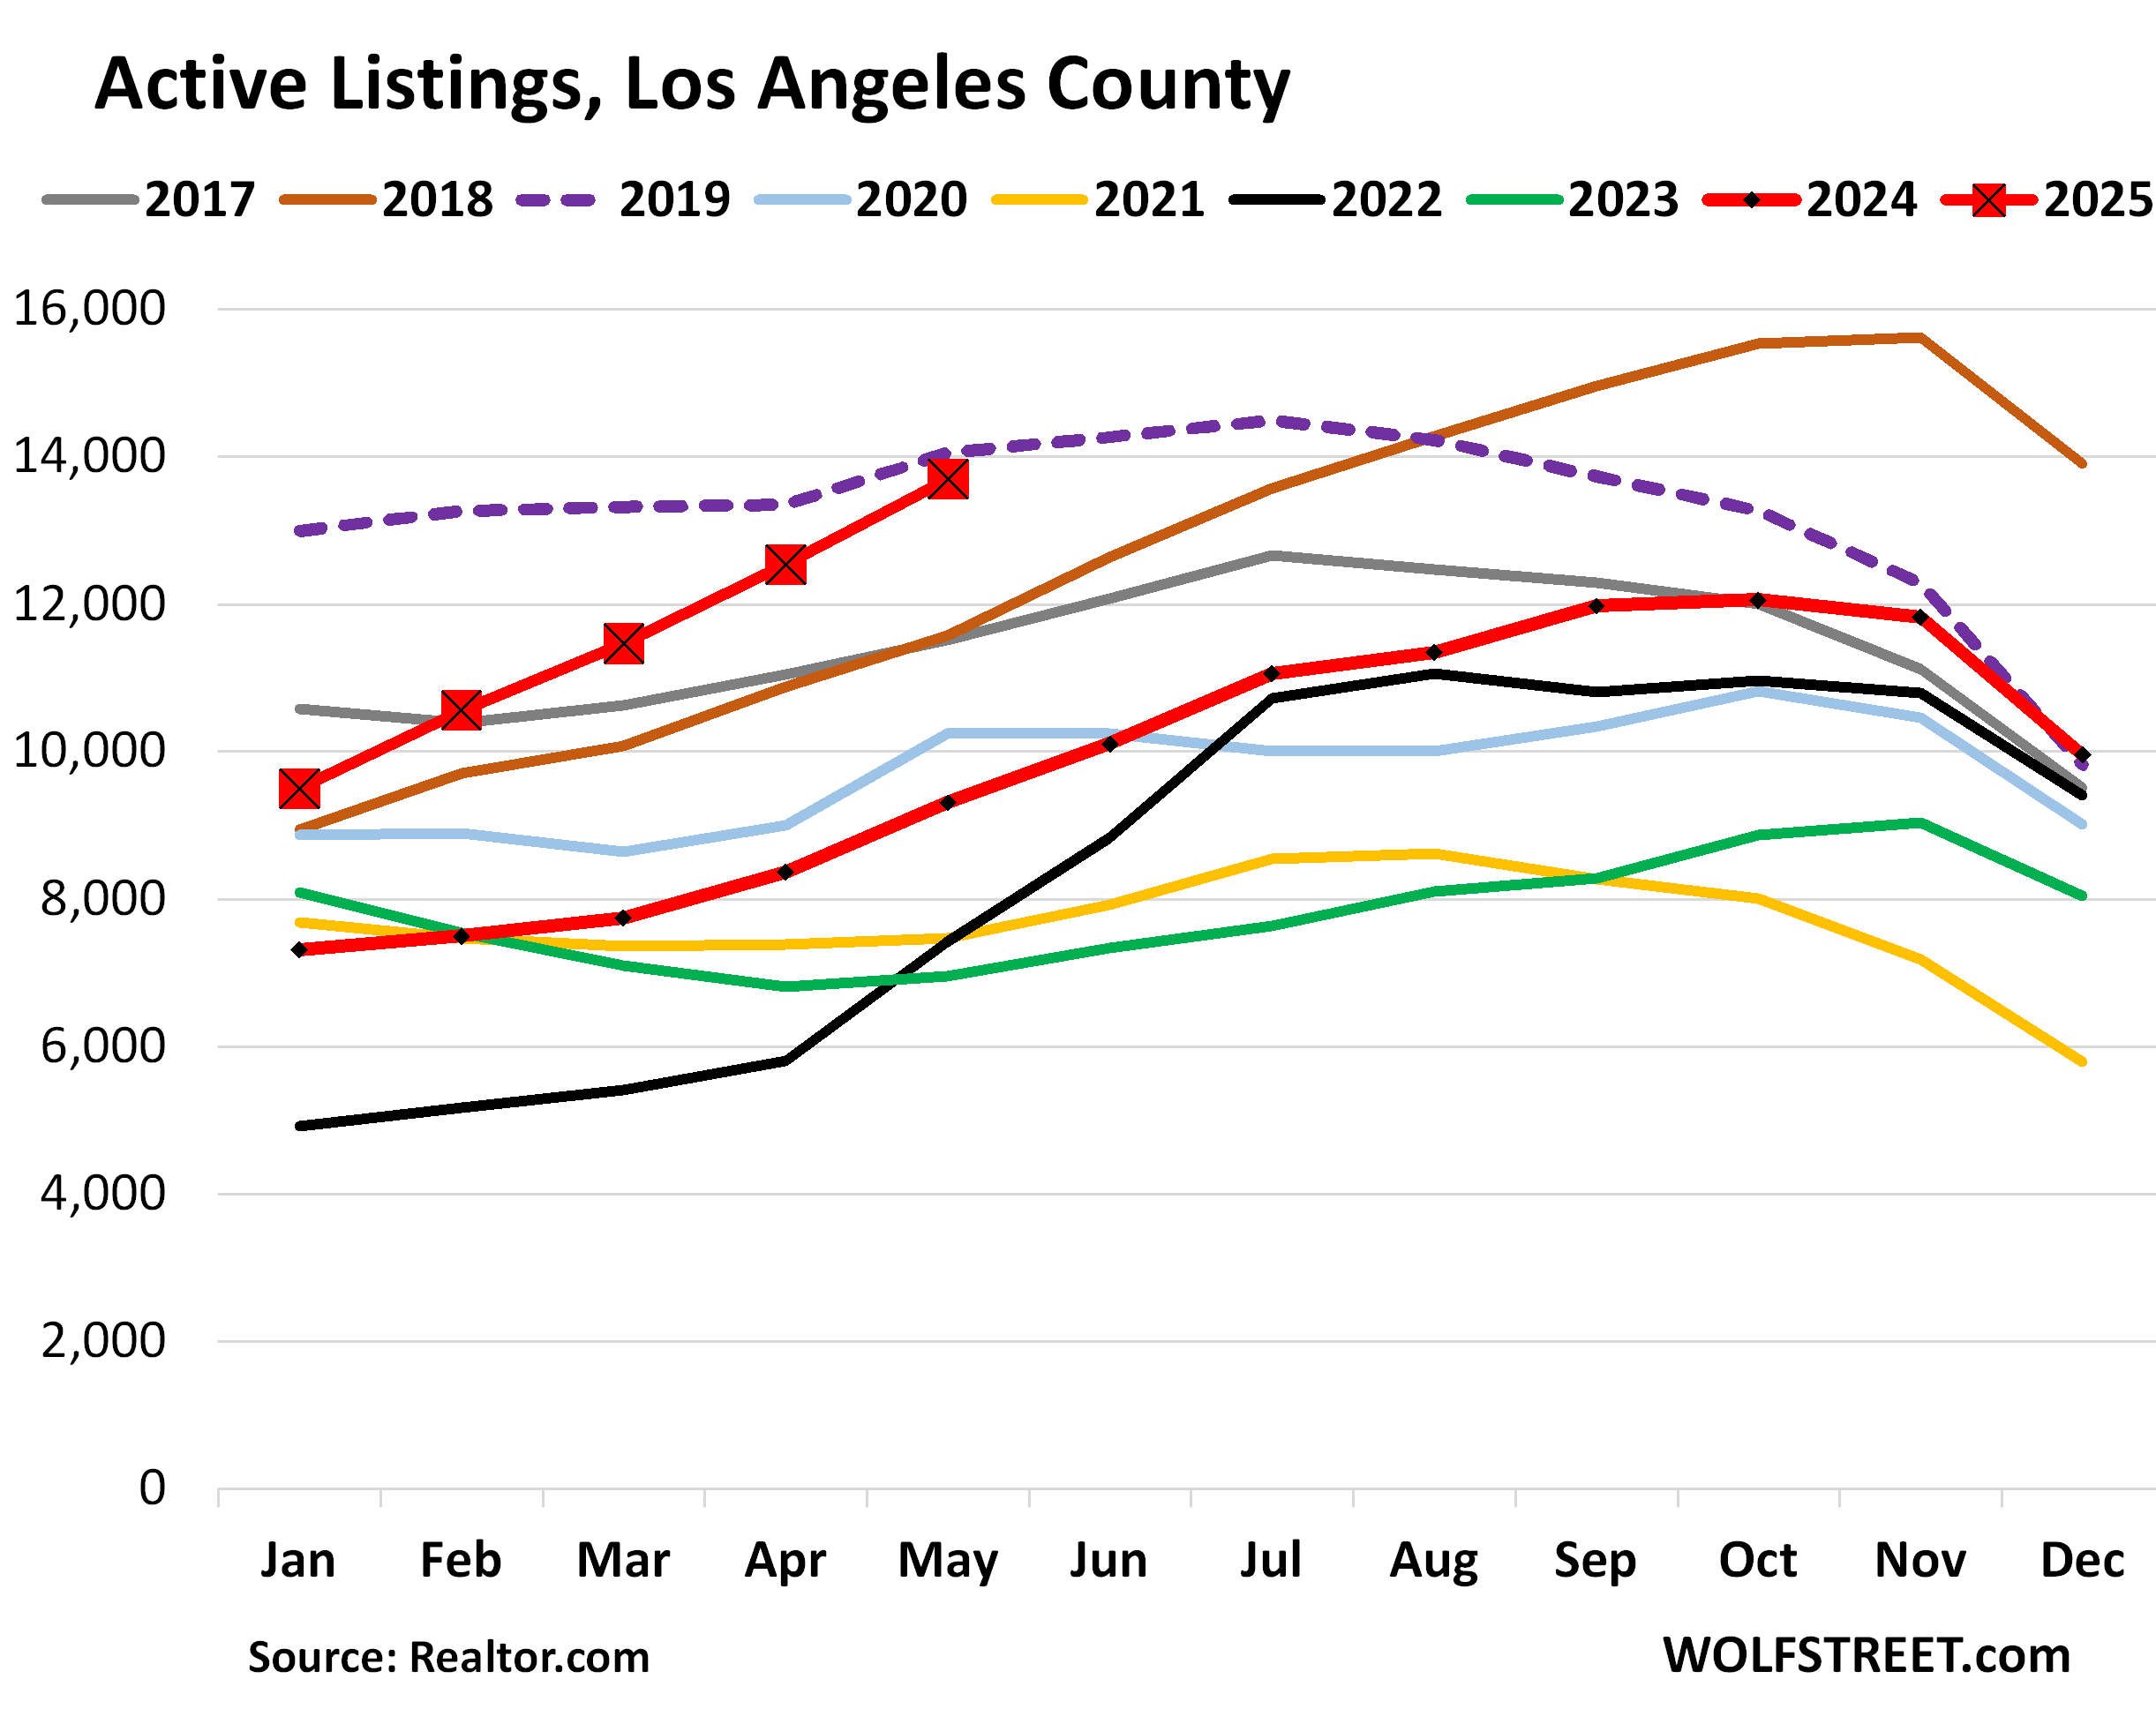
Los Angeles County: Active listings spiked by 47% year-over-year in May, to 13,695 homes for sale, the most for any May in the data from realtor.com going back to 2016, except 2019 (dotted purple line).
Back in January, listings were still 27% below those of January 2019. In May, the difference shrank to just 3%.
In the second half of 2018 (brown line), inventory ballooned as mortgage rates hit 5%, and this continued into 2019. That’s the inventory level that 2025 is setting up to blow by.
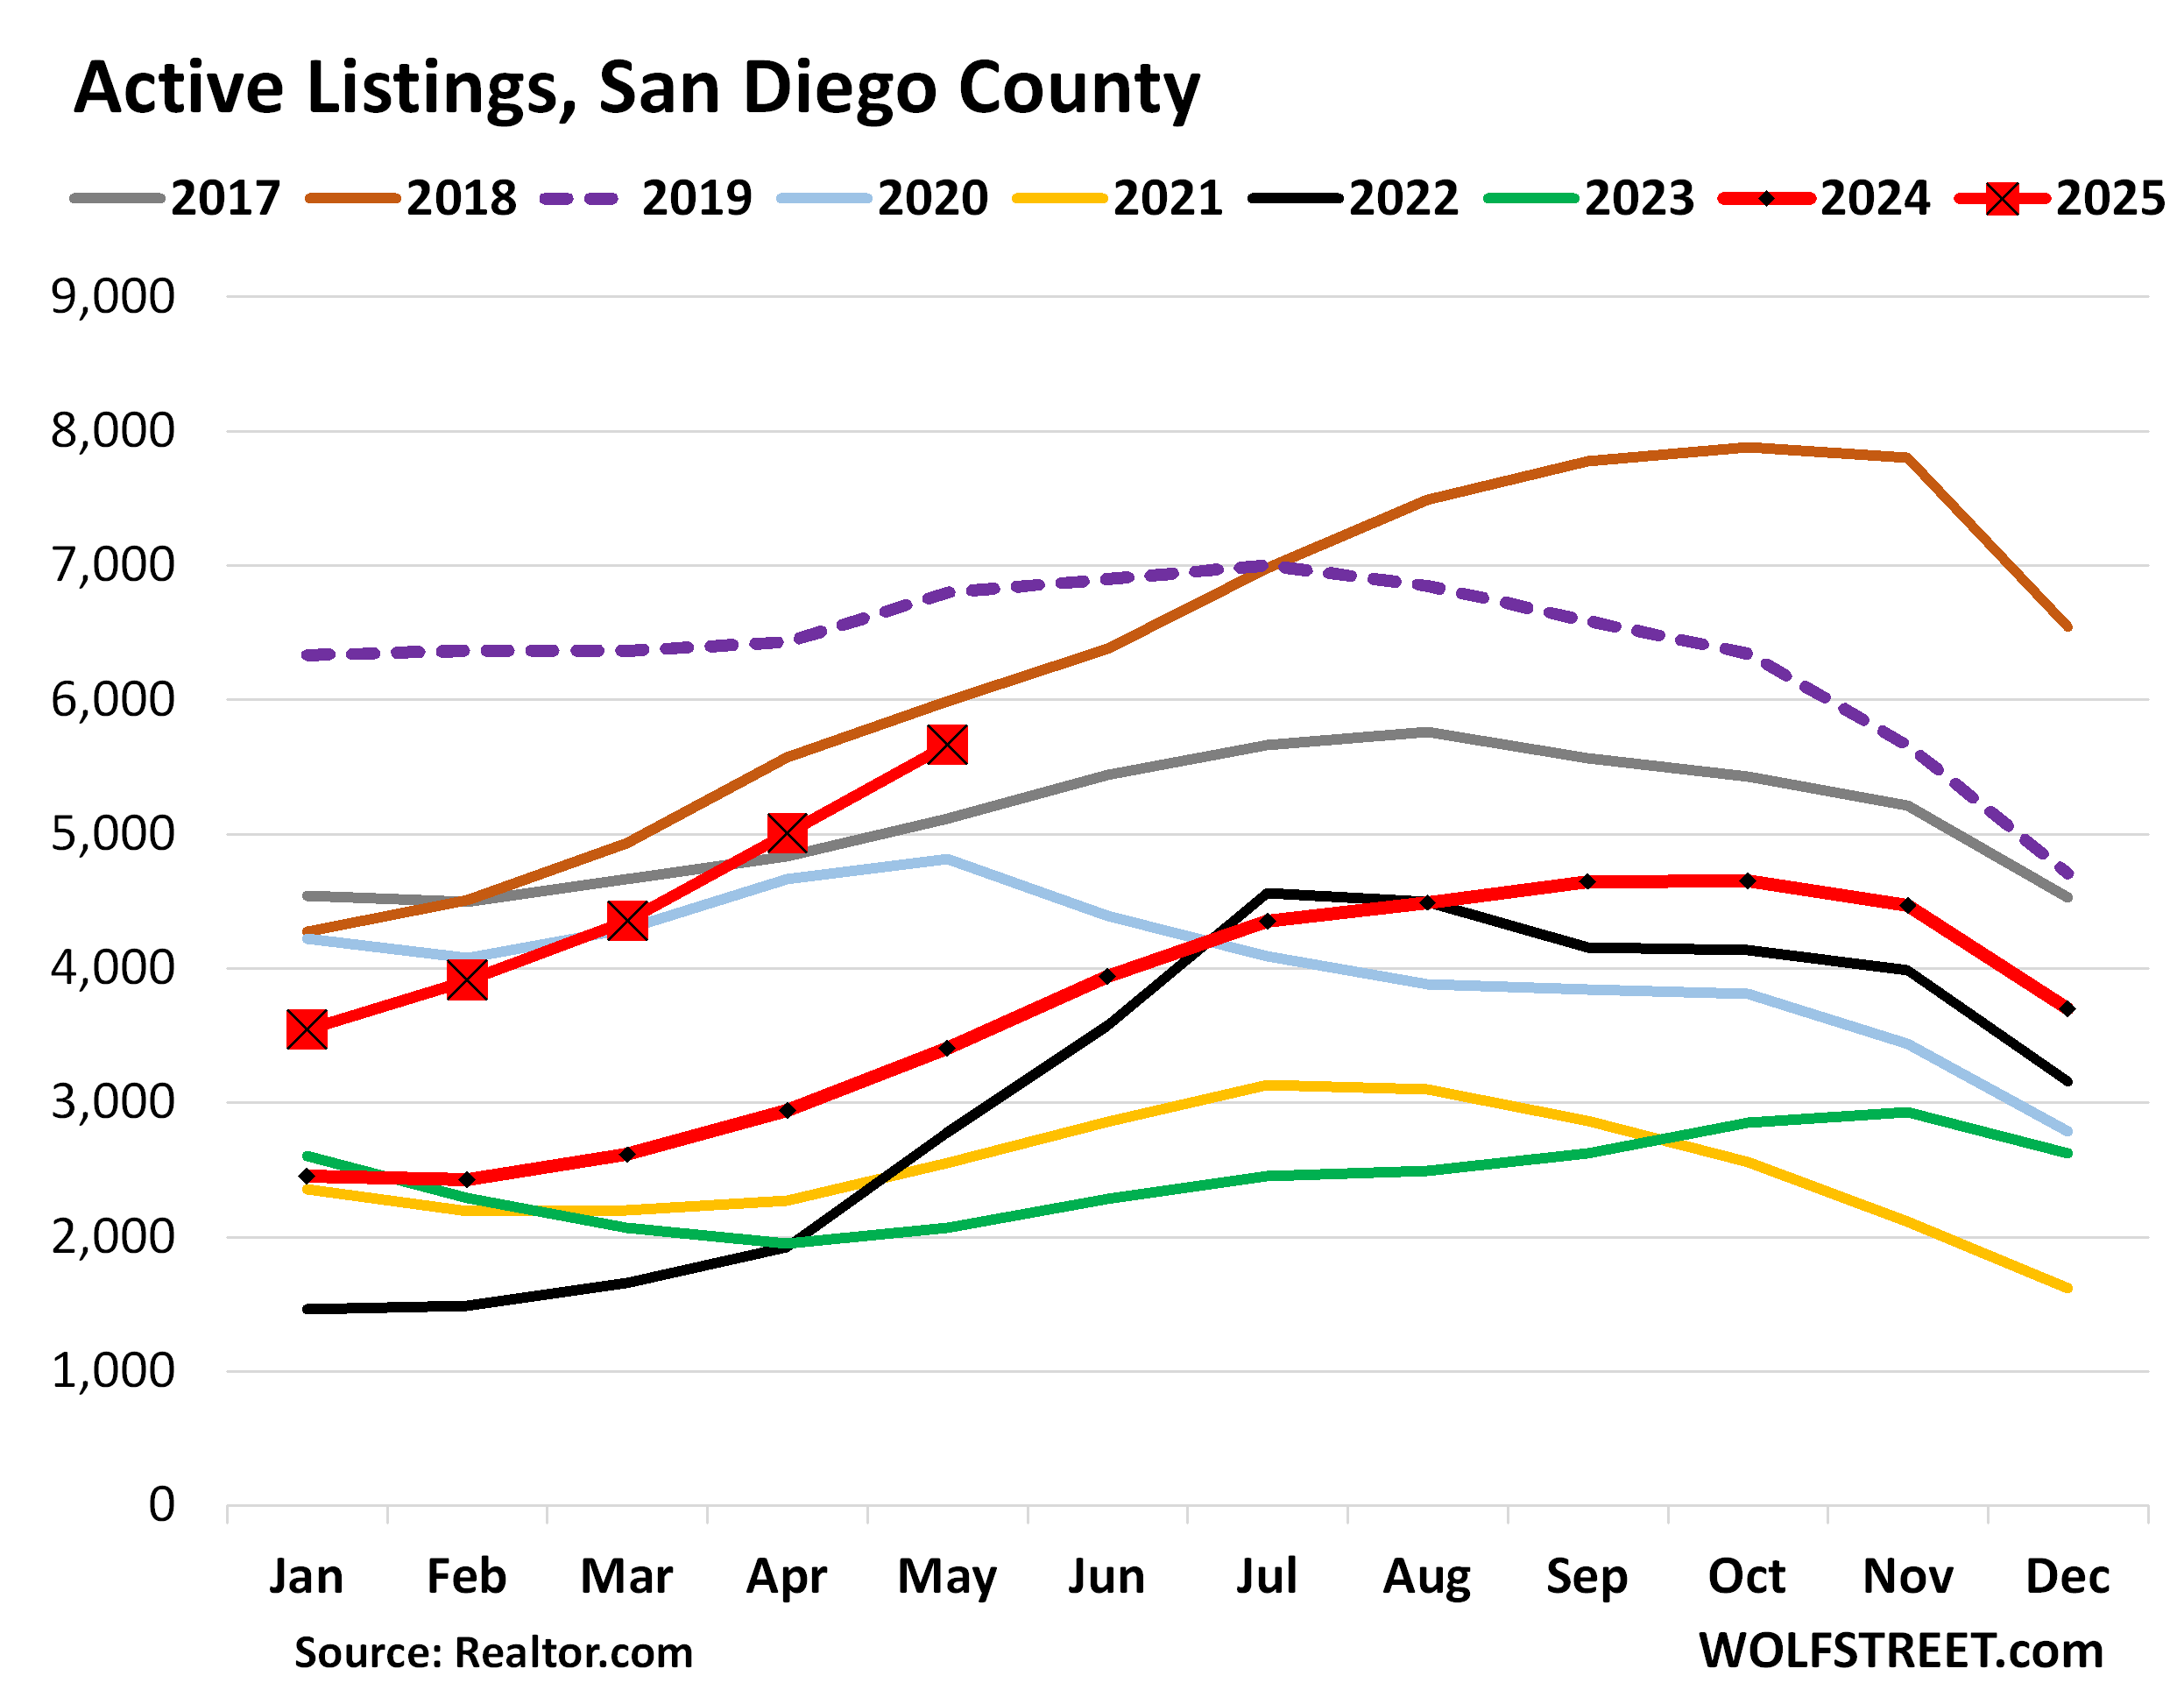
San Diego County: Active listings spiked by 66% year-over-year, to 5,664 homes for sale, the highest for any May since 2019 (dotted purple line) and 2018 (brown line) in the data going back to 2016.
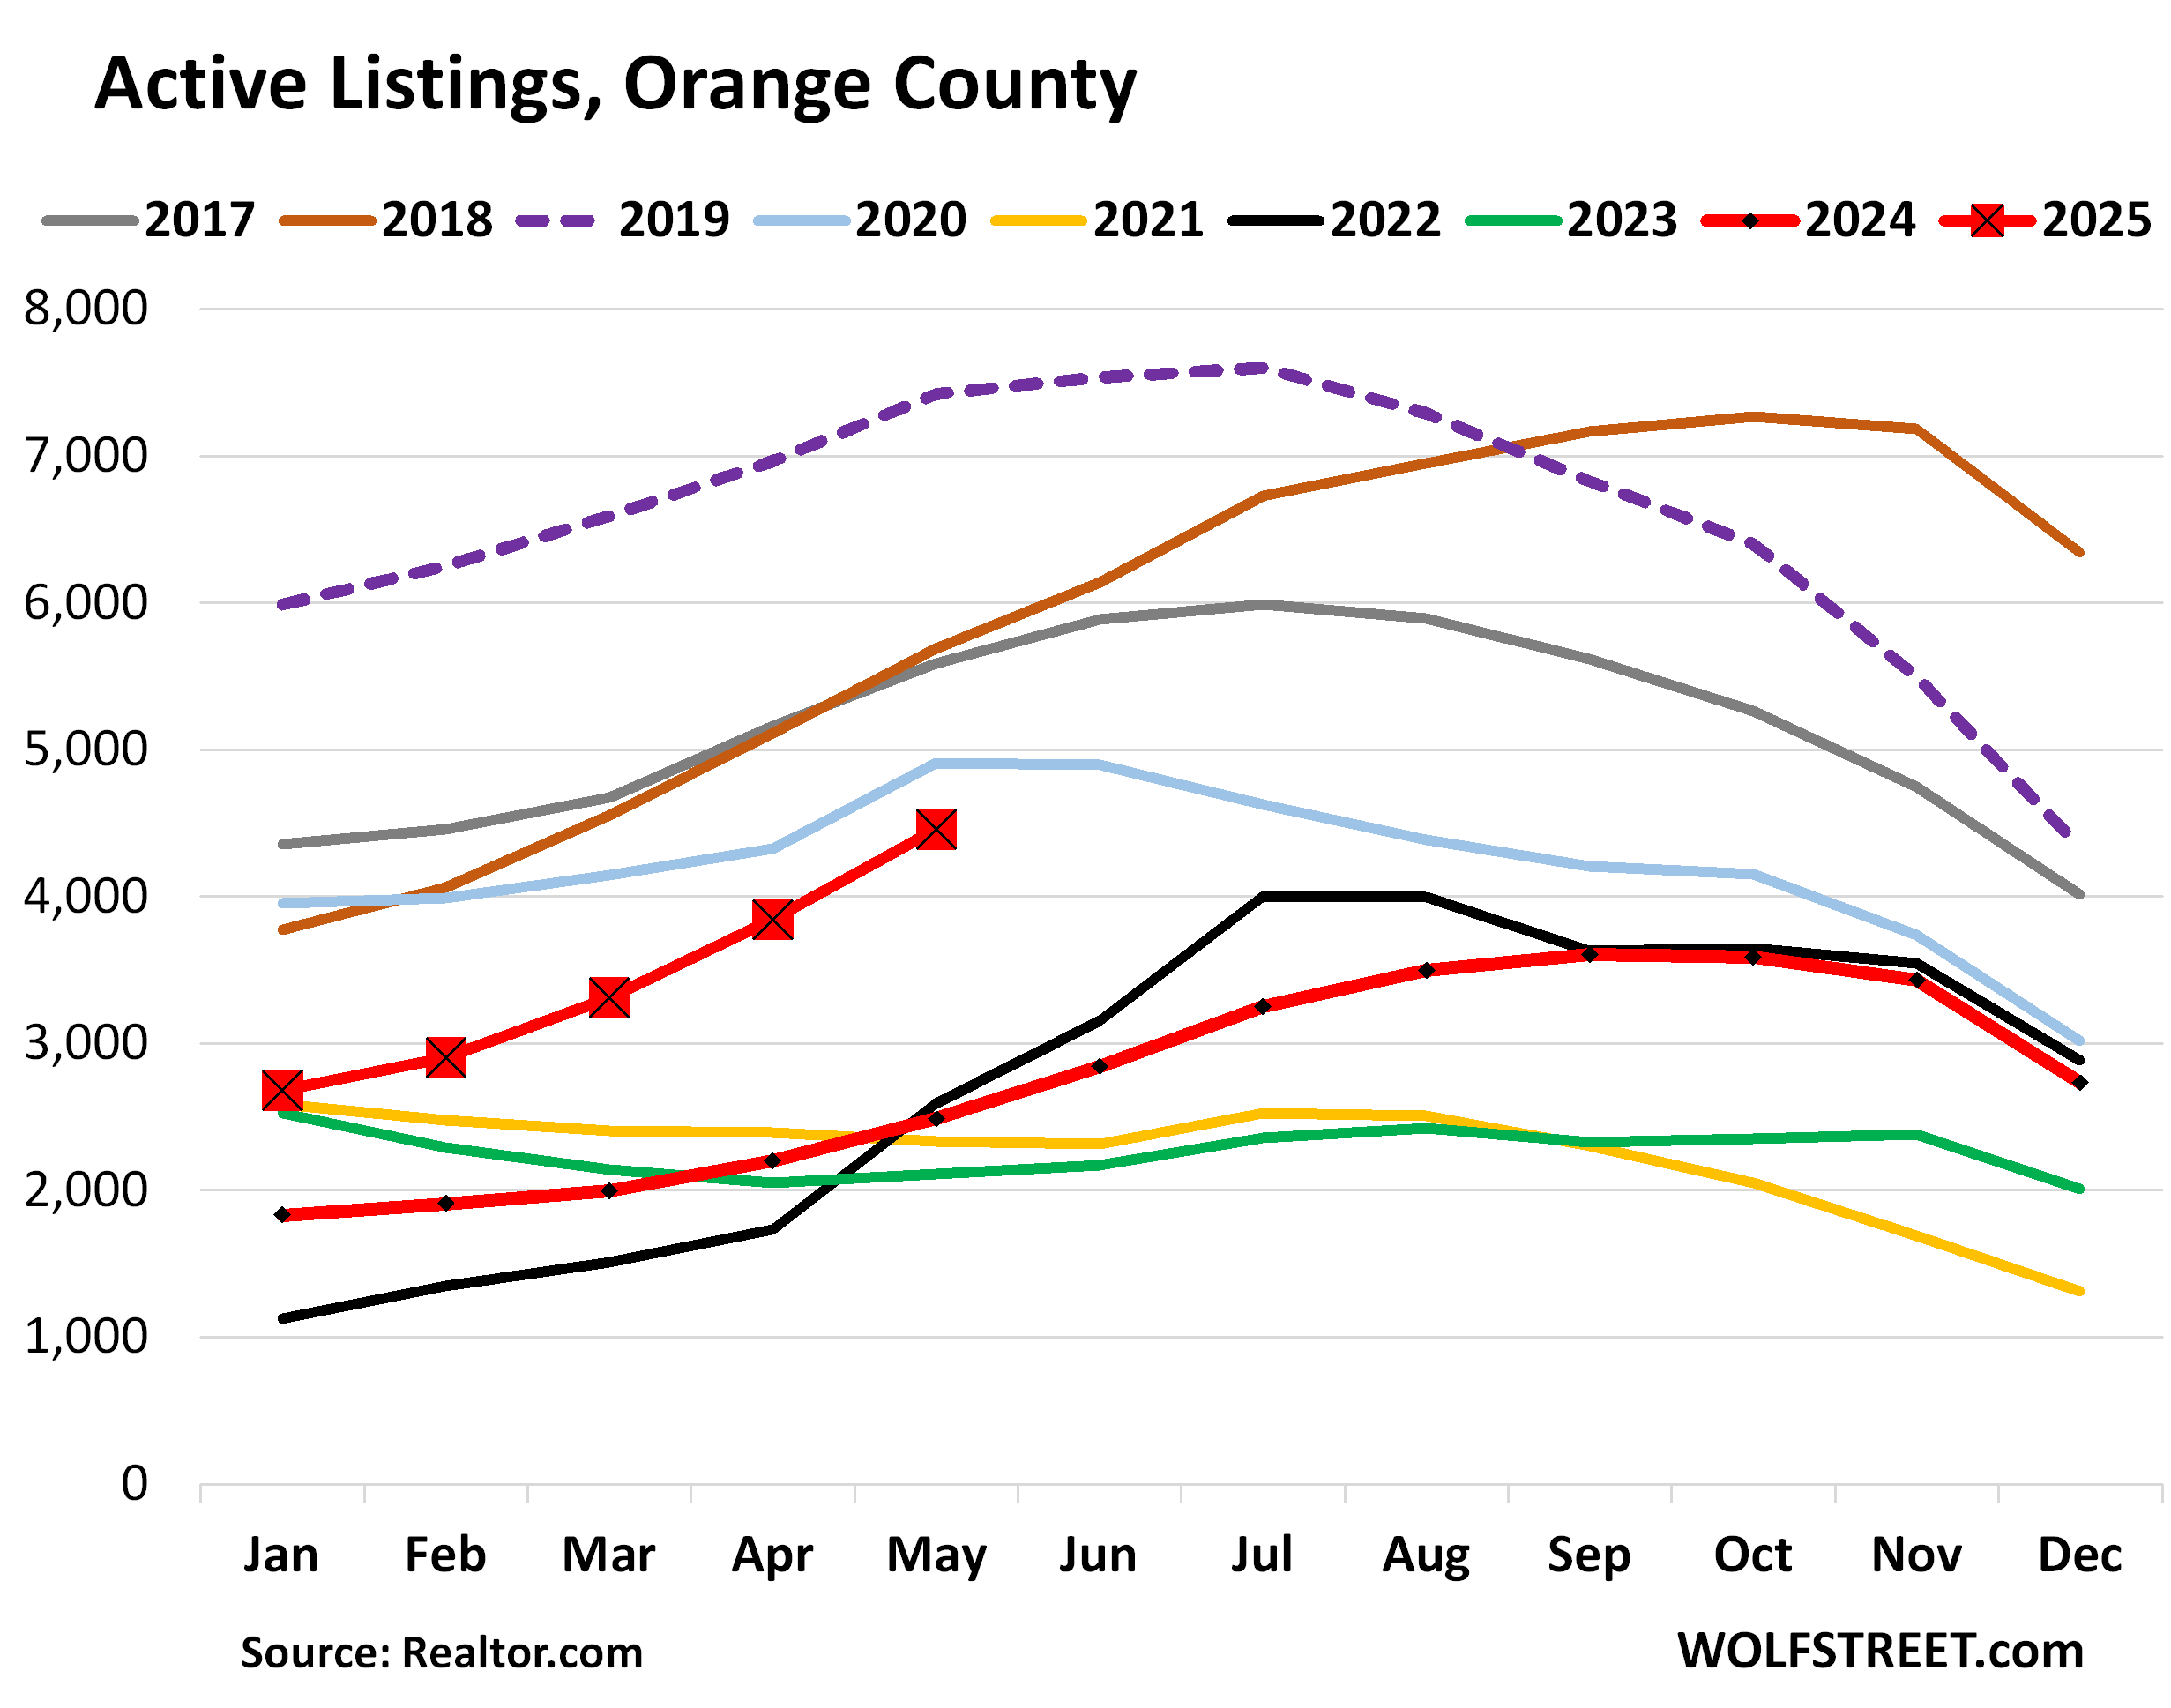
Orange County: Active listings spiked by 79% year-over-year in May, to 4,457 homes. Inventory got a late start taking off and was still very low in 2024, but it’s now catching up with a vengeance.
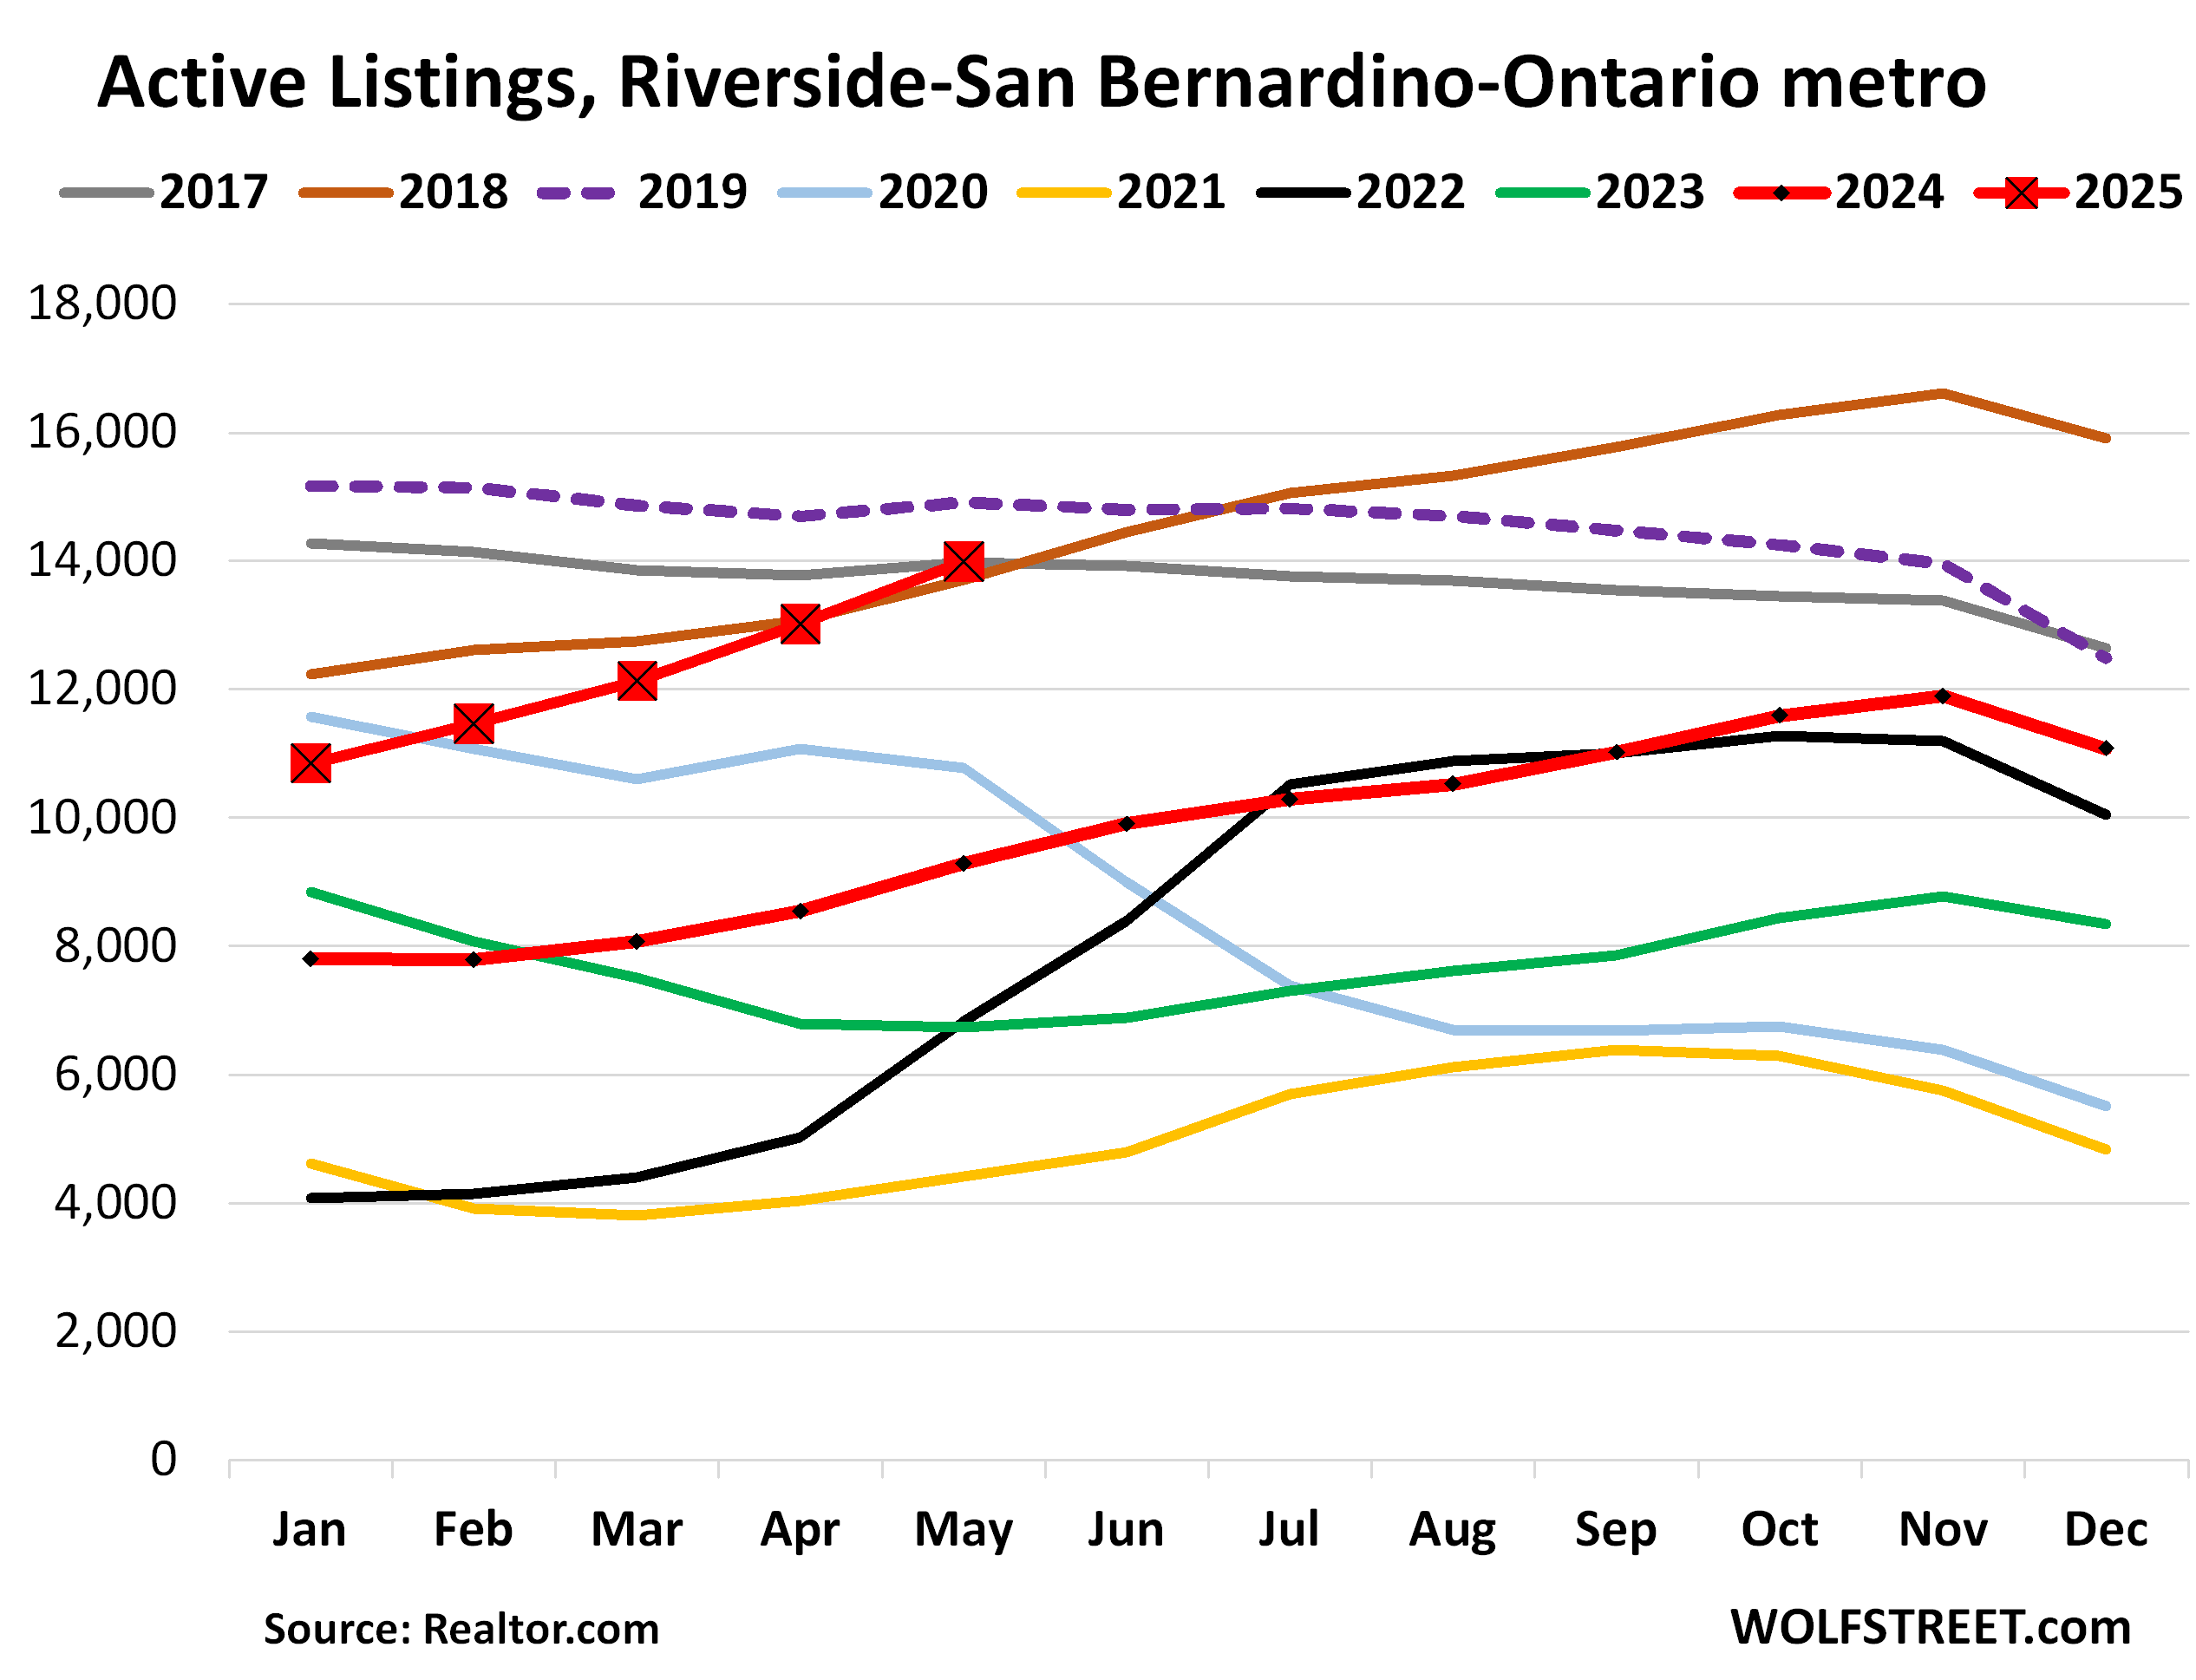
Riverside-San Bernardino-Ontario metro: Active listings spiked by 51% year-over-year, to 13,985 homes, the second highest May in the data going back to 2016, behind only May 2019 (dotted purple line).
State of California: Active listings spiked by 51% year-over-year, to 73,160 homes for sale, the highest for any May in the data going back to 2016, except 2019 (dotted purple line).
In January, active listings had still been 31% below January 2019. By May the gap was down to 8%. That’s how fast this is changing.
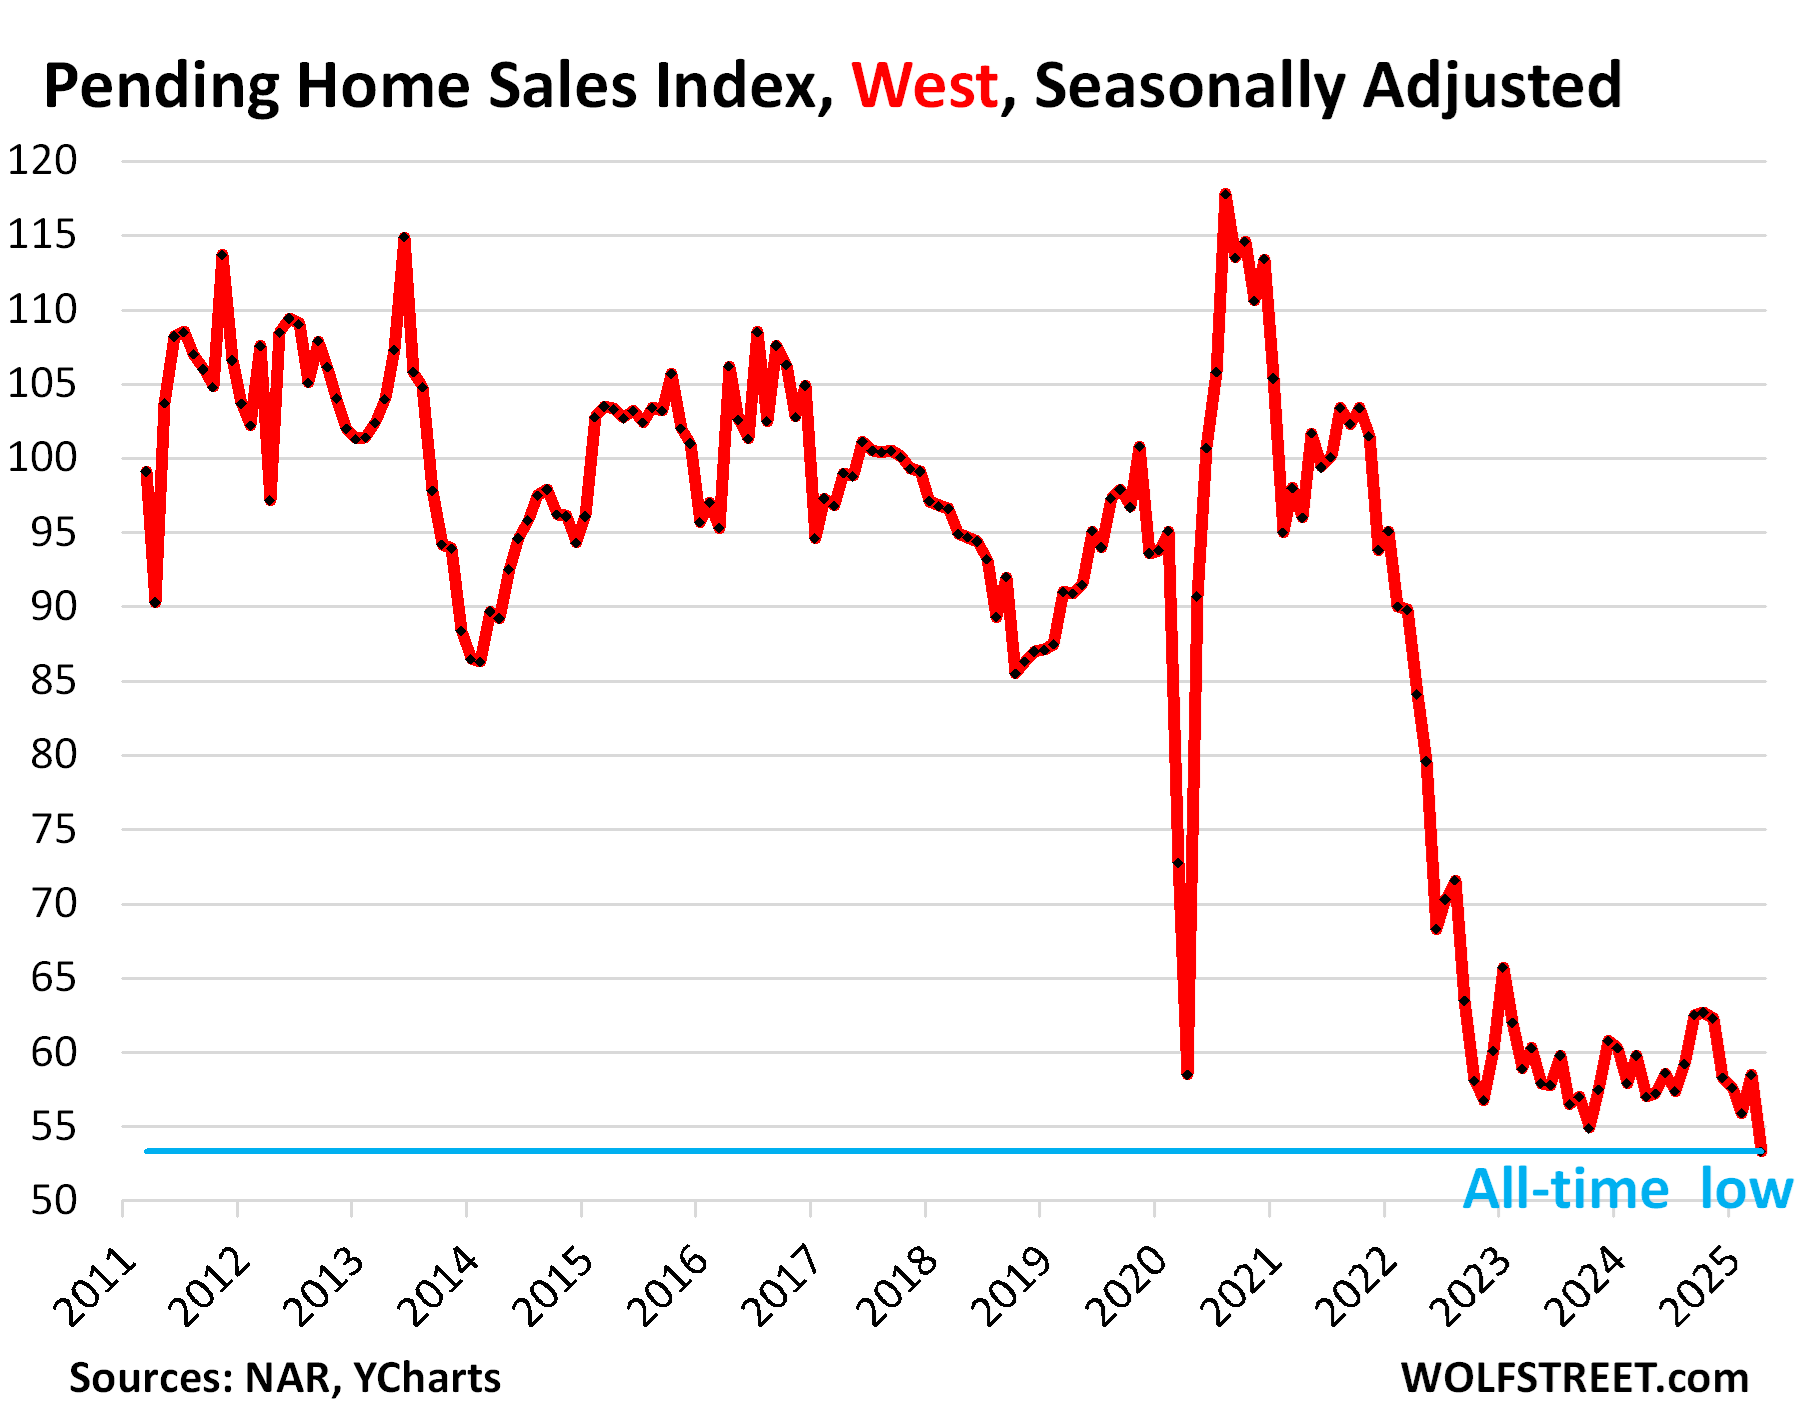
The problem is that demand has essentially collapsed. Pending sales of existing homes in the West, a vast region dominated by California, plunged by 8.9% in April from March to the lowest sales rate since at least 2011, the extent of the data from the National Association of Realtors, and were down by 41% from 2019 [read: Pending Home Sales Plunge in All Regions, Inventories Surge. In the West & South, Collapsed Sales Meet Spiking Inventories].
Demand collapsed because prices have spiked to unsustainable levels, driven by reckless monetary policies. Now demand destruction on a massive scale has set in, a fundamental economic principle. Demand destruction caused by high prices has a functional solution: Rolling back the price spikes. Sellers will be able to sell just fine by pricing their home down there where demand emerges.
Enjoy reading WOLF STREET and want to support it? You can donate. I appreciate it immensely. Click on the mug to find out how:

![]()
The post Inventory of Homes for Sale in Biggest California Markets Suddenly Piles Up to Highest in Years: Demand Has Collapsed appeared first on Energy News Beat.