Energy News Beat
Frozen sales meet ballooning inventories.
By Wolf Richter for WOLF STREET.
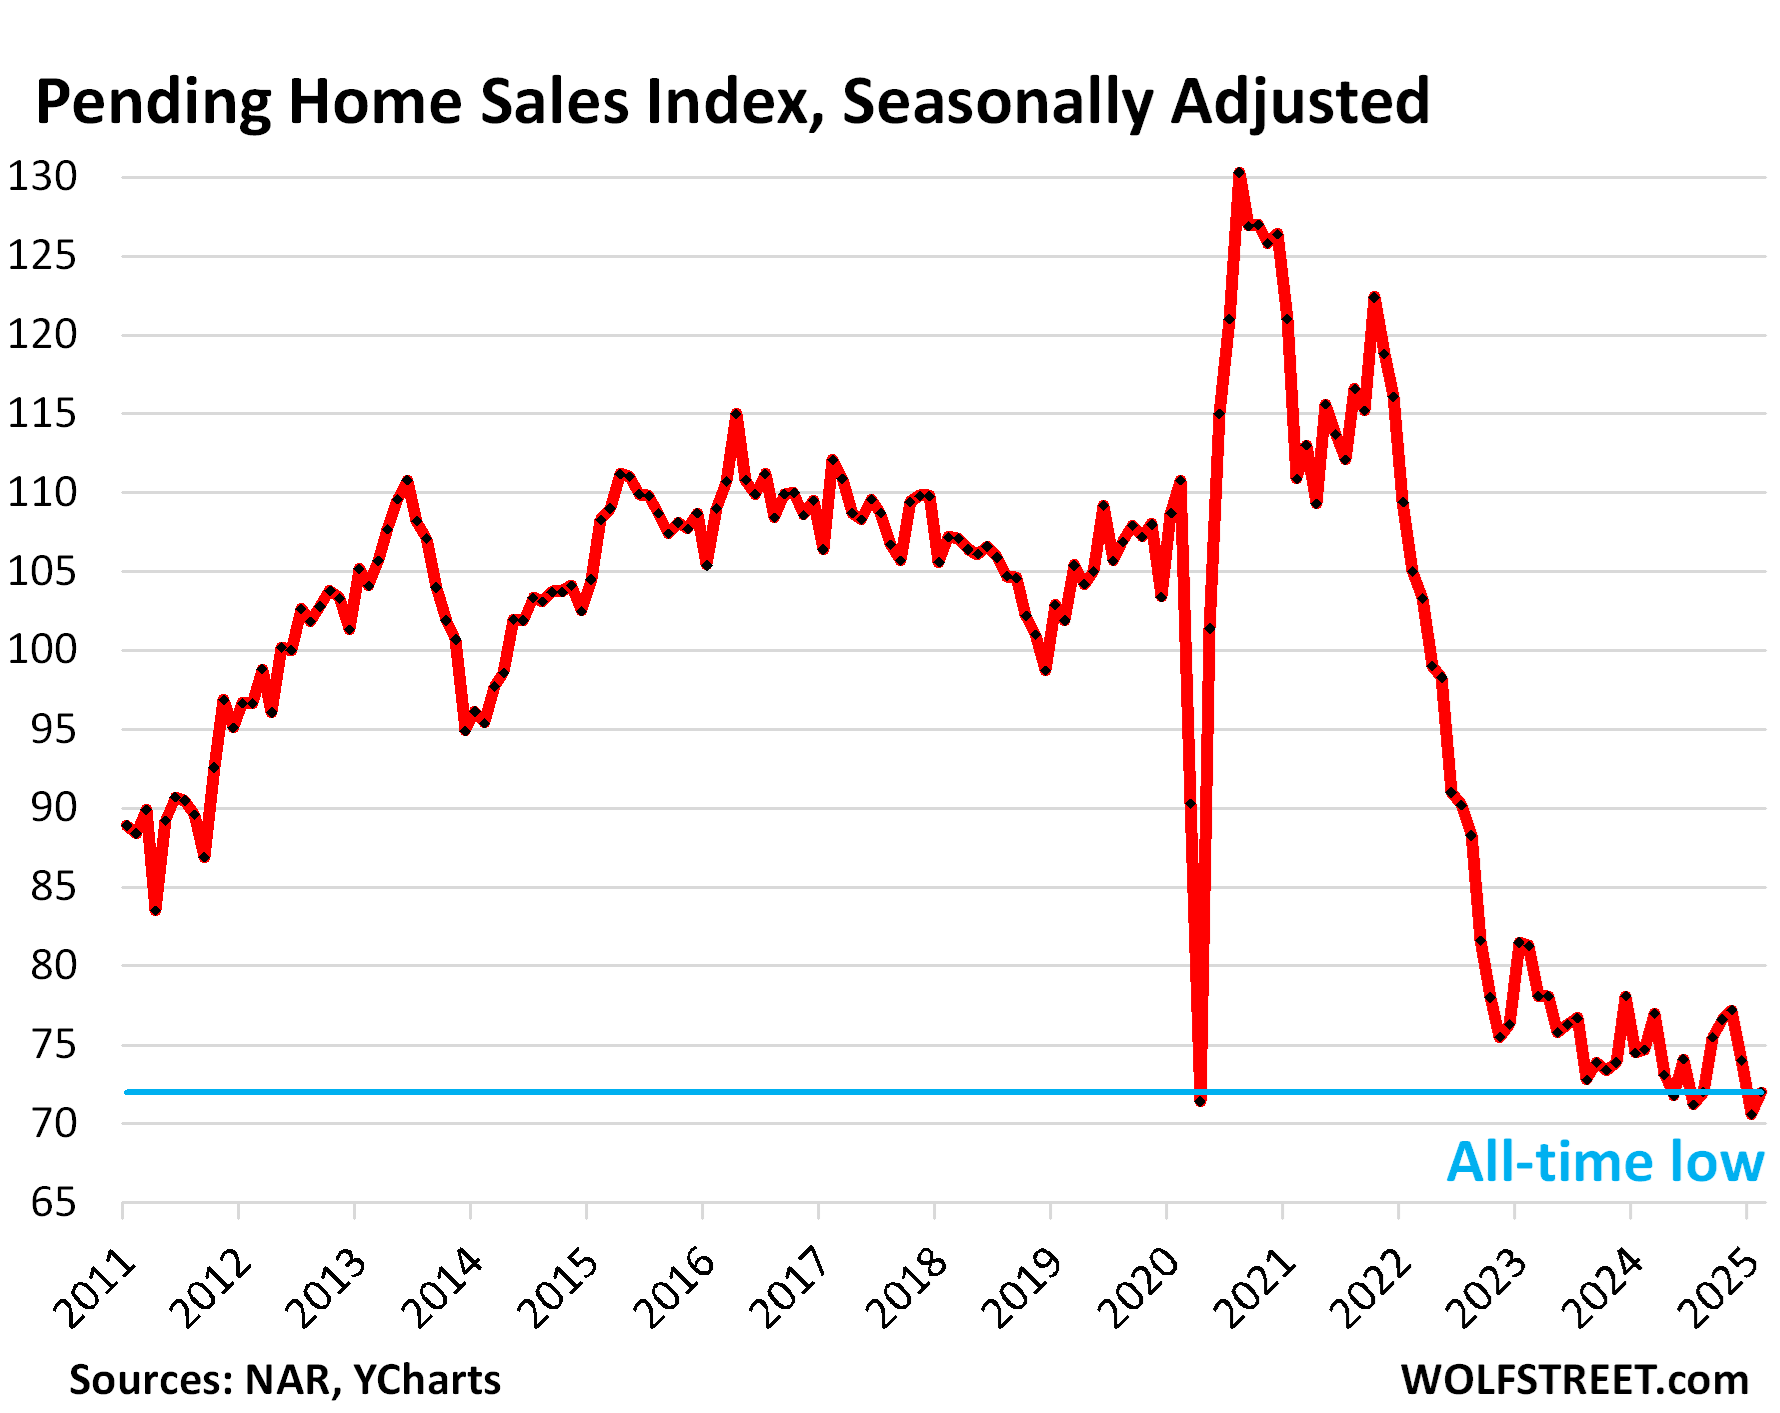
Pending home sales are a forward-looking indicator of “closed sales” of existing homes to be reported over the next couple of months. From the National Association of Realtors today, seasonally adjusted:
- In the West, pending home sales dropped further, marking the worst February in the data going back to 2011, and just above the all-time low of October 2023.
- In the South, pending sales in February rose from the all-time low in January and mark worst February on record.
- In the Northeast, pending sales dipped further, mark worst February on record.
- In the Midwest, pending sales ticked up a hair, mark worst February on record.
So overall US pending home sales ticked up a hair from the record low in January, and also marked the worst February in the data, seasonally adjusted. They’ve been hobbling along the bottom for over two years, pounded down by too-high prices that don’t work at all with the current mortgage rates. Compared to the Februarys in prior years (historic data via YCharts):
- 2024: -3.6%
- 2023: -11.4%
- 2022: -31.4%%
- 2021: -35.1%
- 2020: -35.0%
- 2019: -29.3%.
“Considering the Federal Reserve’s recent forecast for slower economic growth, we expect mortgage rates to slide moderately lower,” the NAR said in the report.
“But the current high national debt will prevent mortgage rates from falling drastically – and certainly not to the 4%-to-5% range seen during President Trump’s first term,” the report said.
Even the NAR has given up hopes for low mortgage rates to bail out the housing market.
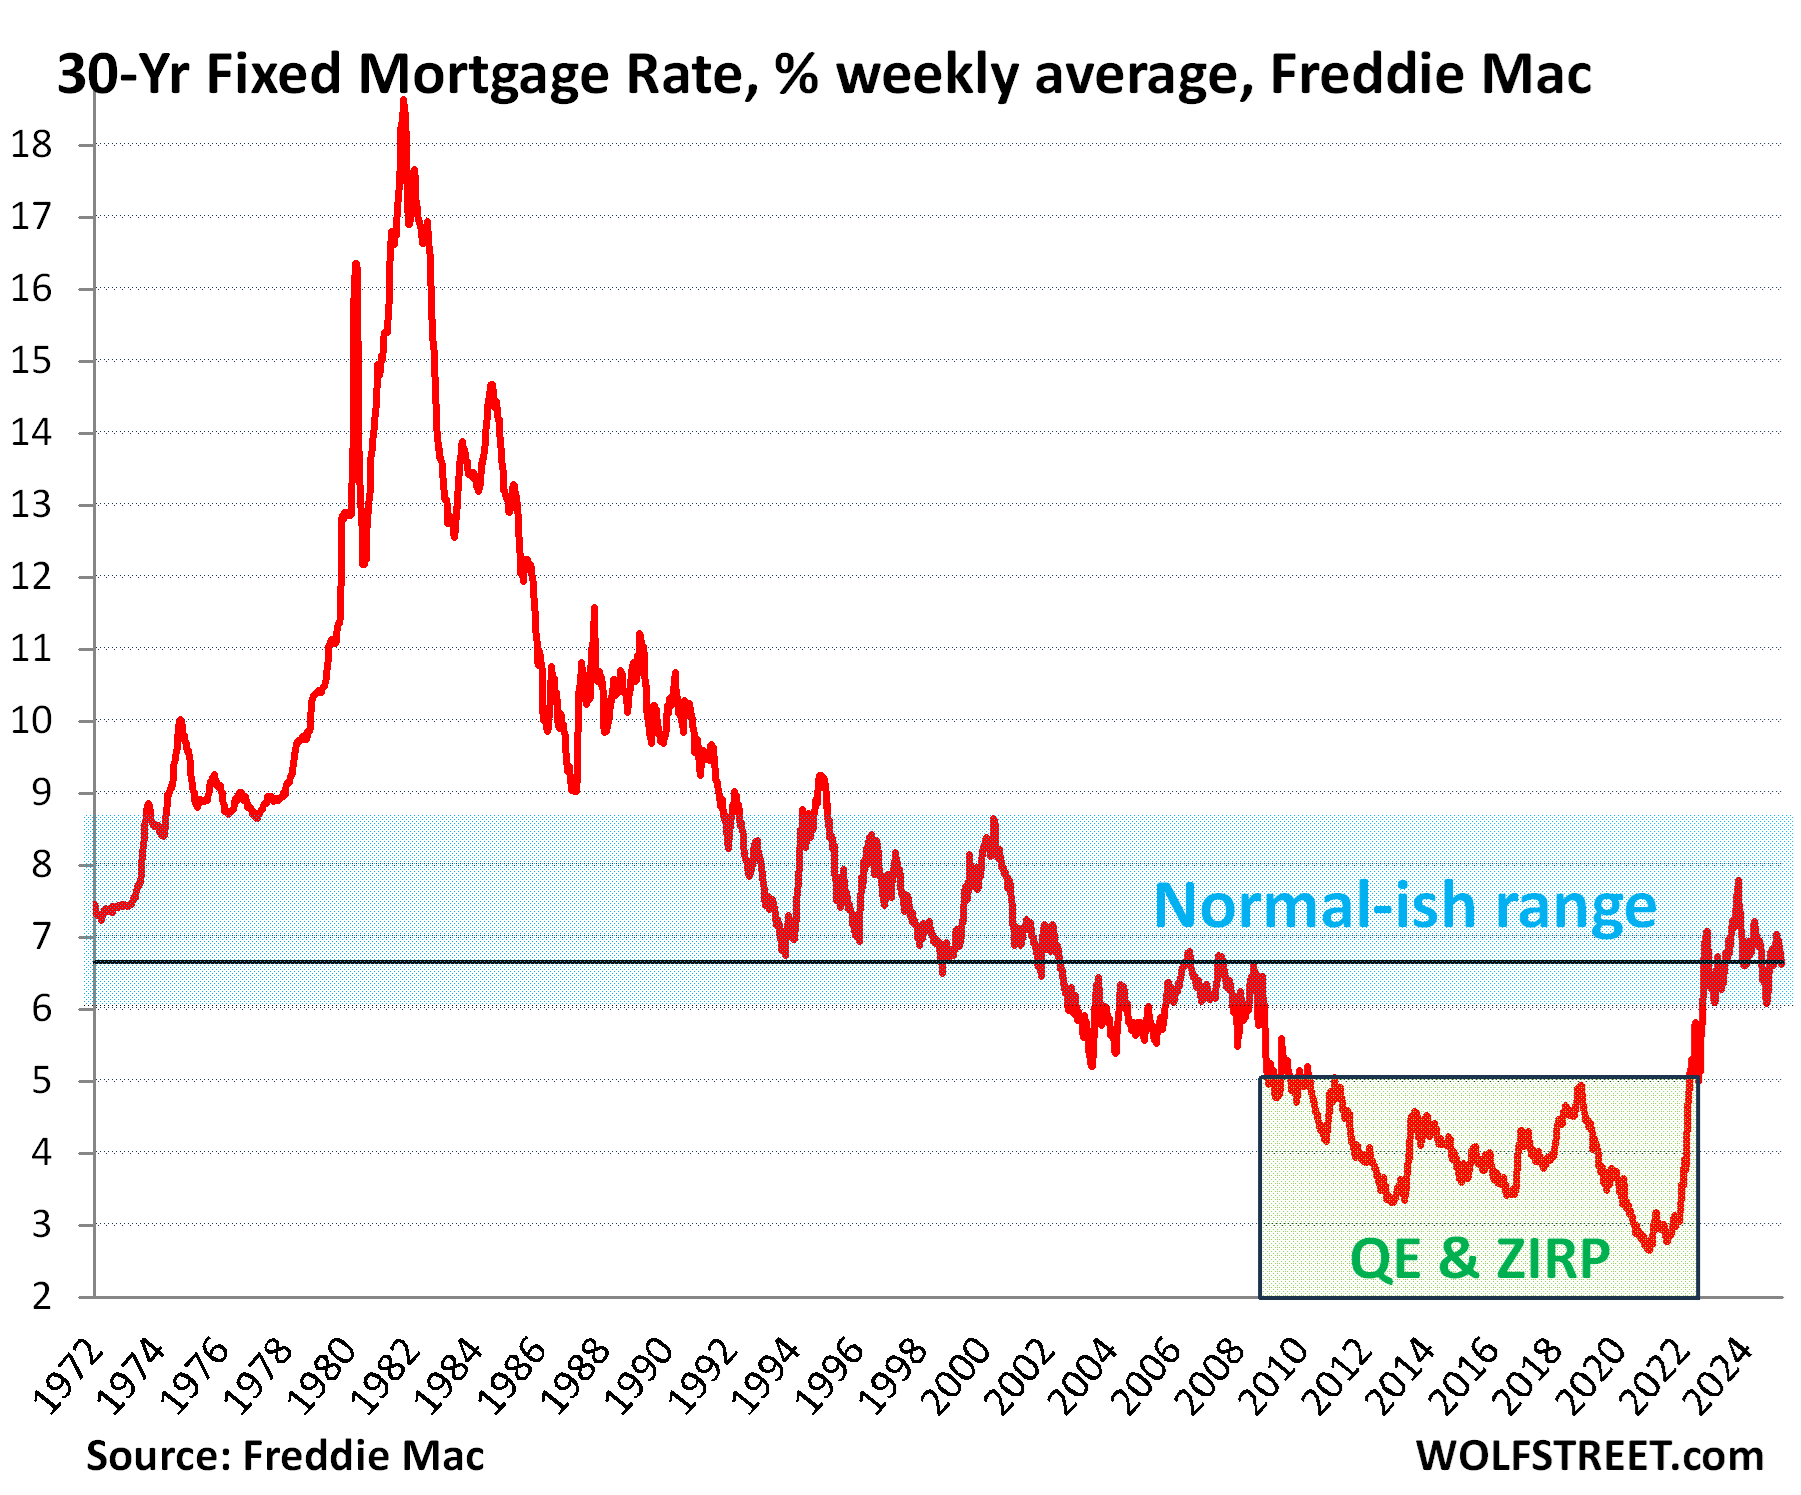
The average 30-year fixed mortgage rate was 6.5% in the latest reporting week, and has been around 6.5% for four weeks, according to Freddie Mac today. It has been above 6% since September 2022.
Below-5% mortgage rates were brought about by QE and very low inflation. Now there’s the rebirth of the inflationary era, with higher interest rates to compensate lenders for higher inflation; and what NAR pointed out, there’s the huge national debt putting upward pressure on long-term rates, including mortgage rates.
Pending sales are based on contract signings and track deals that haven’t closed yet and could still fall apart or get canceled, for all kinds of reasons, such as buyers being unable to afford or even get homeowner’s insurance, or financing falling through. Signed contracts that eventually fall apart are included in pending sales, but not in the figures of closed sales reported later.
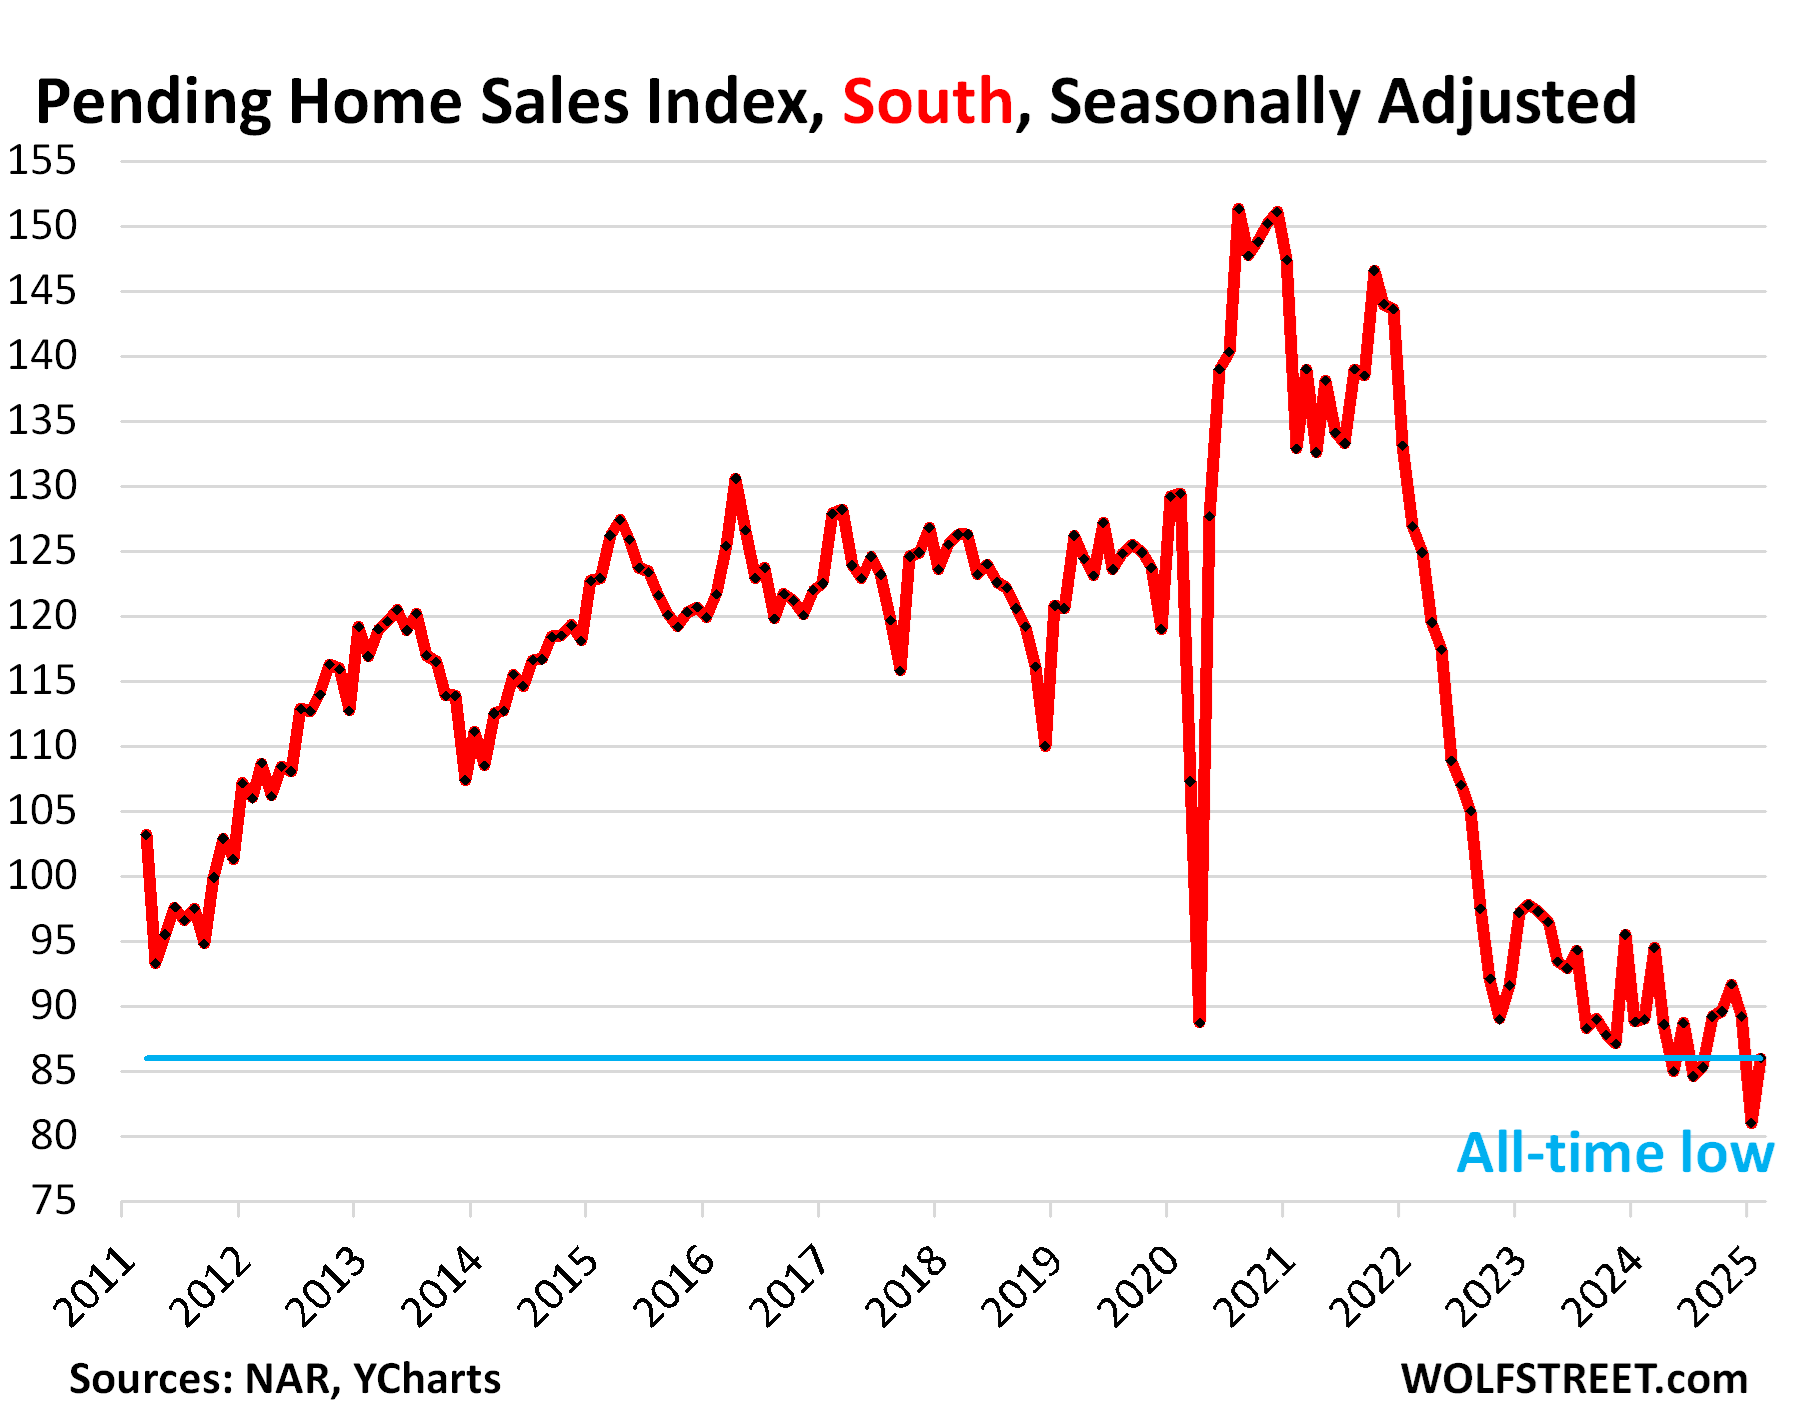
In the South: frozen sales, ballooning inventories.
Pending sales rose 6.2% in February from the all-time low in January, seasonally adjusted, marking the worst February in the data.
It’s precisely in the South where inventories for sale of new houses and existing homes are now piling up.
Pending sales in February compared to the Februarys in prior years (historic data via YCharts):
- 2024: -3.4%
- 2023: -12.1%
- 2022: -32.2%
- 2021: -35.3%
- 2020: -33.5%
- 2019: -28.7%.
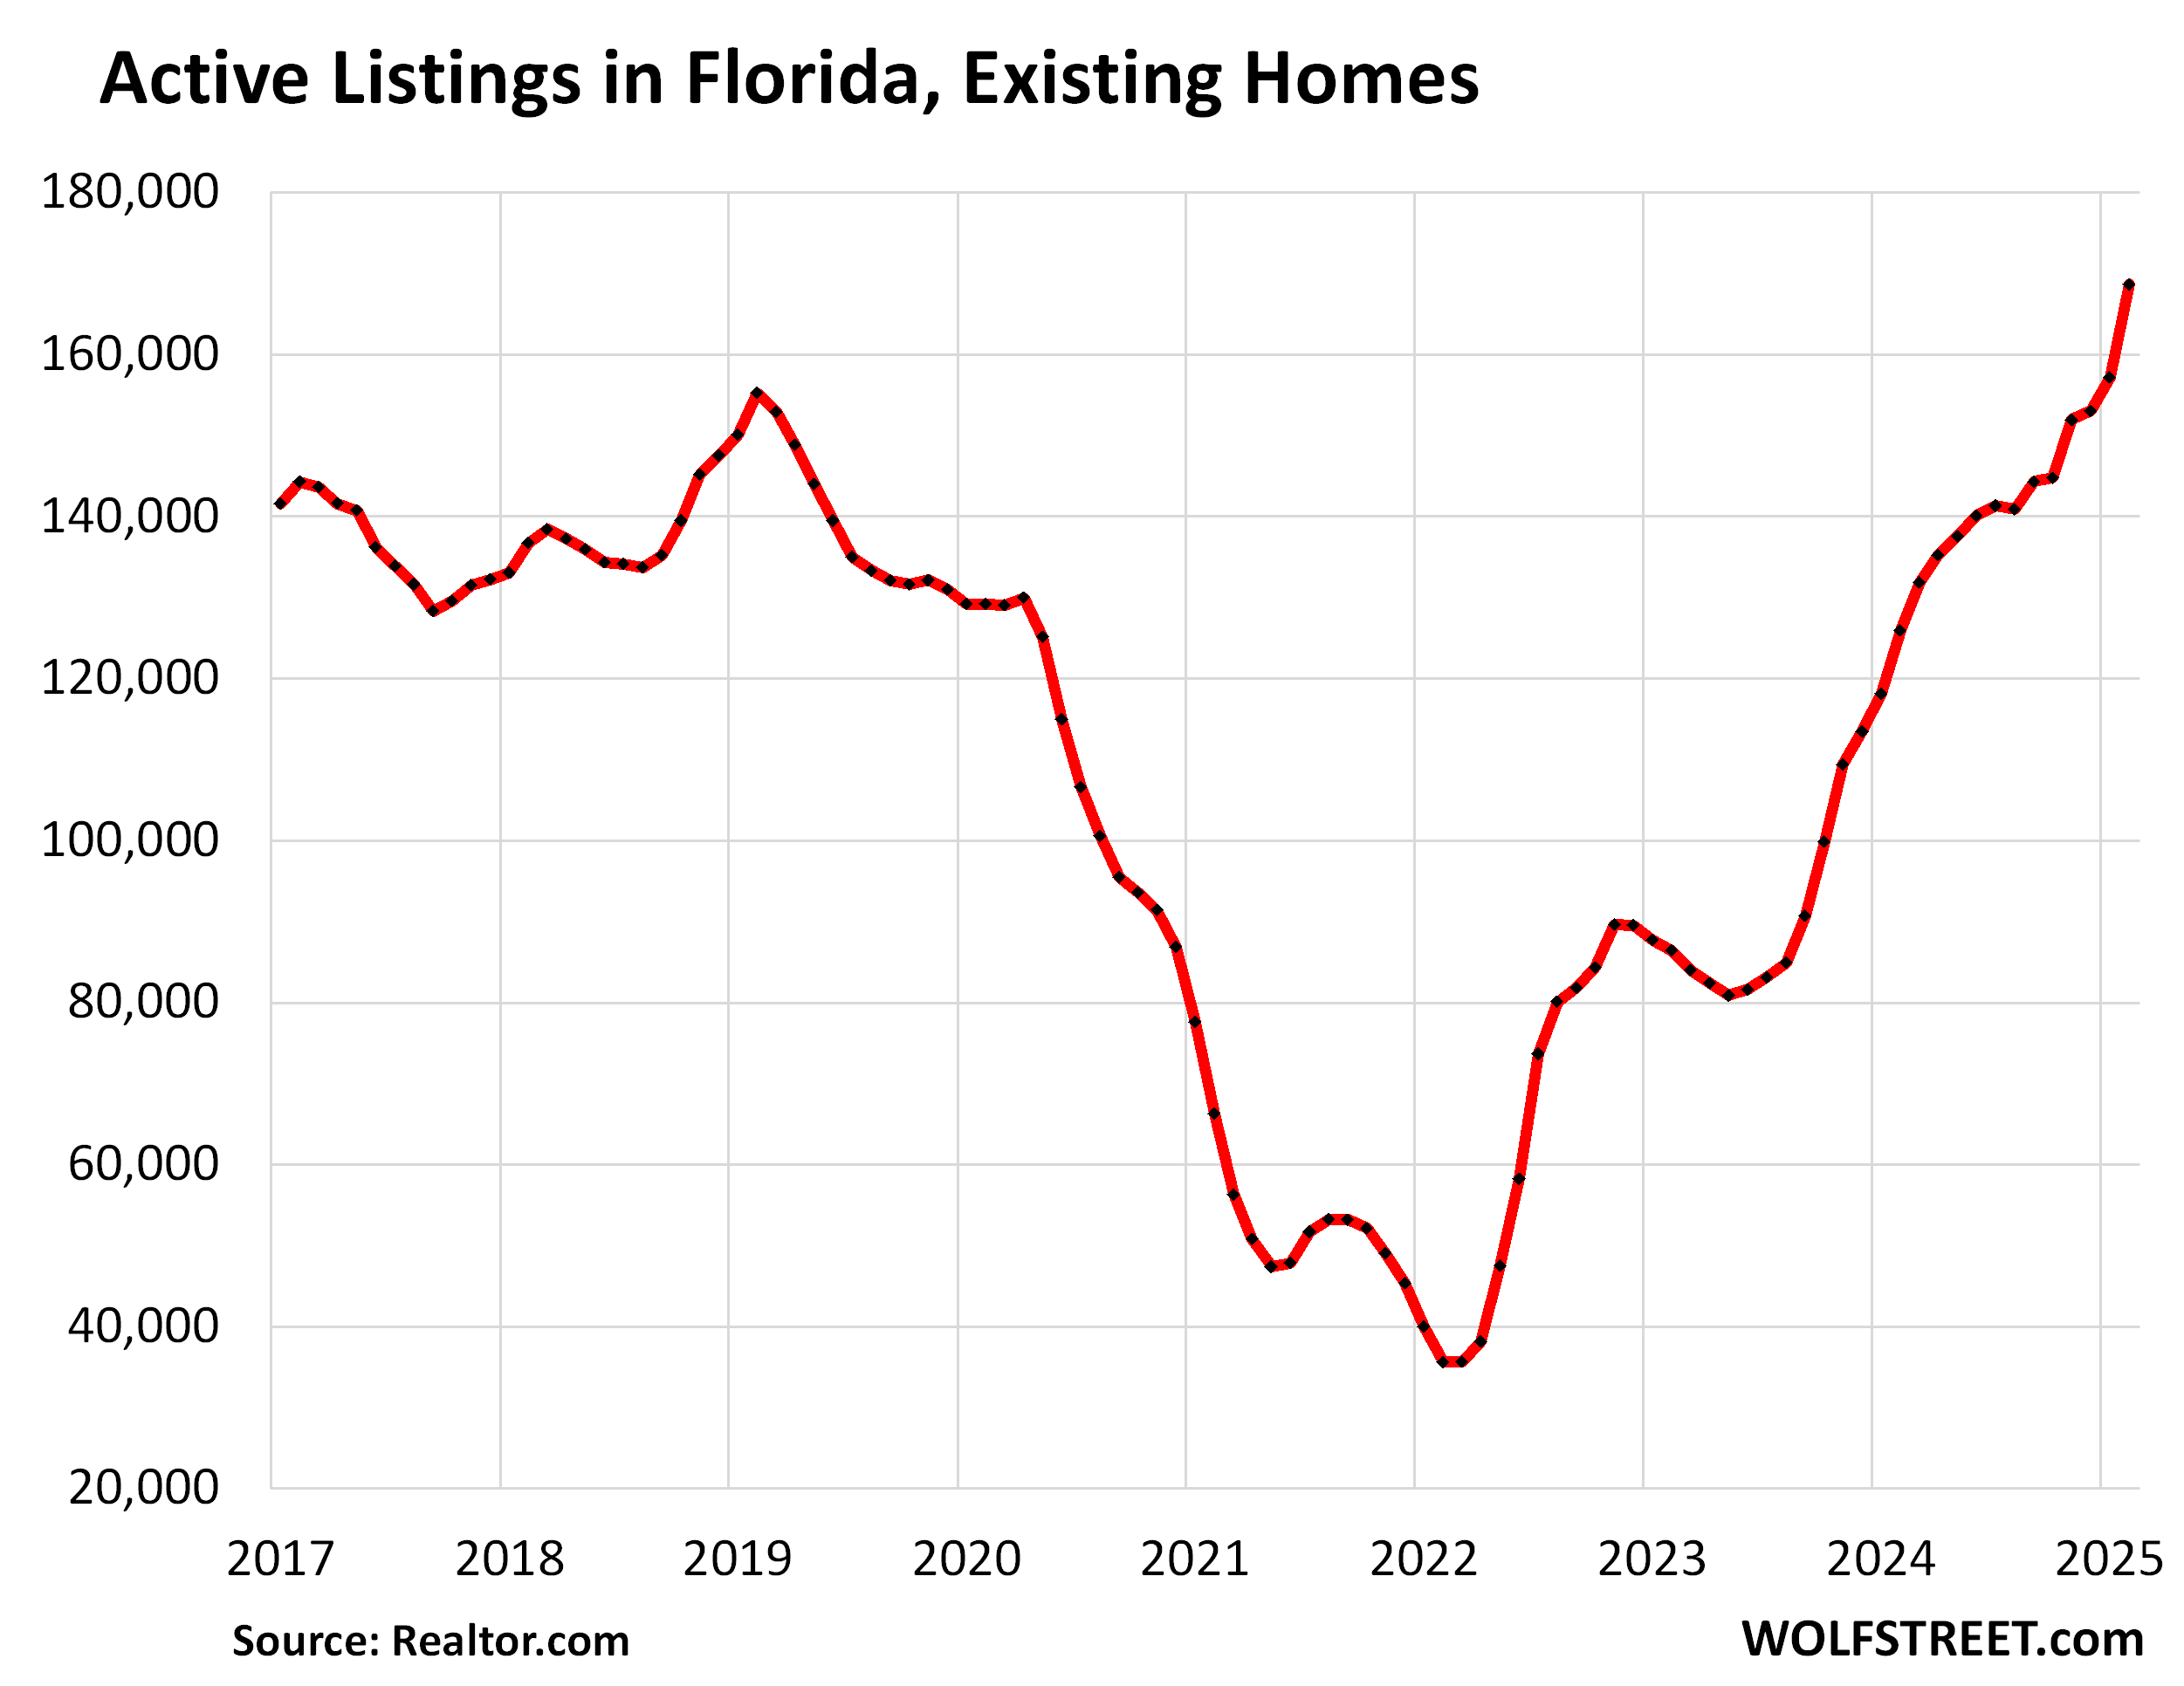
Inventories of existing homes surged in Florida and Texas. In terms of transactions, Florida is the largest housing market in the US. Florida and Texas dominate the vast South (map of regions in the comments below). And that’s where inventories of existing homes are ballooning, which is a good thing because the housing market needs these inventories.
In Florida, active listings of existing homes surged by 34% year-over-year in February, to 168,717 listings, the highest in the data by Realtor.com going back to 2016.
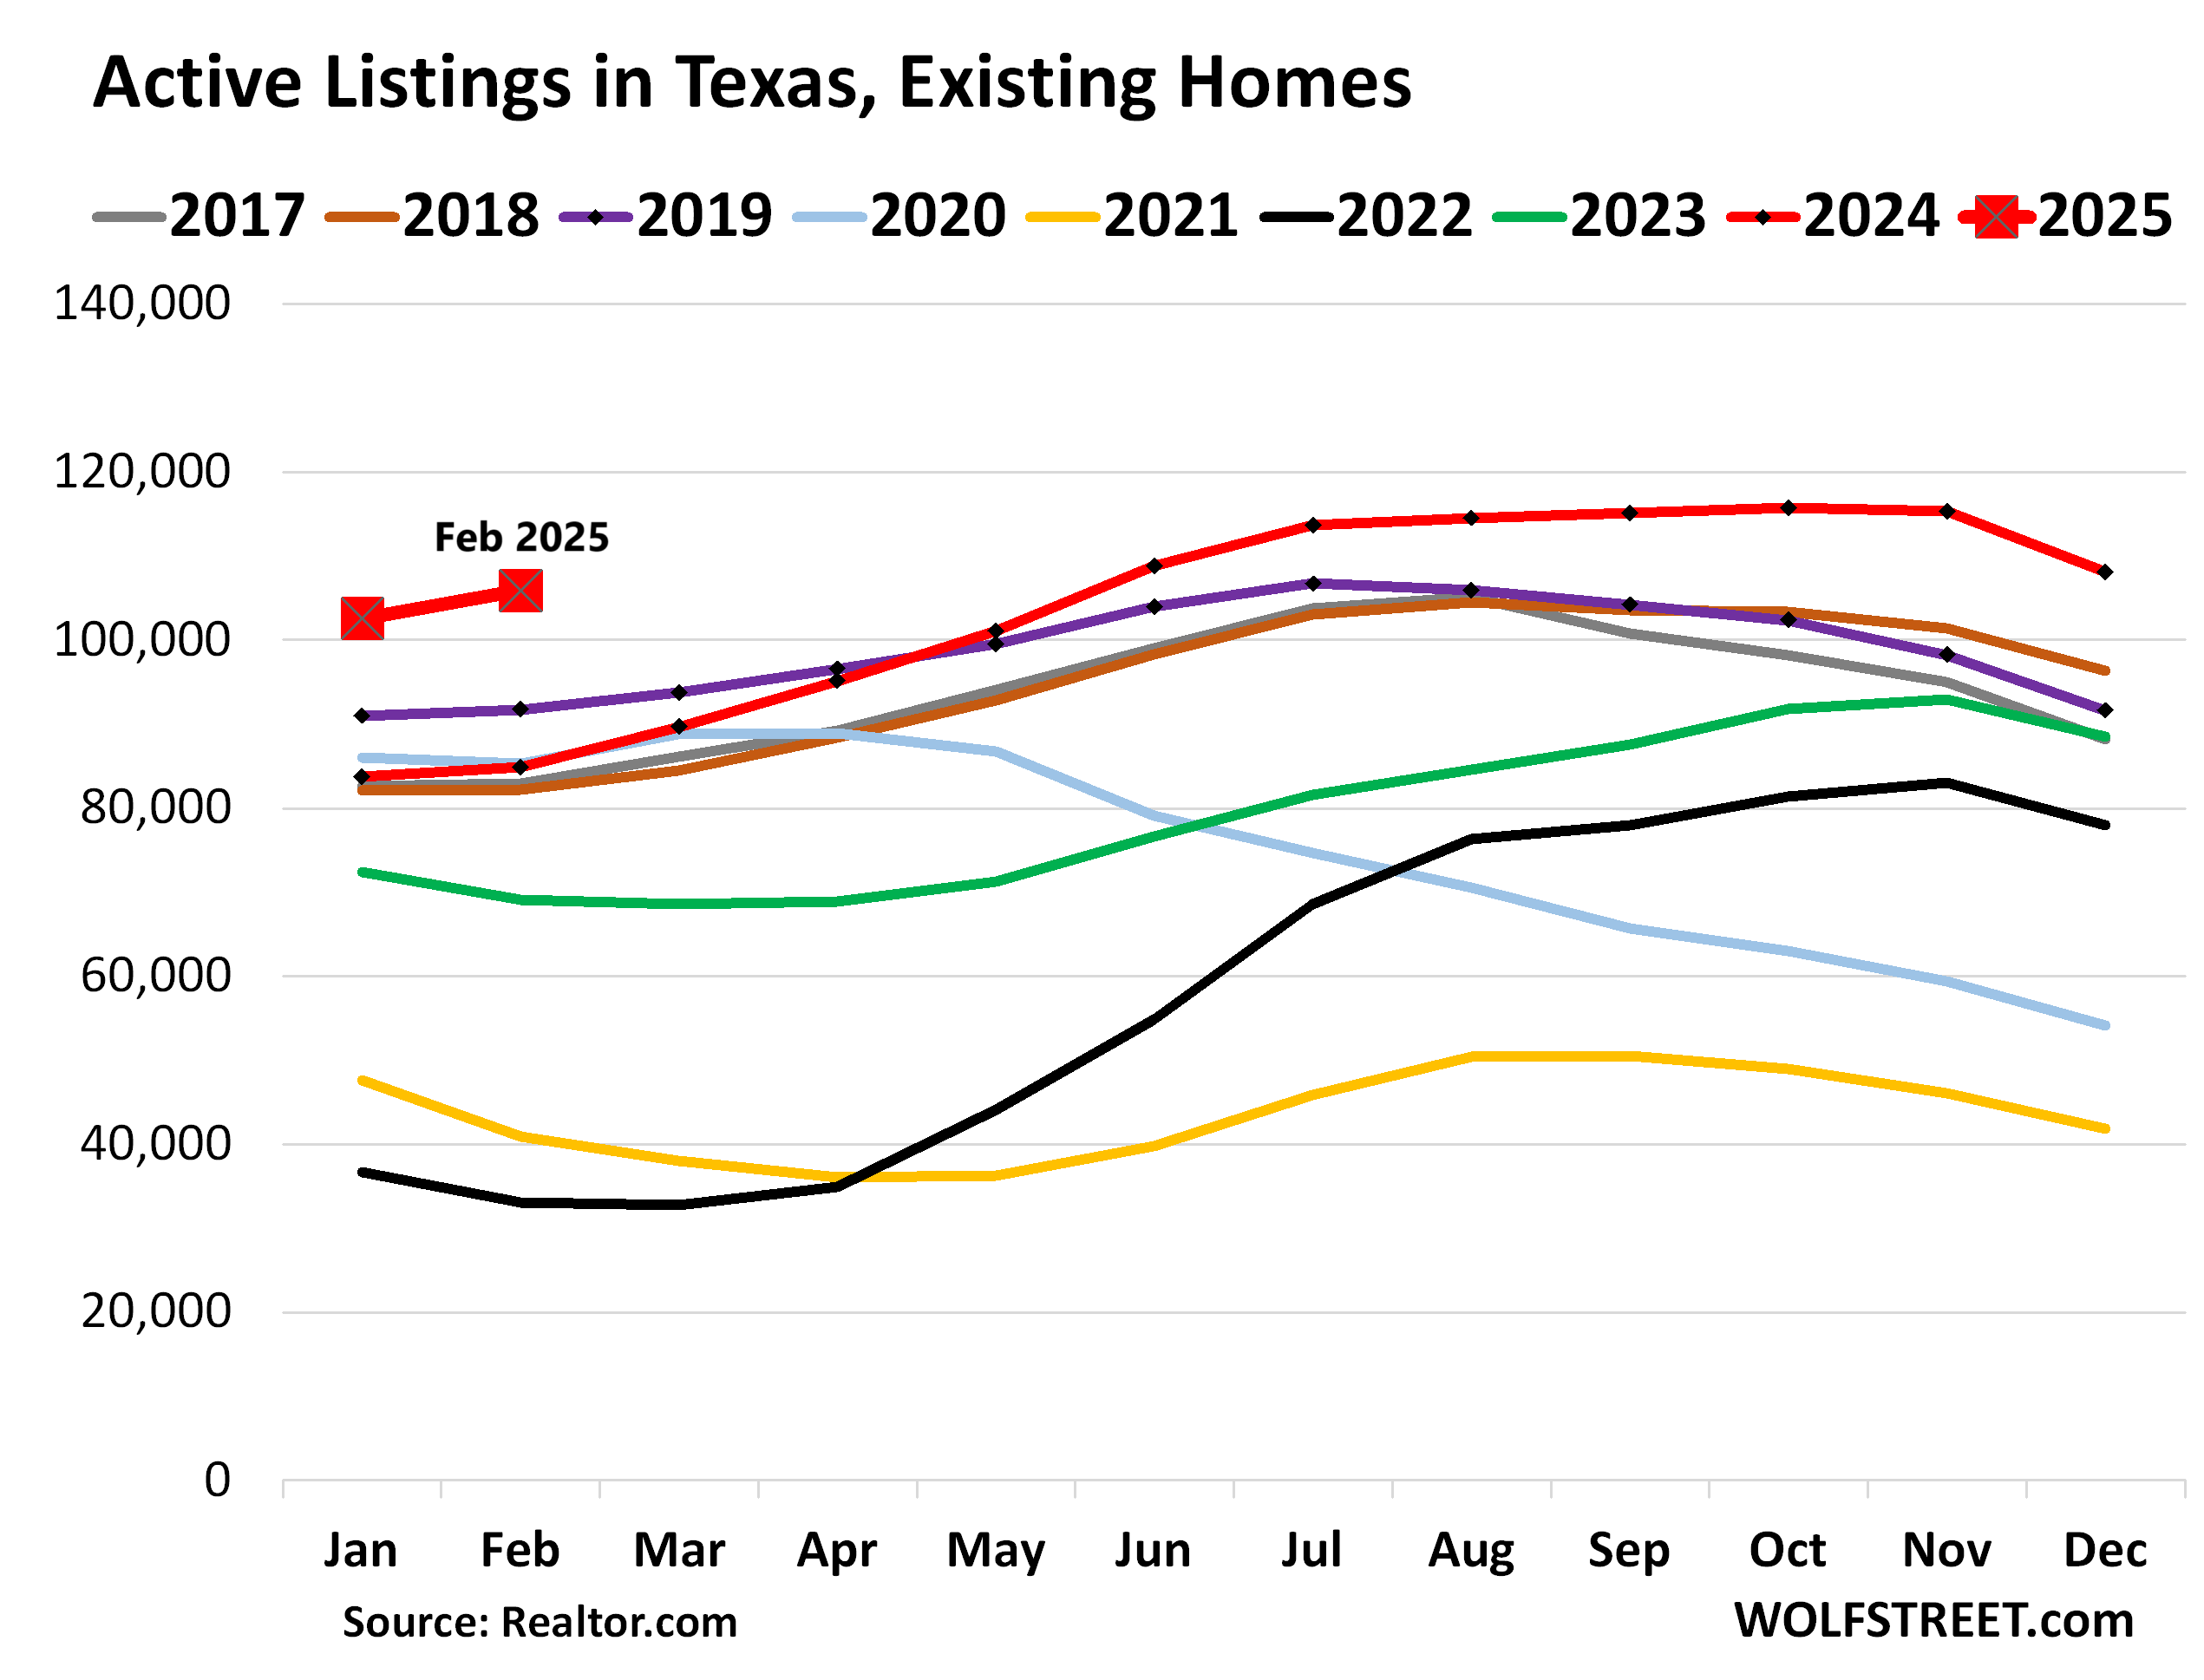
In Texas, active listings of existing homes jumped by 25% year-over-year in February, to 105,867 listings, the highest for any February in the data by Realtor.com going back to 2016.
Active listings in Texas are highly seasonal: lows in January/February, highs in July/August. So we look at the stacked chart (big red squares = January and February 2025).
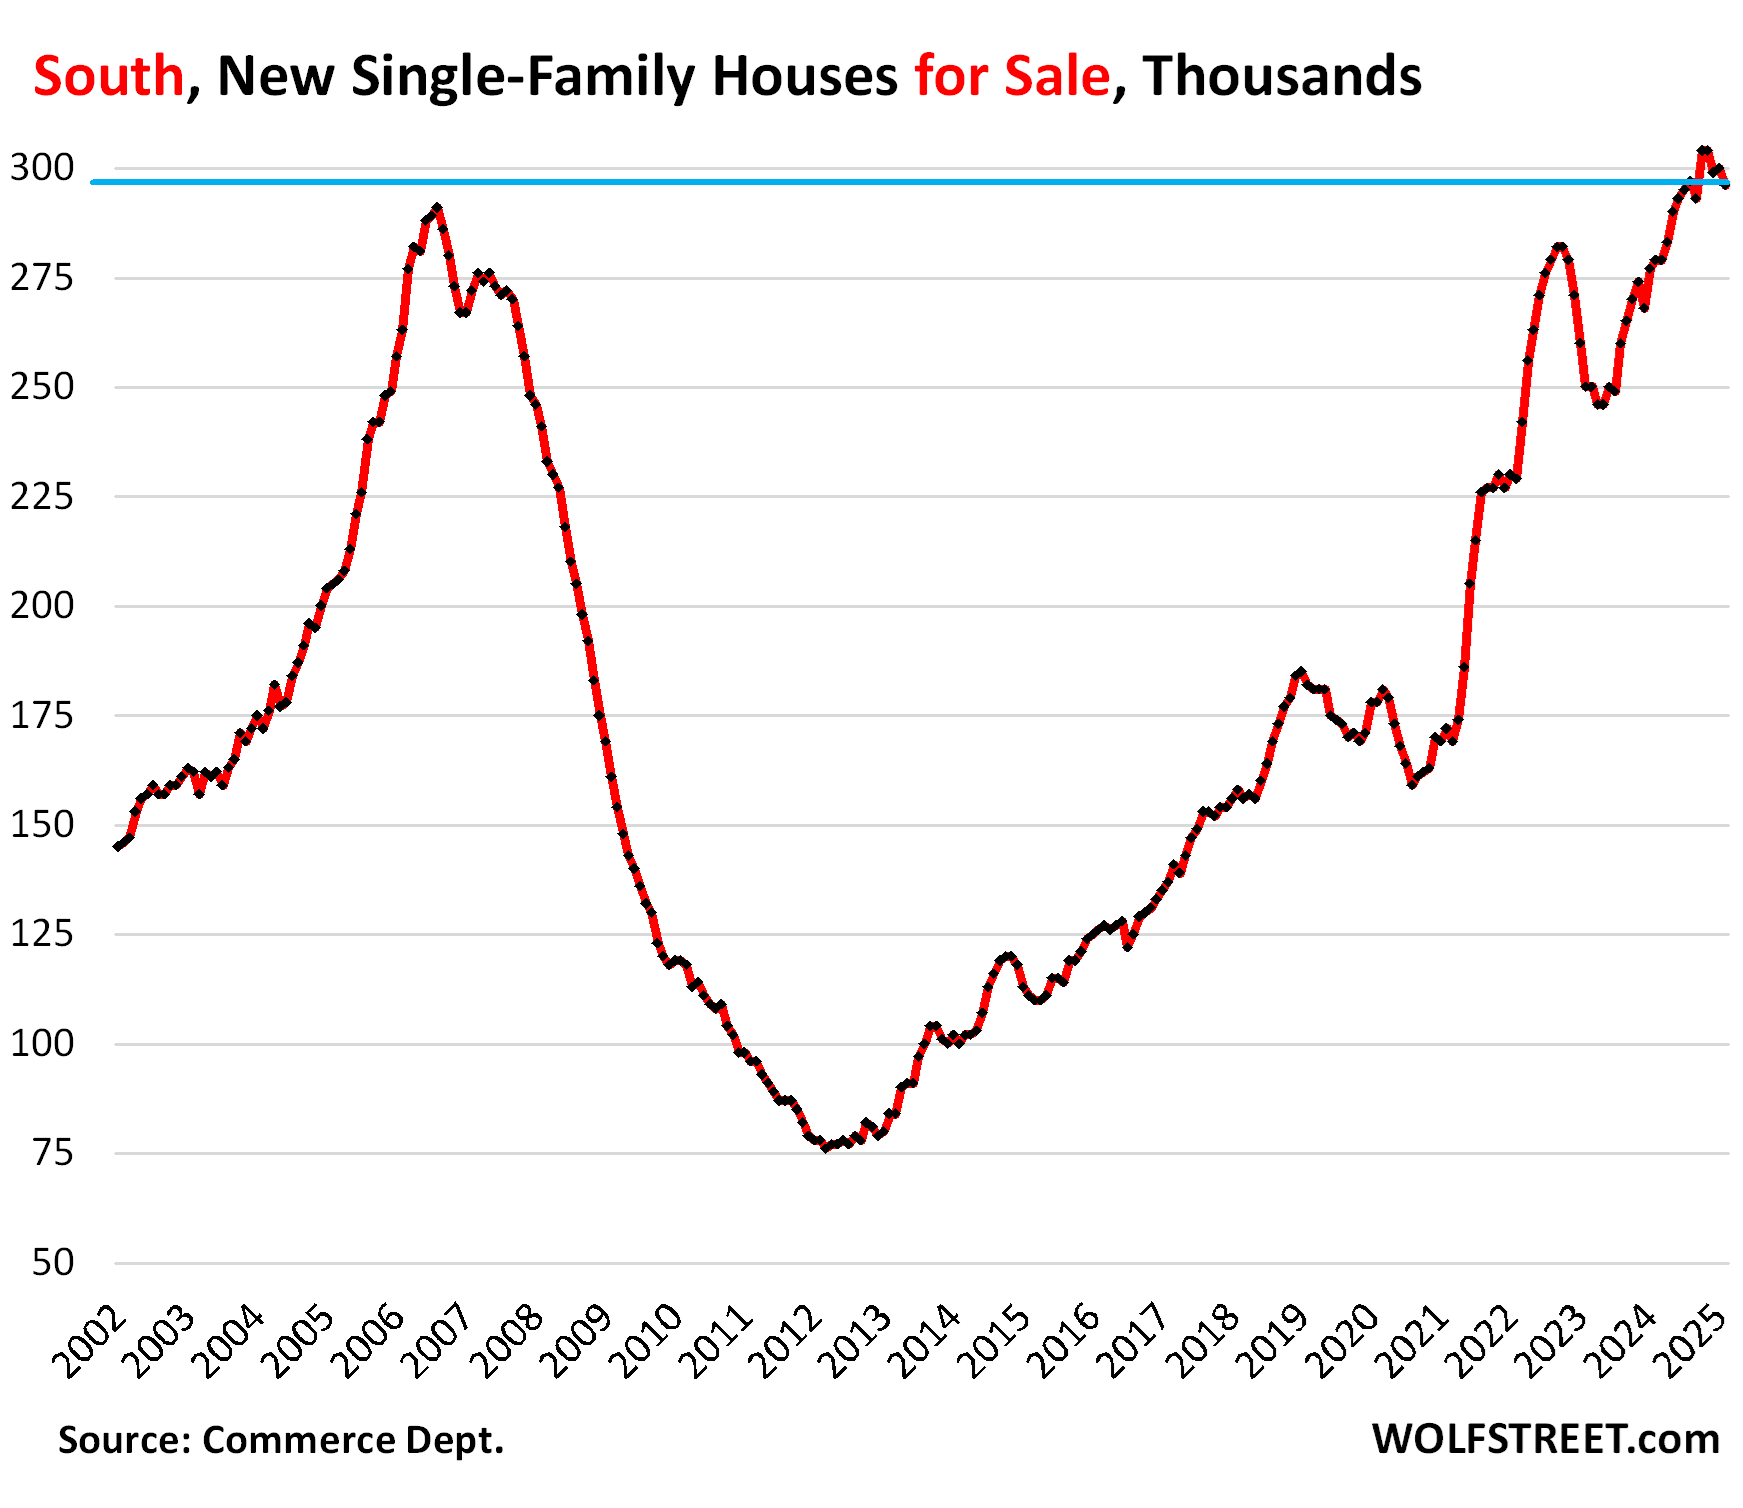
New single-family houses for sale in the South have ballooned past the Housing-Bust high since mid-2024 to a range between 290,000 to 304,000 houses for sale. In February, 296,000 new houses were for sale in the South, up by 72% from February 2019!
Massive incentives and lower prices by homebuilders have stimulated sales in the South, and in February, sales were up by 18% year-over-year. That’s what it takes to cure the issues of this housing market: lots of new inventory and lower prices.
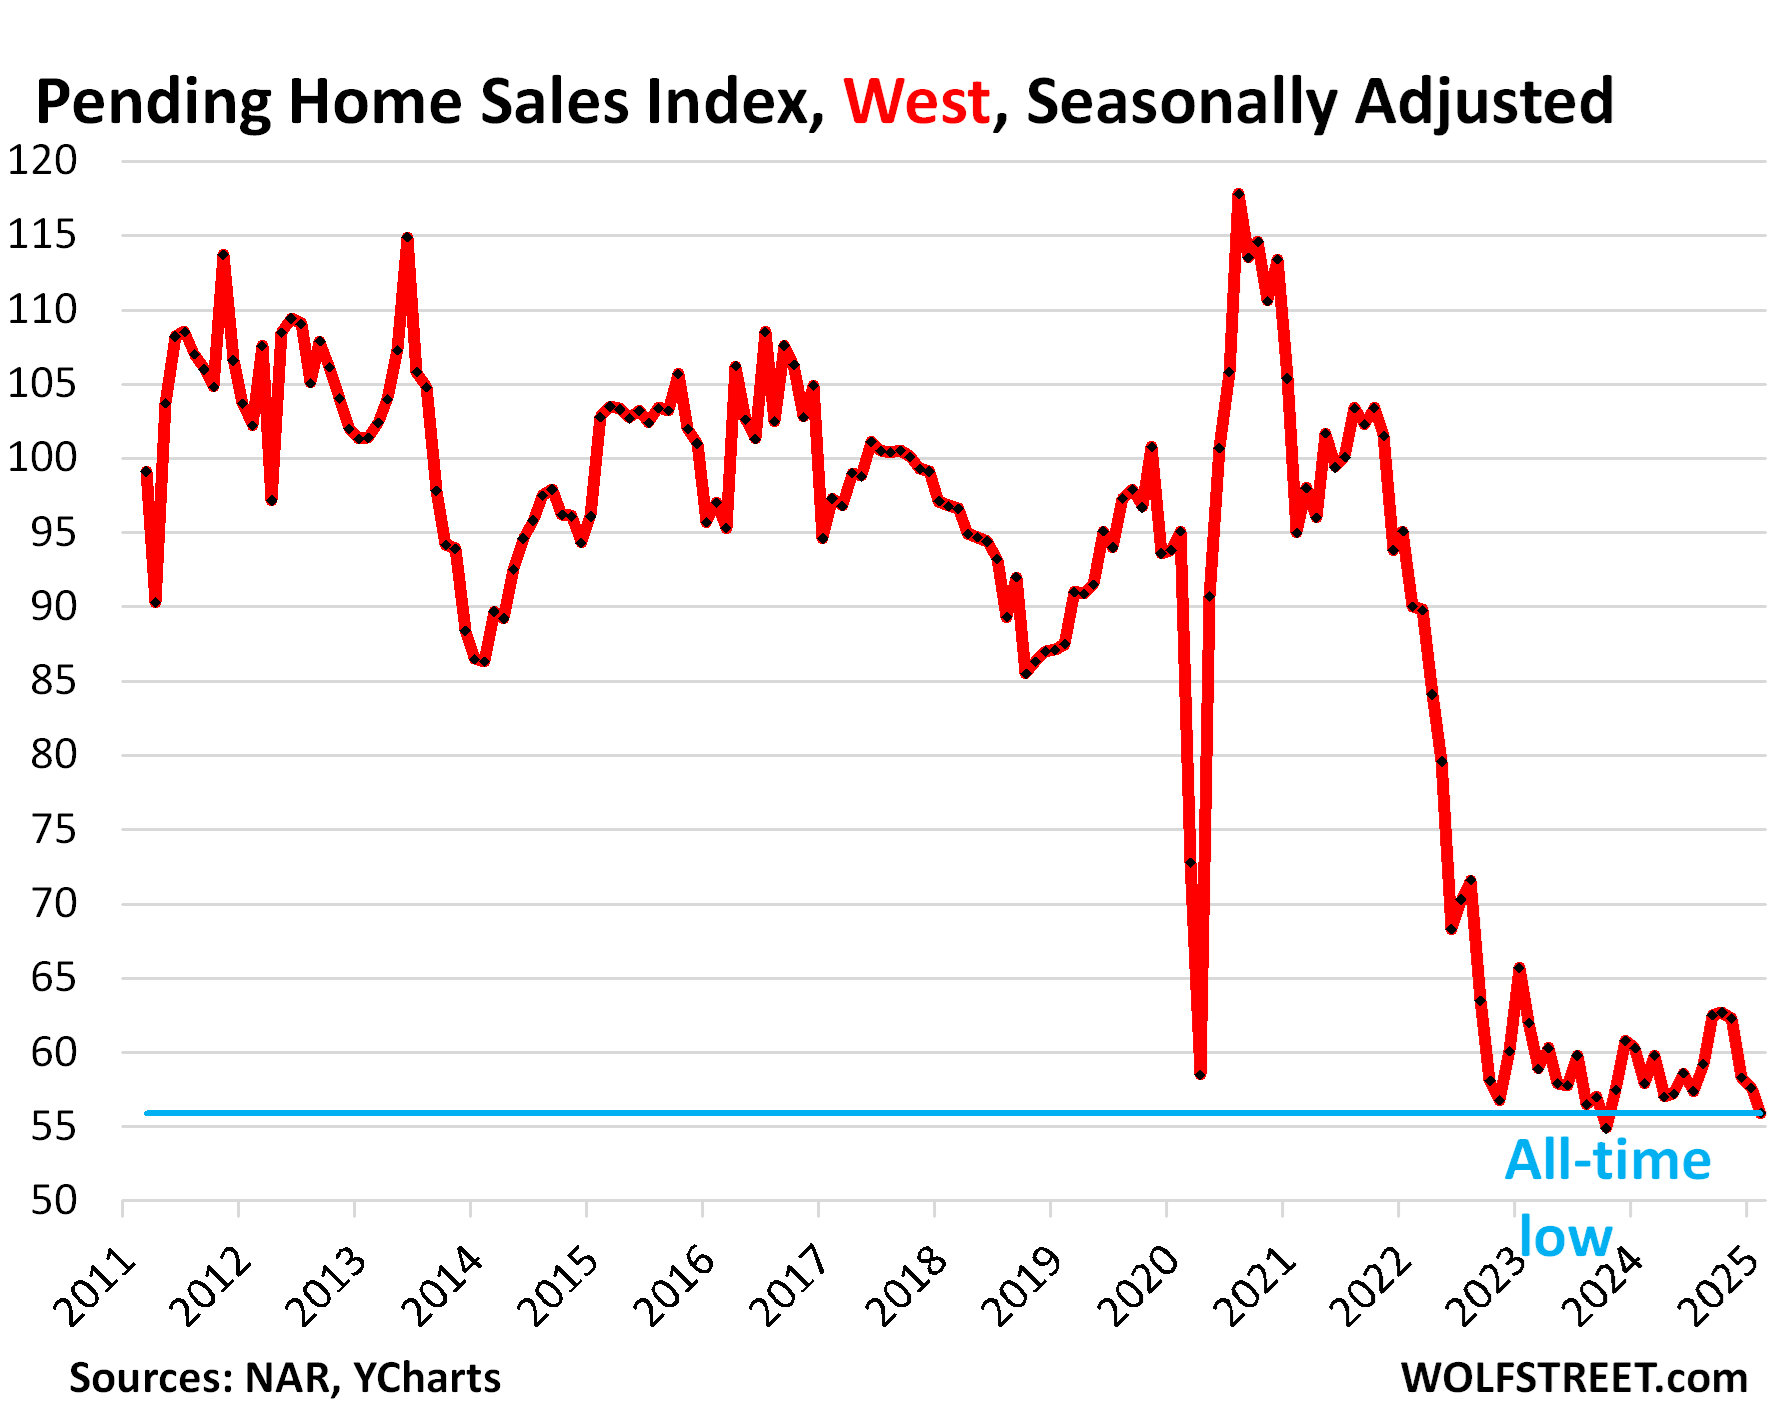
In the West, frozen sales, ballooning inventories.
Pending sales of existing homes dropped 3.0% in February, to the second lowest levels behind only the all-time low of October 2023, marking the worst February in the data, seasonally adjusted.
Compared to the Februarys in prior years (historic data via YCharts):
- 2024: -3.5%
- 2023: -9.8%
- 2022: -37.9%
- 2021: -41.2%
- 2020: -41.2%
- 2019: -36.1%.
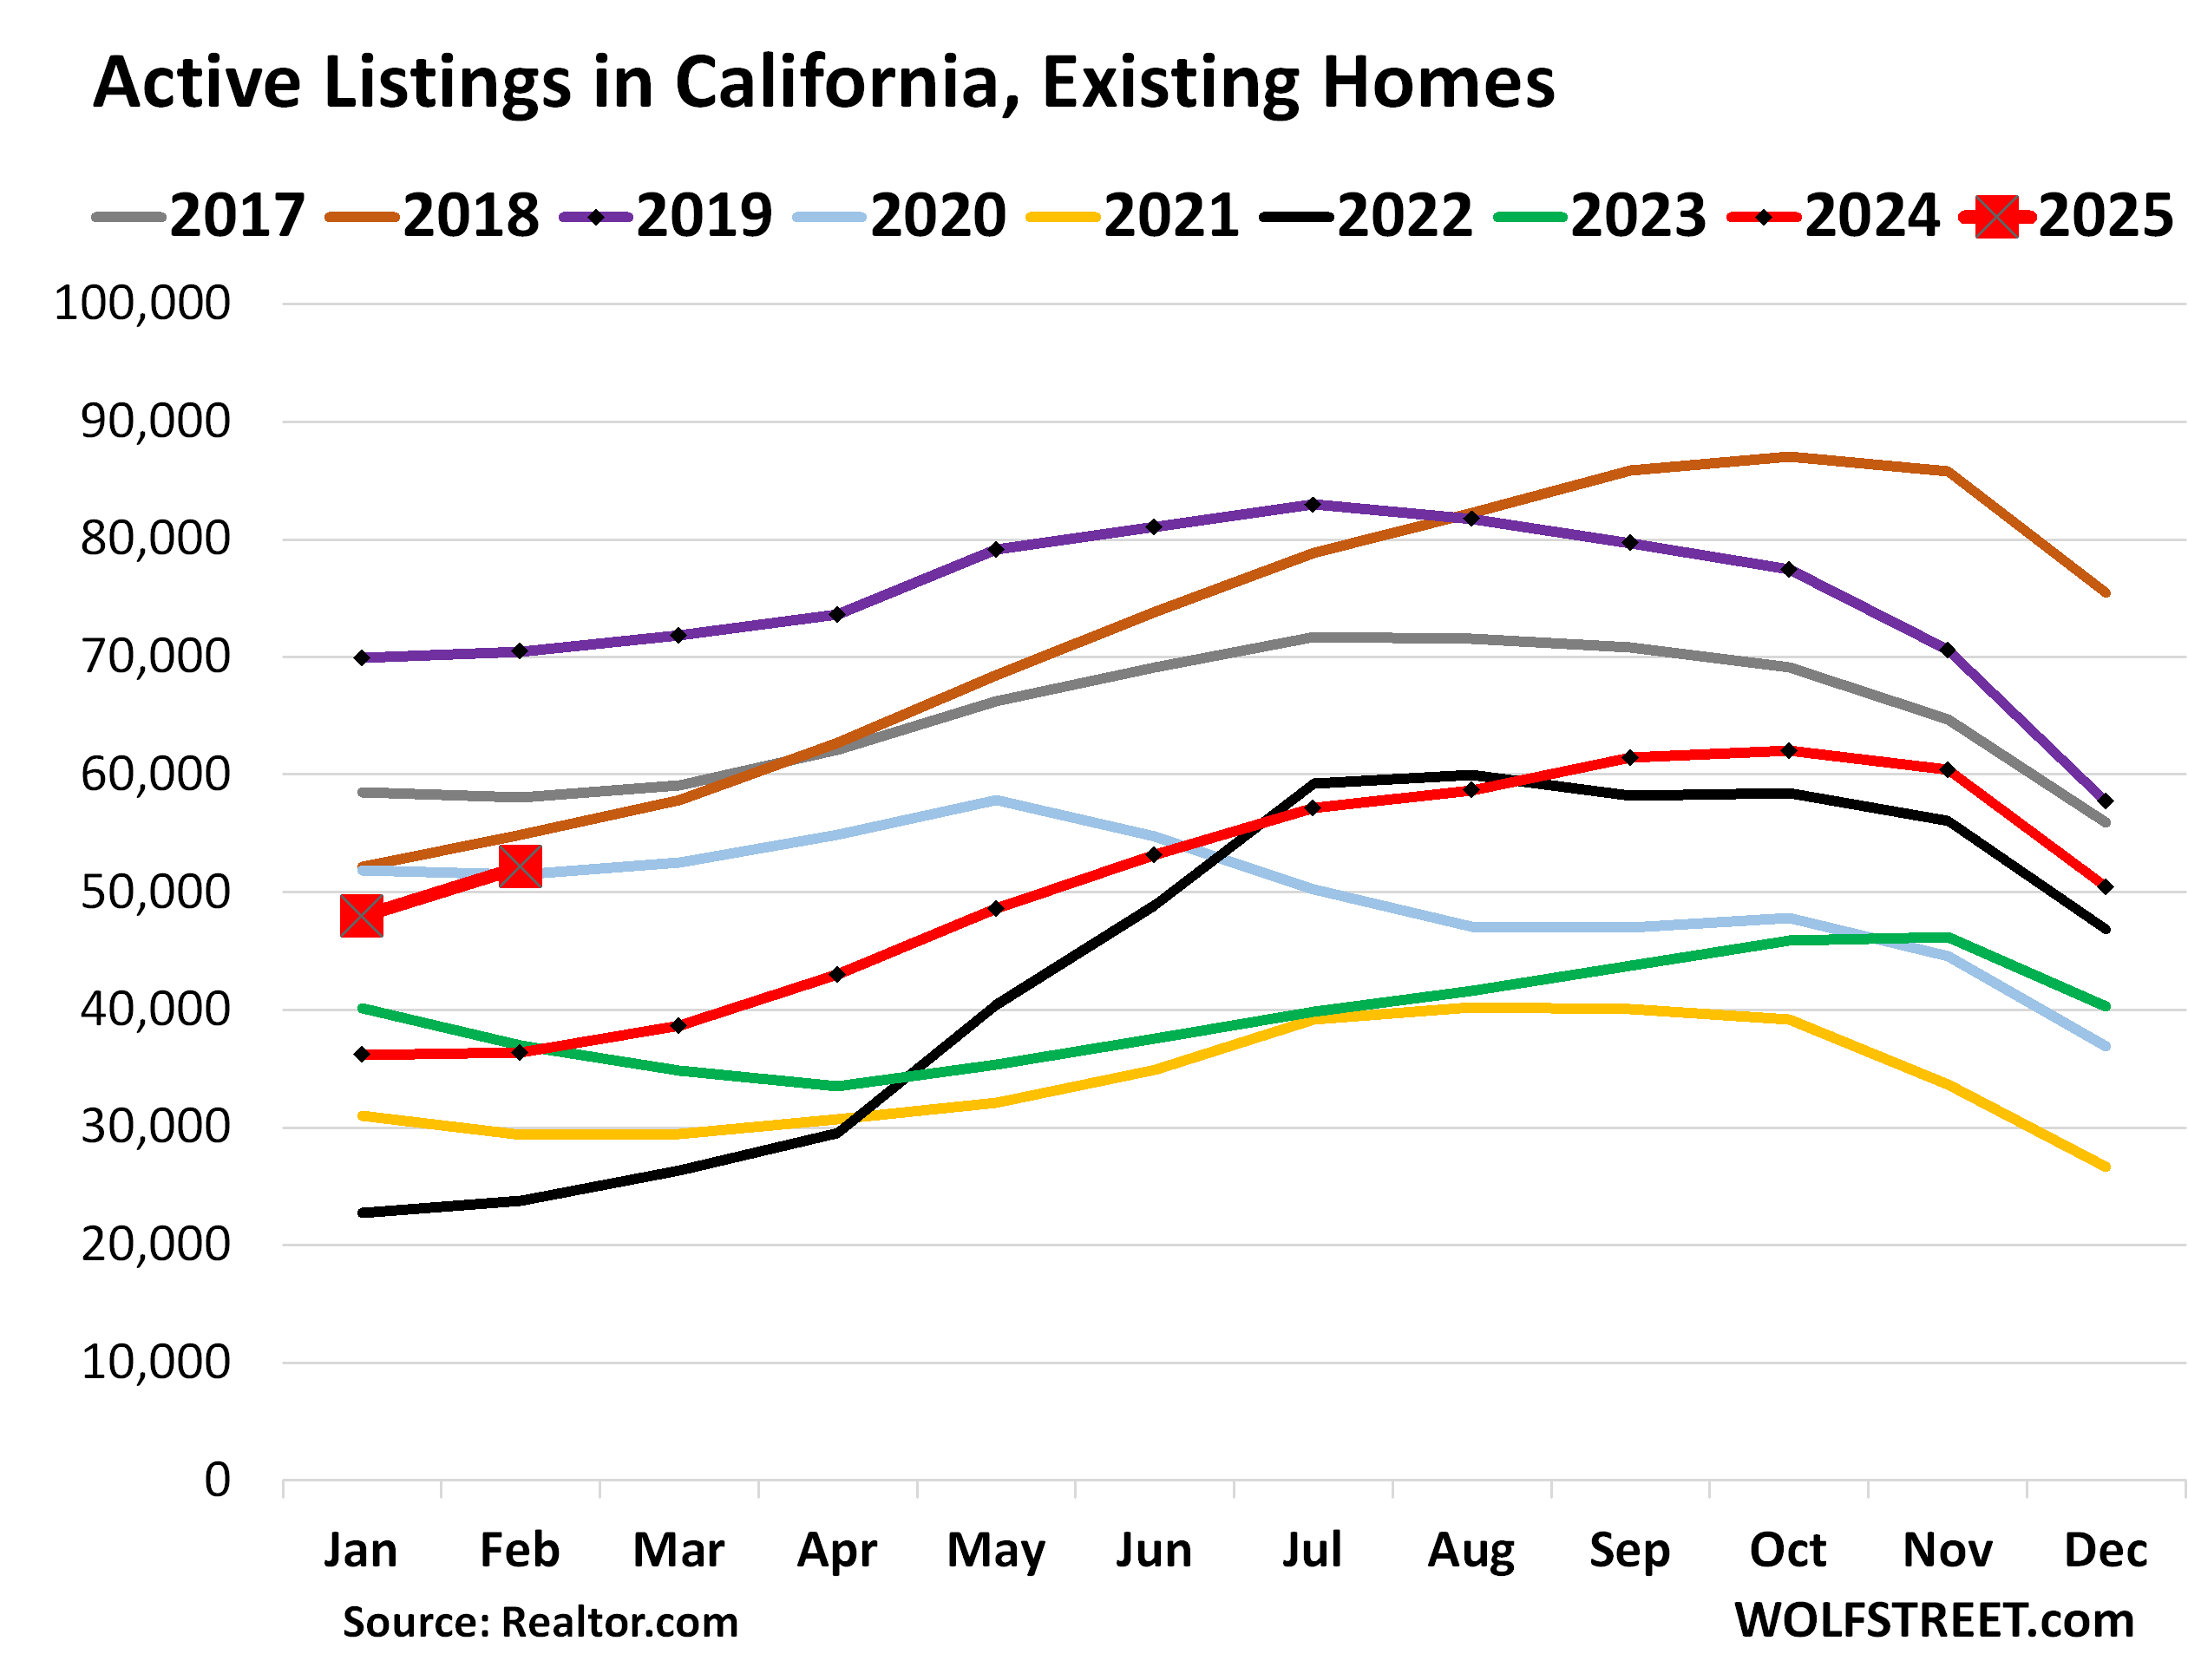
Inventory of existing homes in the West varies by area, and California may not be the most representative example of the West, but it’s by far the largest market in the West. So we’ll take a look.
Active listings of existing homes in California spiked by 43% in February from a year ago, to 52,144 homes, the highest February since 2019, and just a hair below February 2018 (big red squares = January and February 2025).
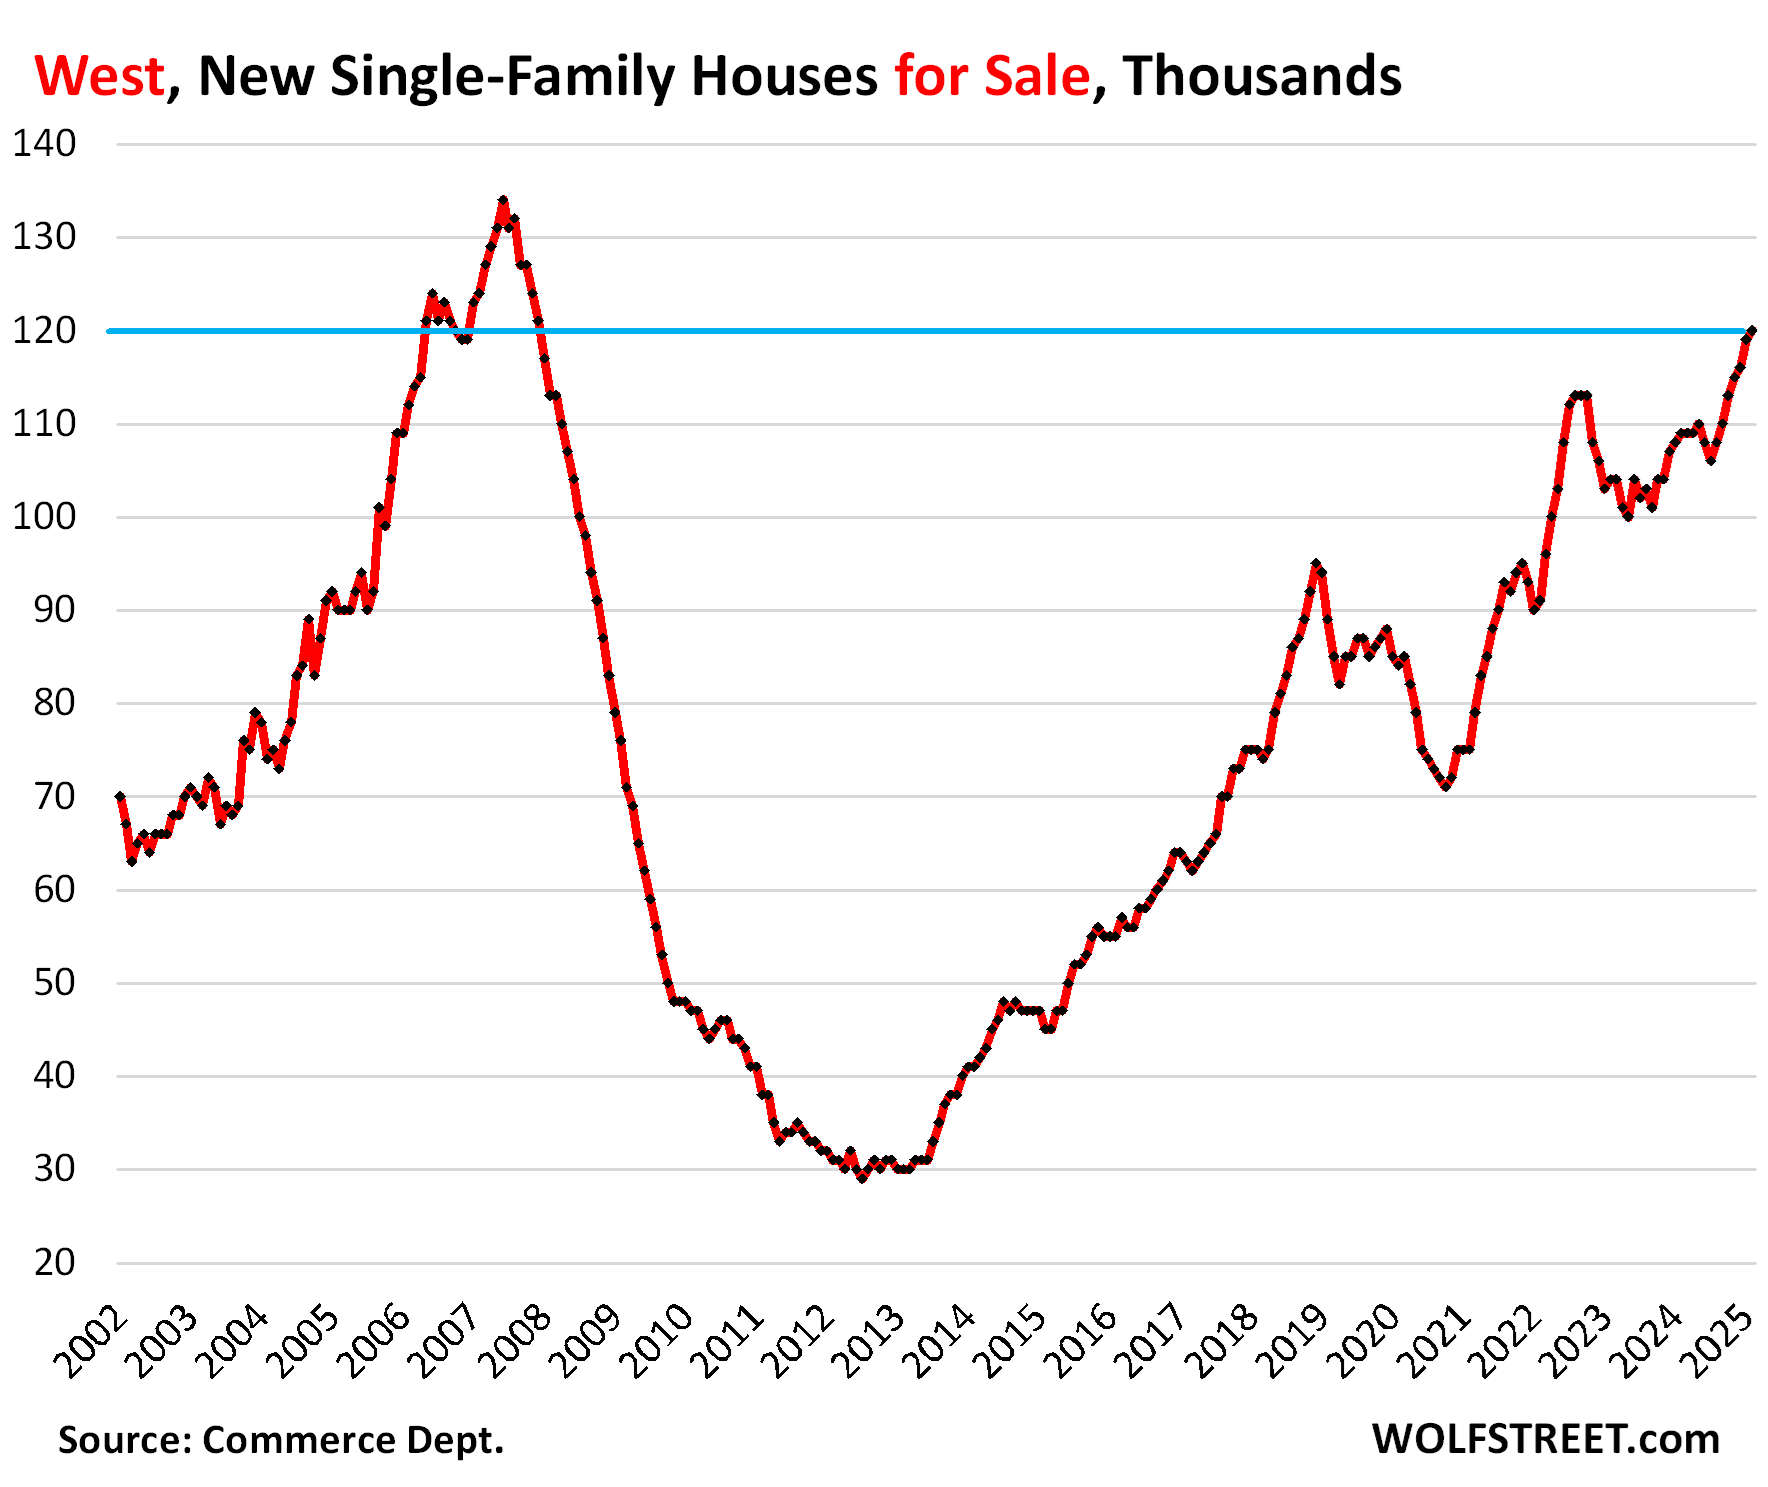
Inventory of new single-family houses surged in the West to 120,000 houses, the highest level since December 2007, and up by 60% from 2019.
Pending sales in the Northeast and Midwest.
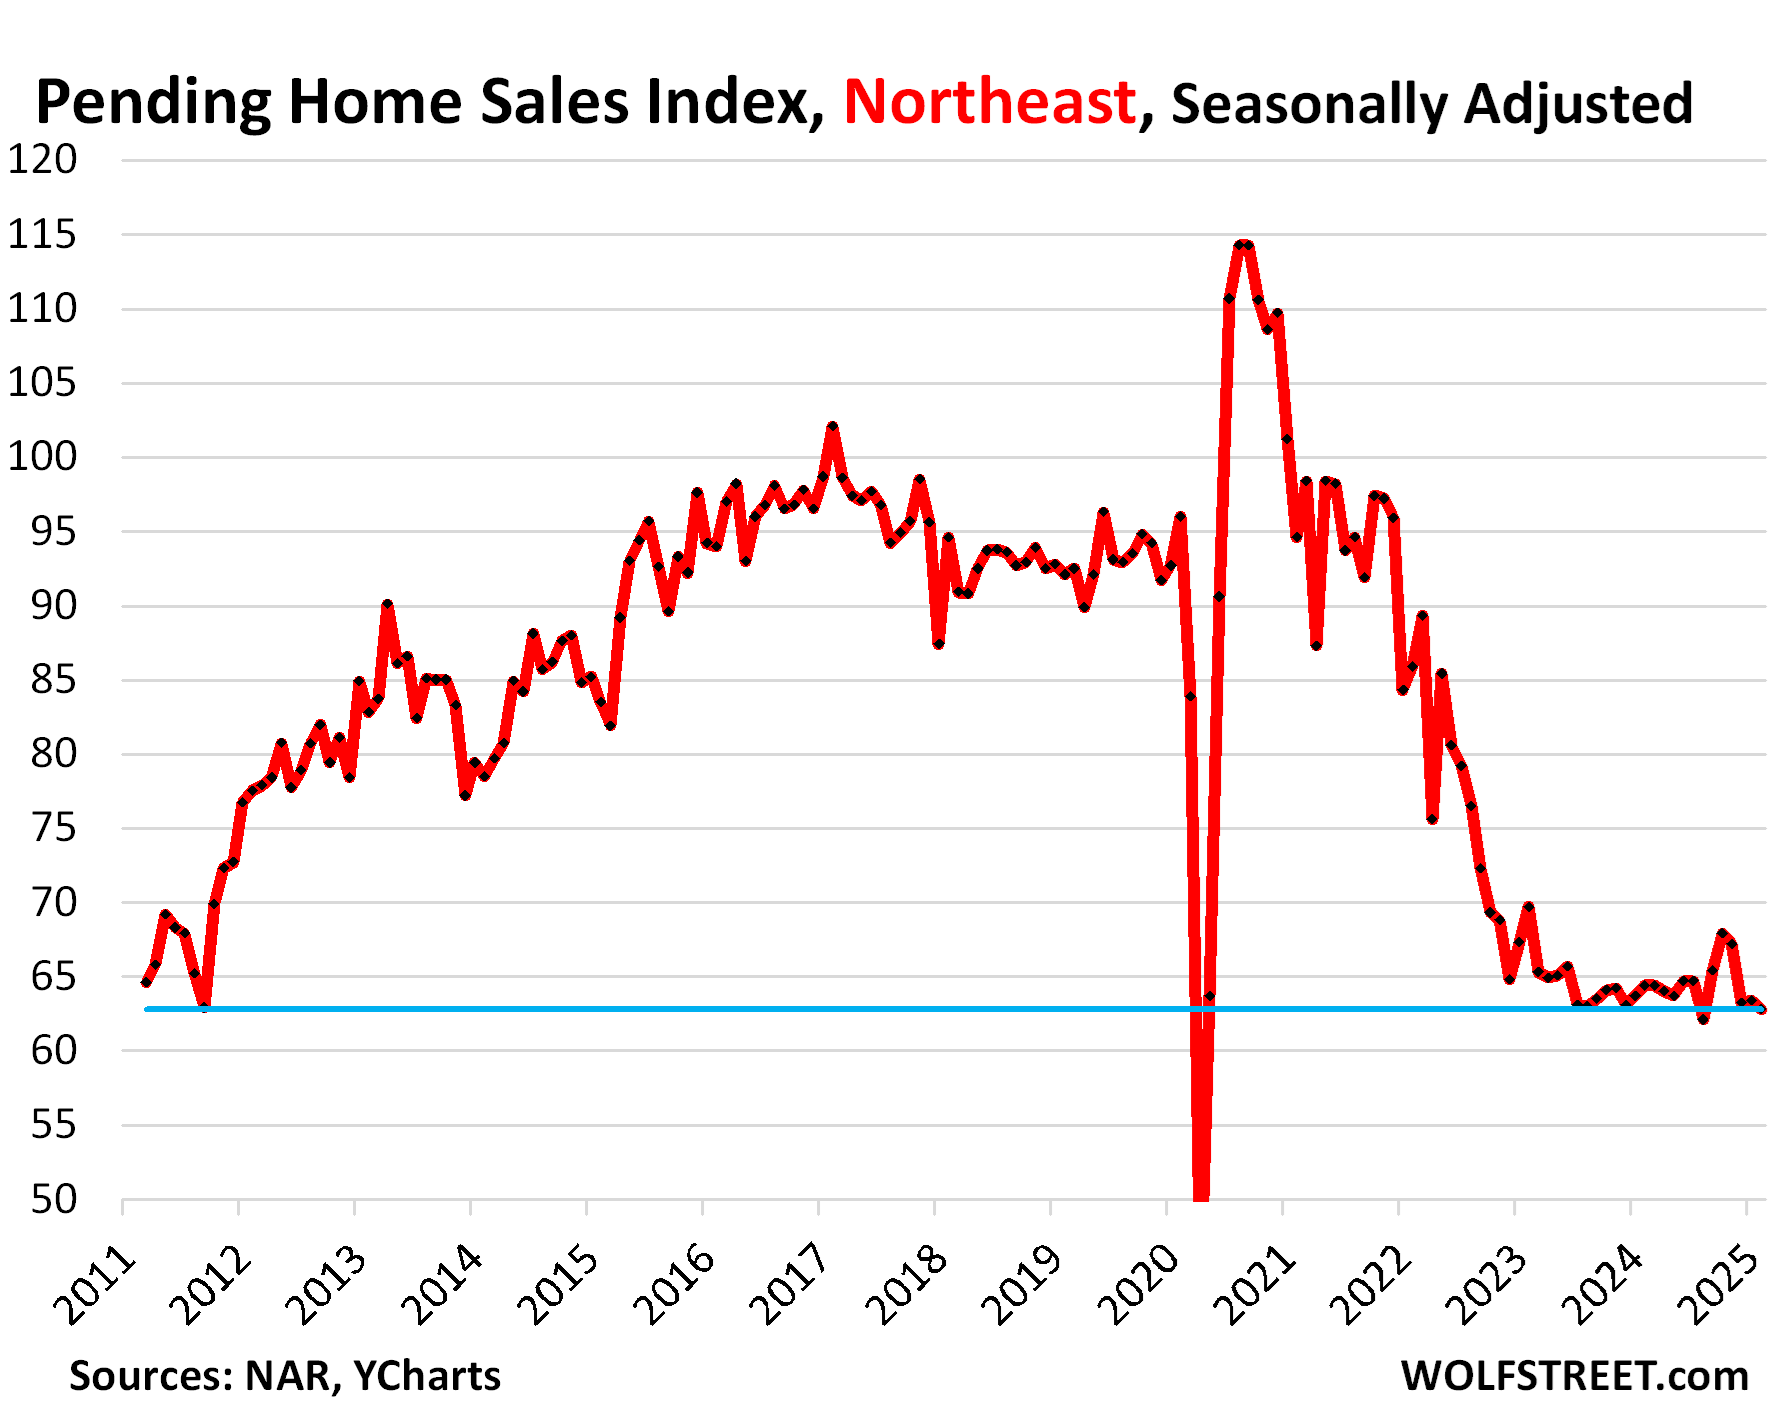
In the Northeast, pending sales of existing homes fell by 0.9% in February from January, seasonally adjusted, the worst February in the data, and the third-worst month overall after August 2024 and Lockdown-April 2020.
Compared to the Februarys in prior years (historic data via YCharts):
- 2024: -2.5%
- 2023: -9.9%
- 2022: -26.9%
- 2021: -33.6%
- 2020: -34.6%
- 2019: -31.8%.
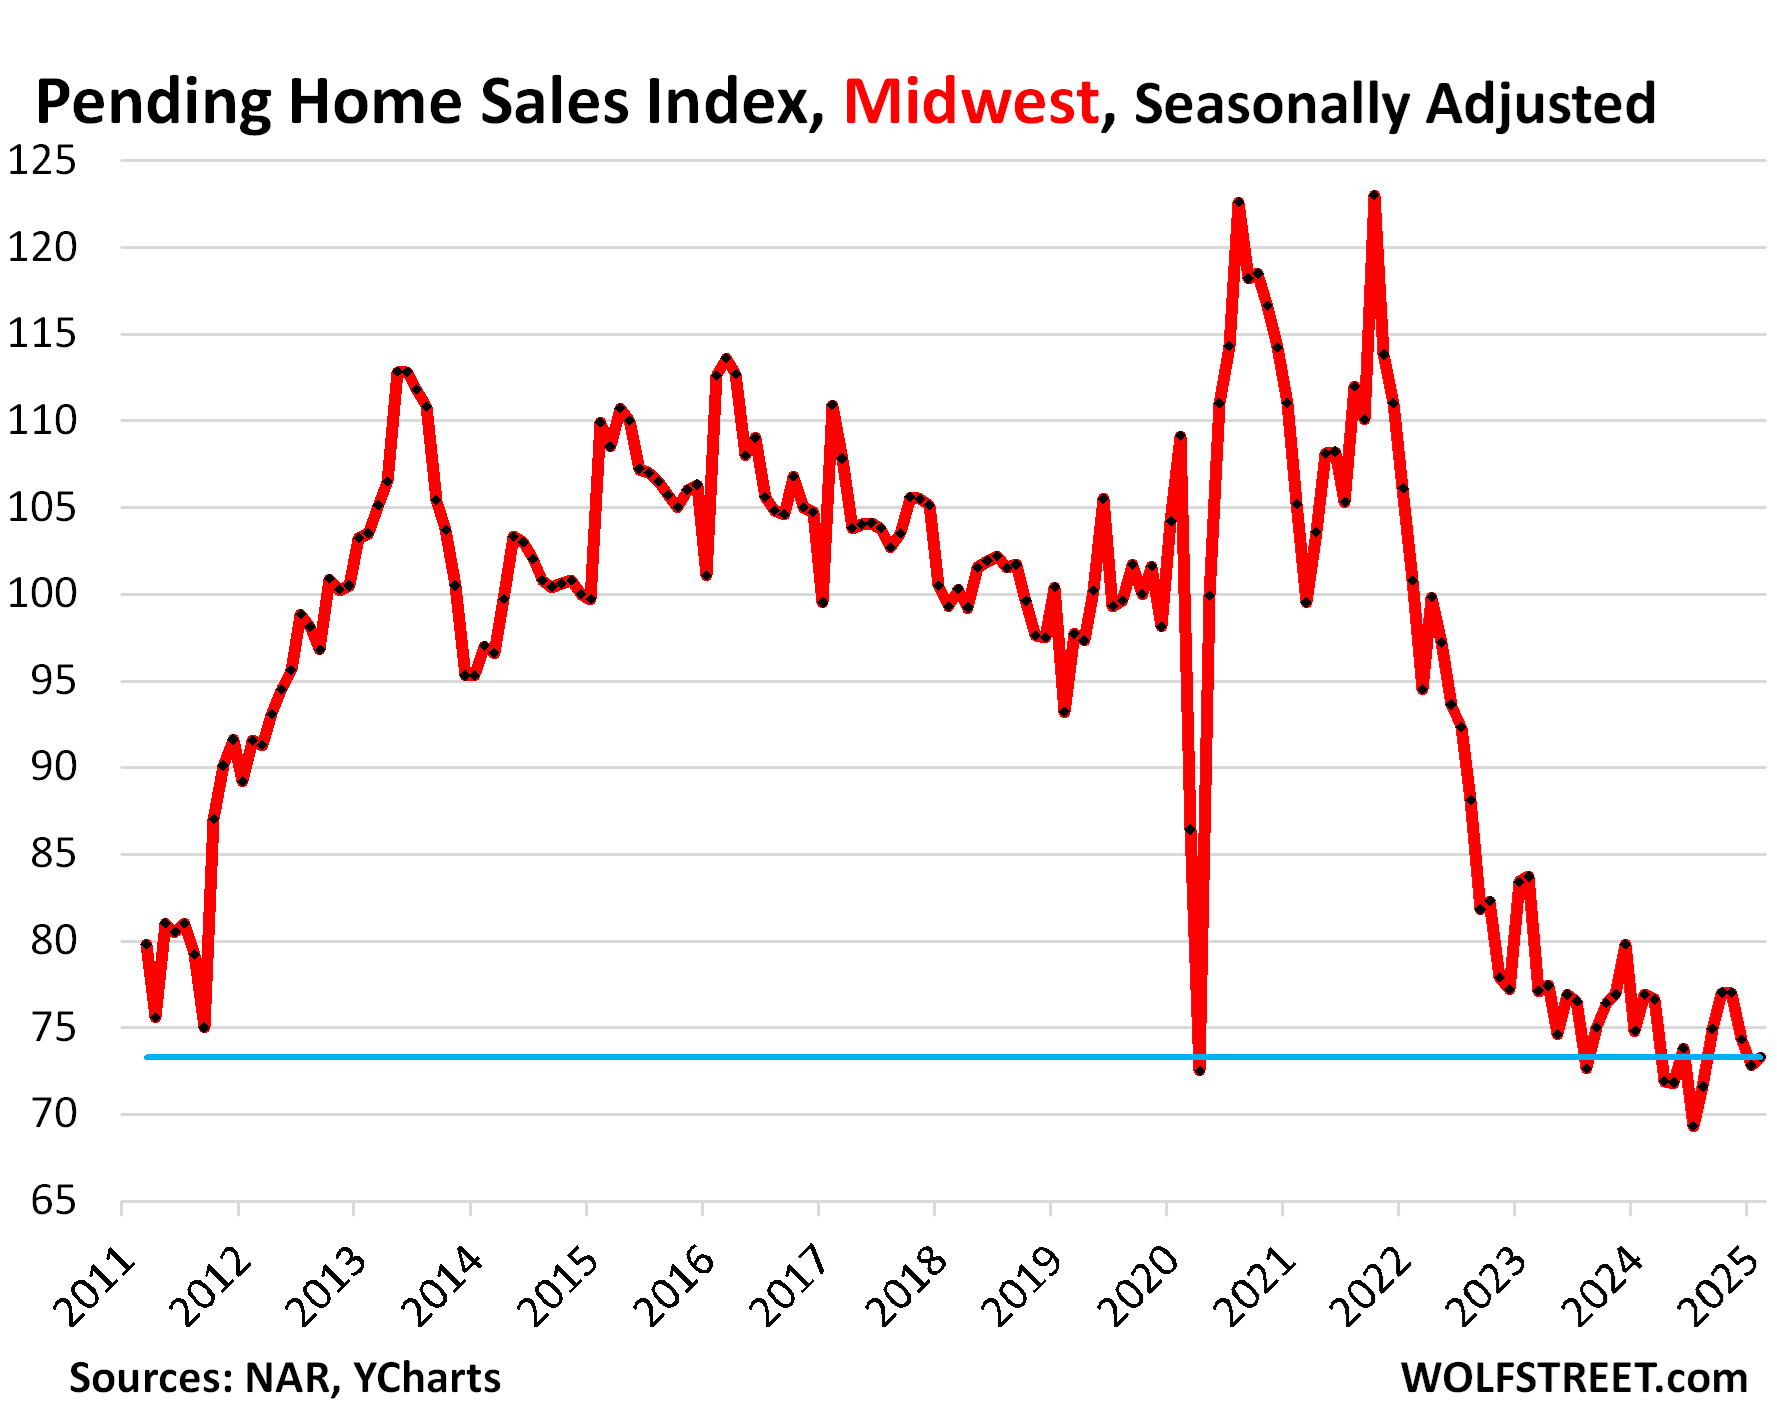
In the Midwest, pending sales rose by 0.7% in February from January, seasonally adjusted, marking the worst February in the data.
Compared to the Februarys in prior years (historic data via YCharts):
- 2024: -4.7%
- 2023: -12.4%
- 2022: -27.3%
- 2021: -30.3%
- 2020: -32.8%
- 2019: -21.4%.
Enjoy reading WOLF STREET and want to support it? You can donate. I appreciate it immensely. Click on the mug to find out how:

![]()
The post In the South & West, Pending Sales of Existing Homes Mark Worst February in the Data, as Inventories in Florida, Texas, California Surge appeared first on Energy News Beat.