Energy News Beat
Austin, Oakland, Saint Petersburg (FL), San Francisco, Chula Vista, Detroit, New Orleans, Denver, Jacksonville, Naples, Tampa, Mesa, Portland, Seattle.
By Wolf Richter for WOLF STREET.
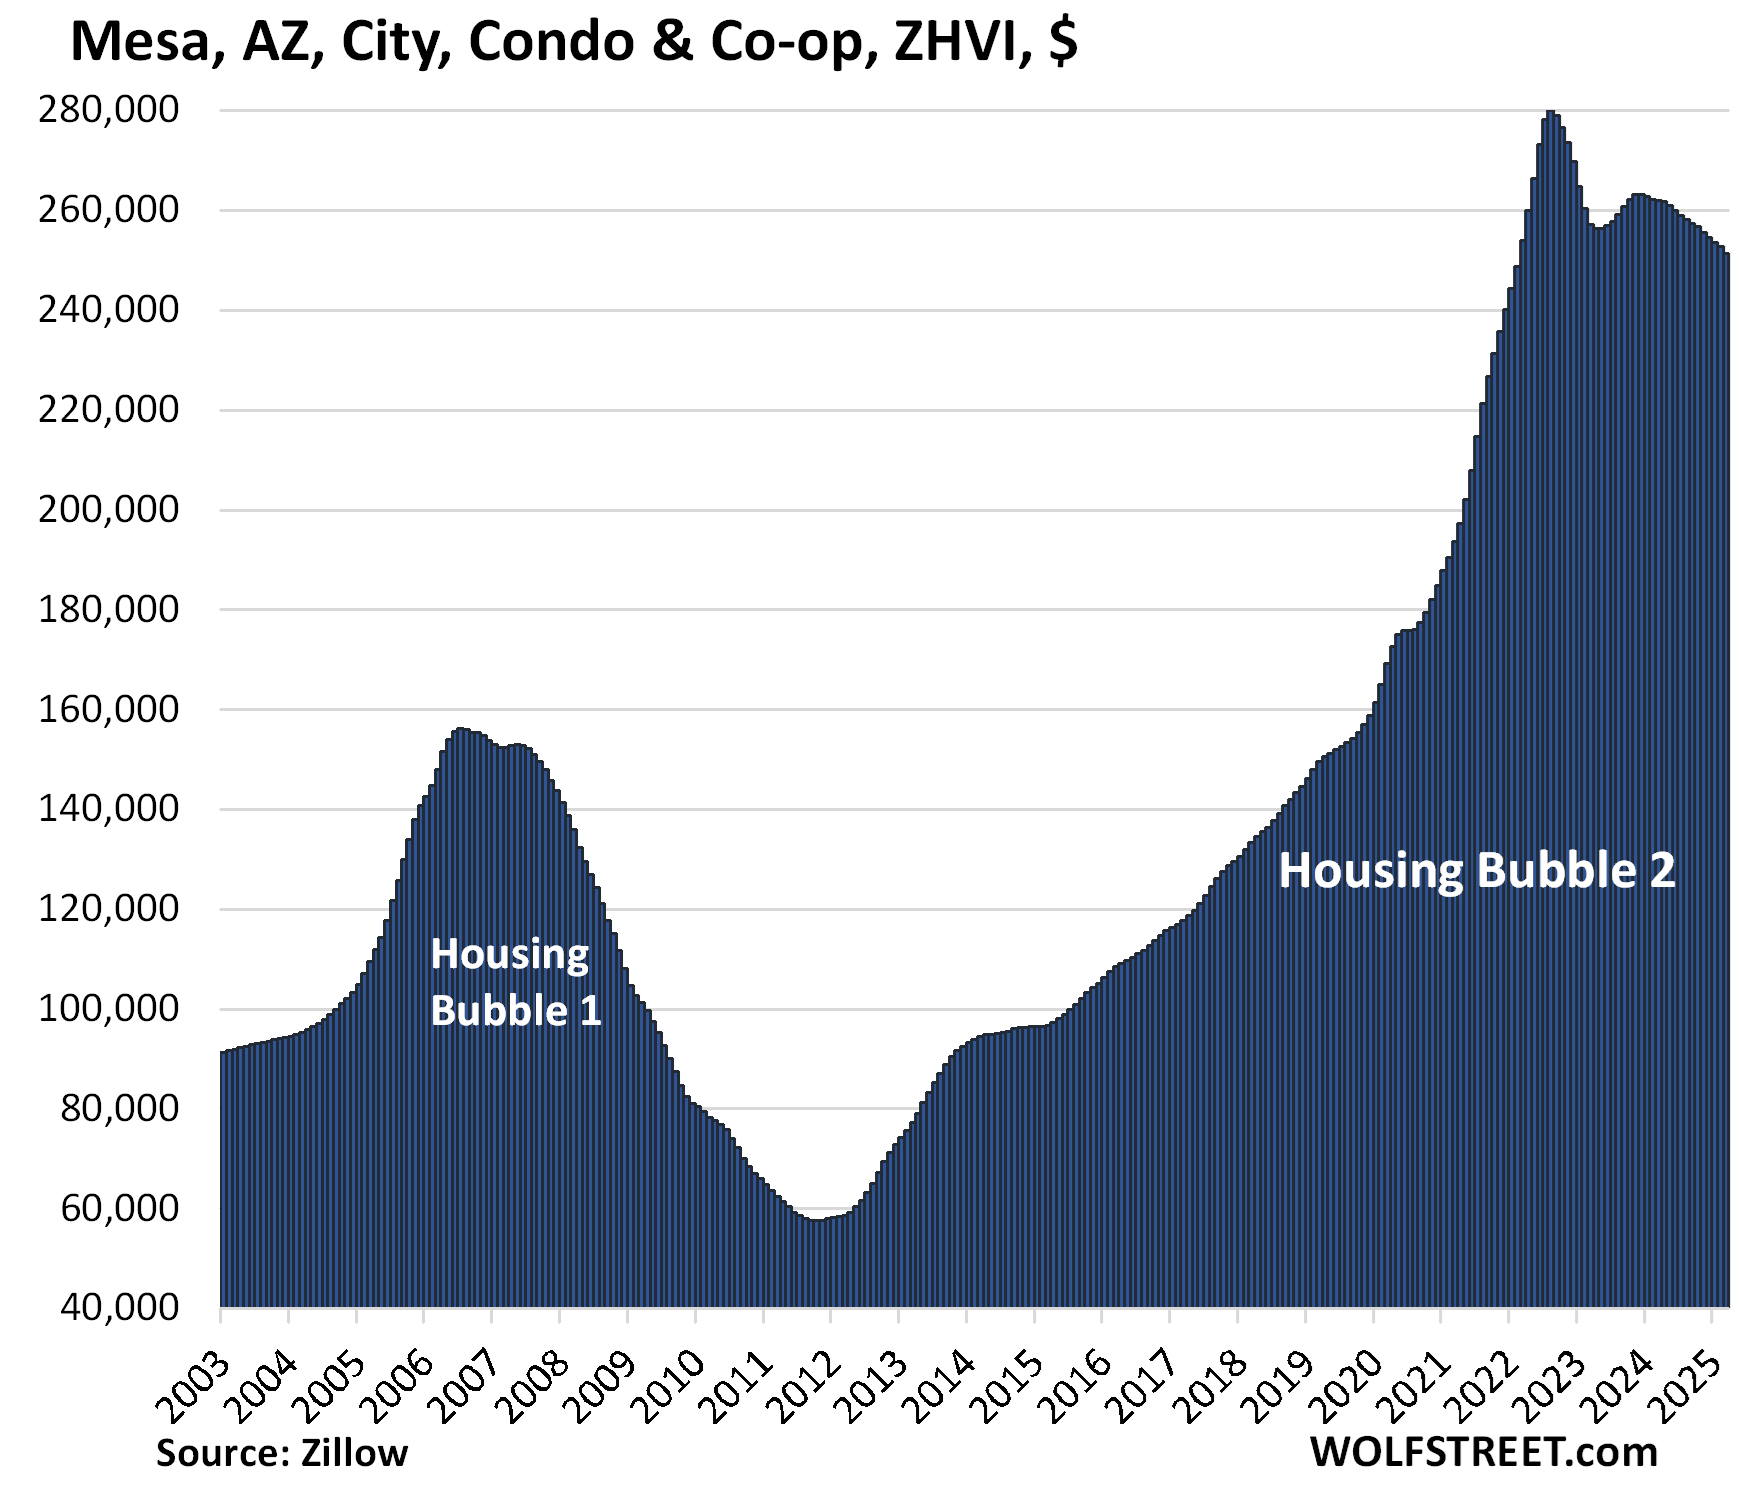
Condos are often the first and biggest movers in local housing markets. Prices exploded in many of them over the three years between mid-2019 and the peak in mid-2022, by 60% such as in Austin, TX; by 70% such as in Tampa, FL, and Chula Vista, San Diego County, CA; or by 80% such as in Mesa, AZ, and Lakeland, FL.
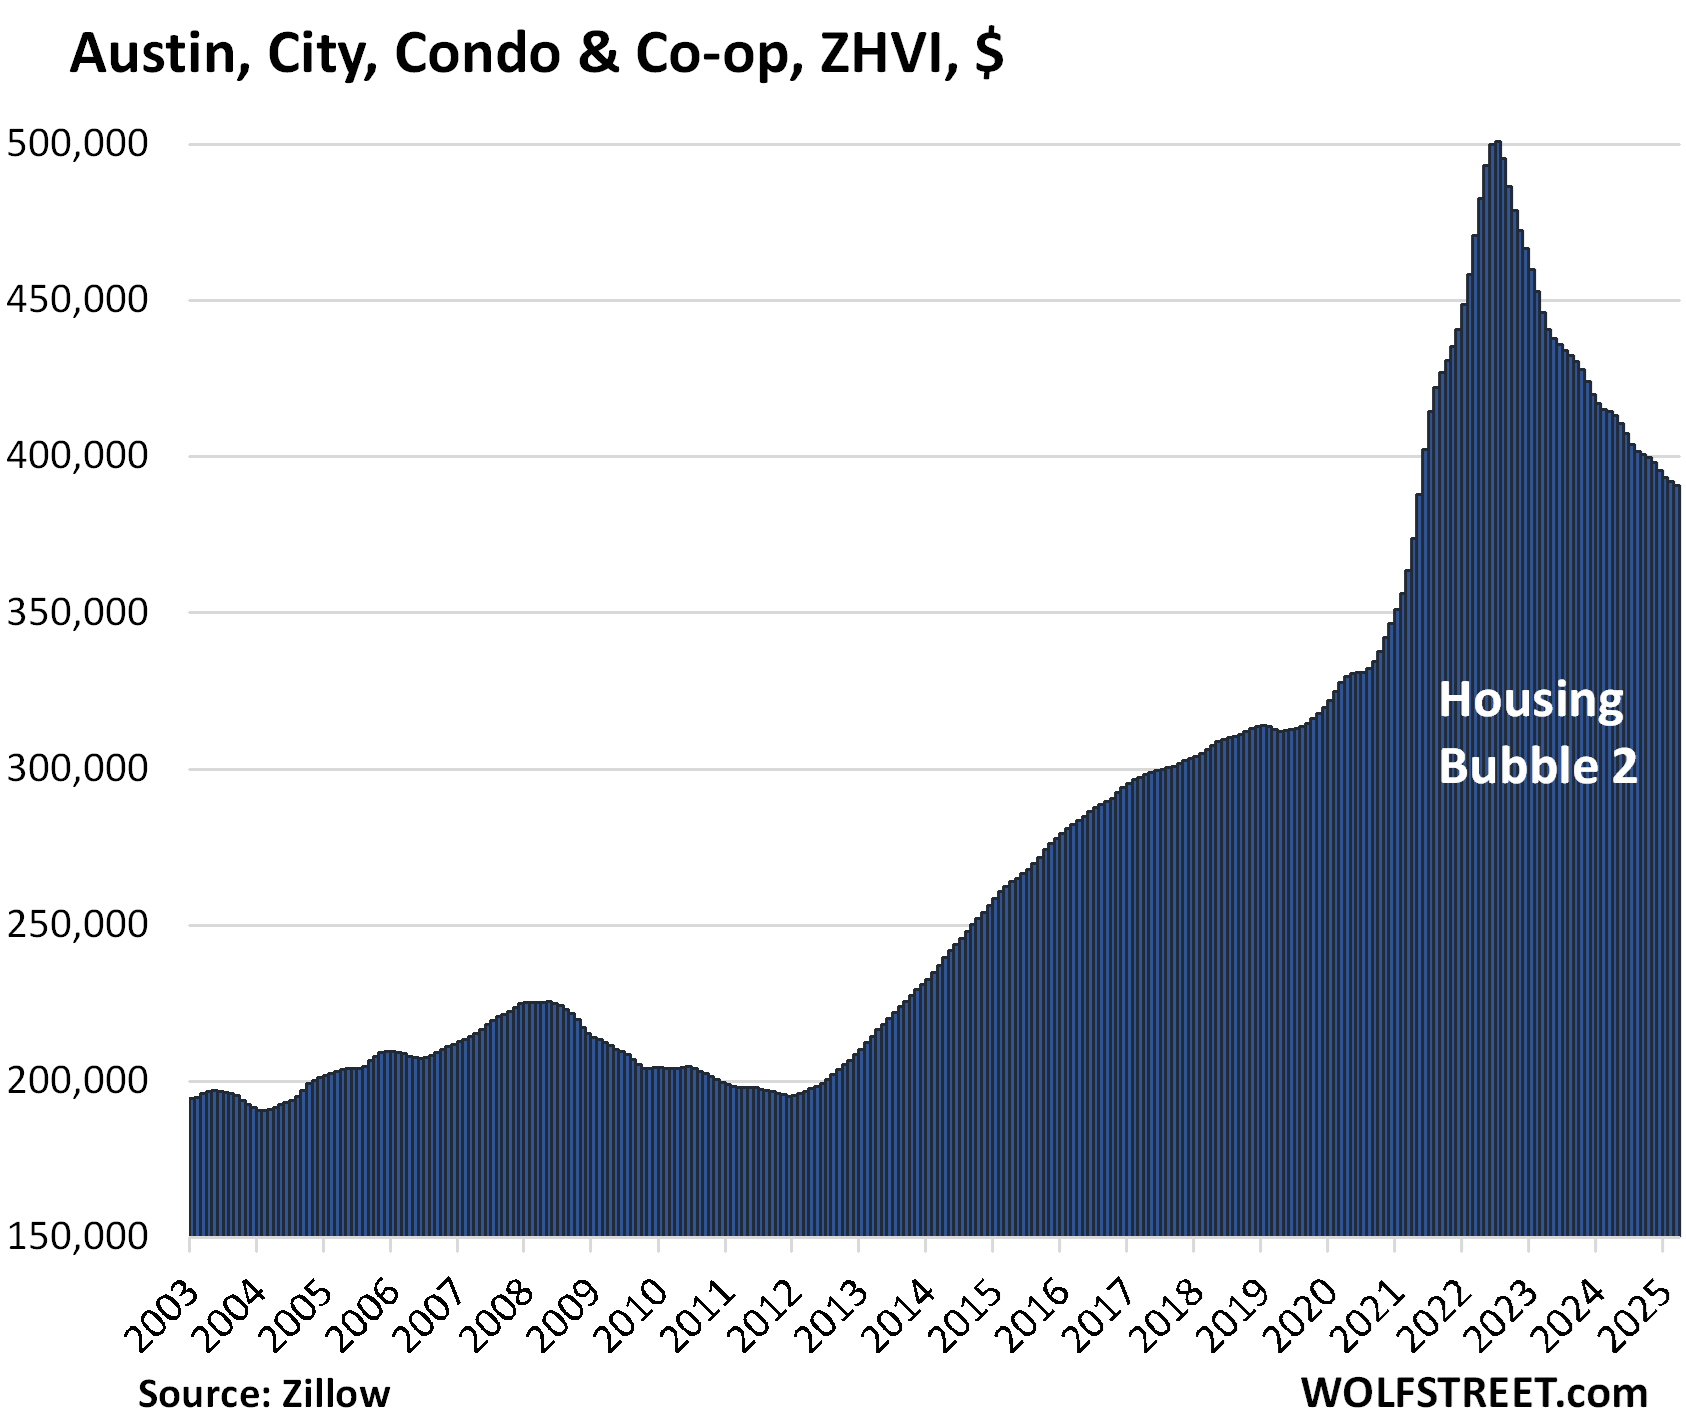
But this absurdity is now coming unglued, and prices have begun spiraling down. In Austin, which is on the forefront of this movement, prices have already given up nearly two-thirds of the 60% three-year gain. People who bought at the top in mid-2022 are 22% underwater. People who bought in mid-2019 are still sitting on a 20% gain that is shrinking.
Price drops from peak (charts below):
- Austin, TX: -22%
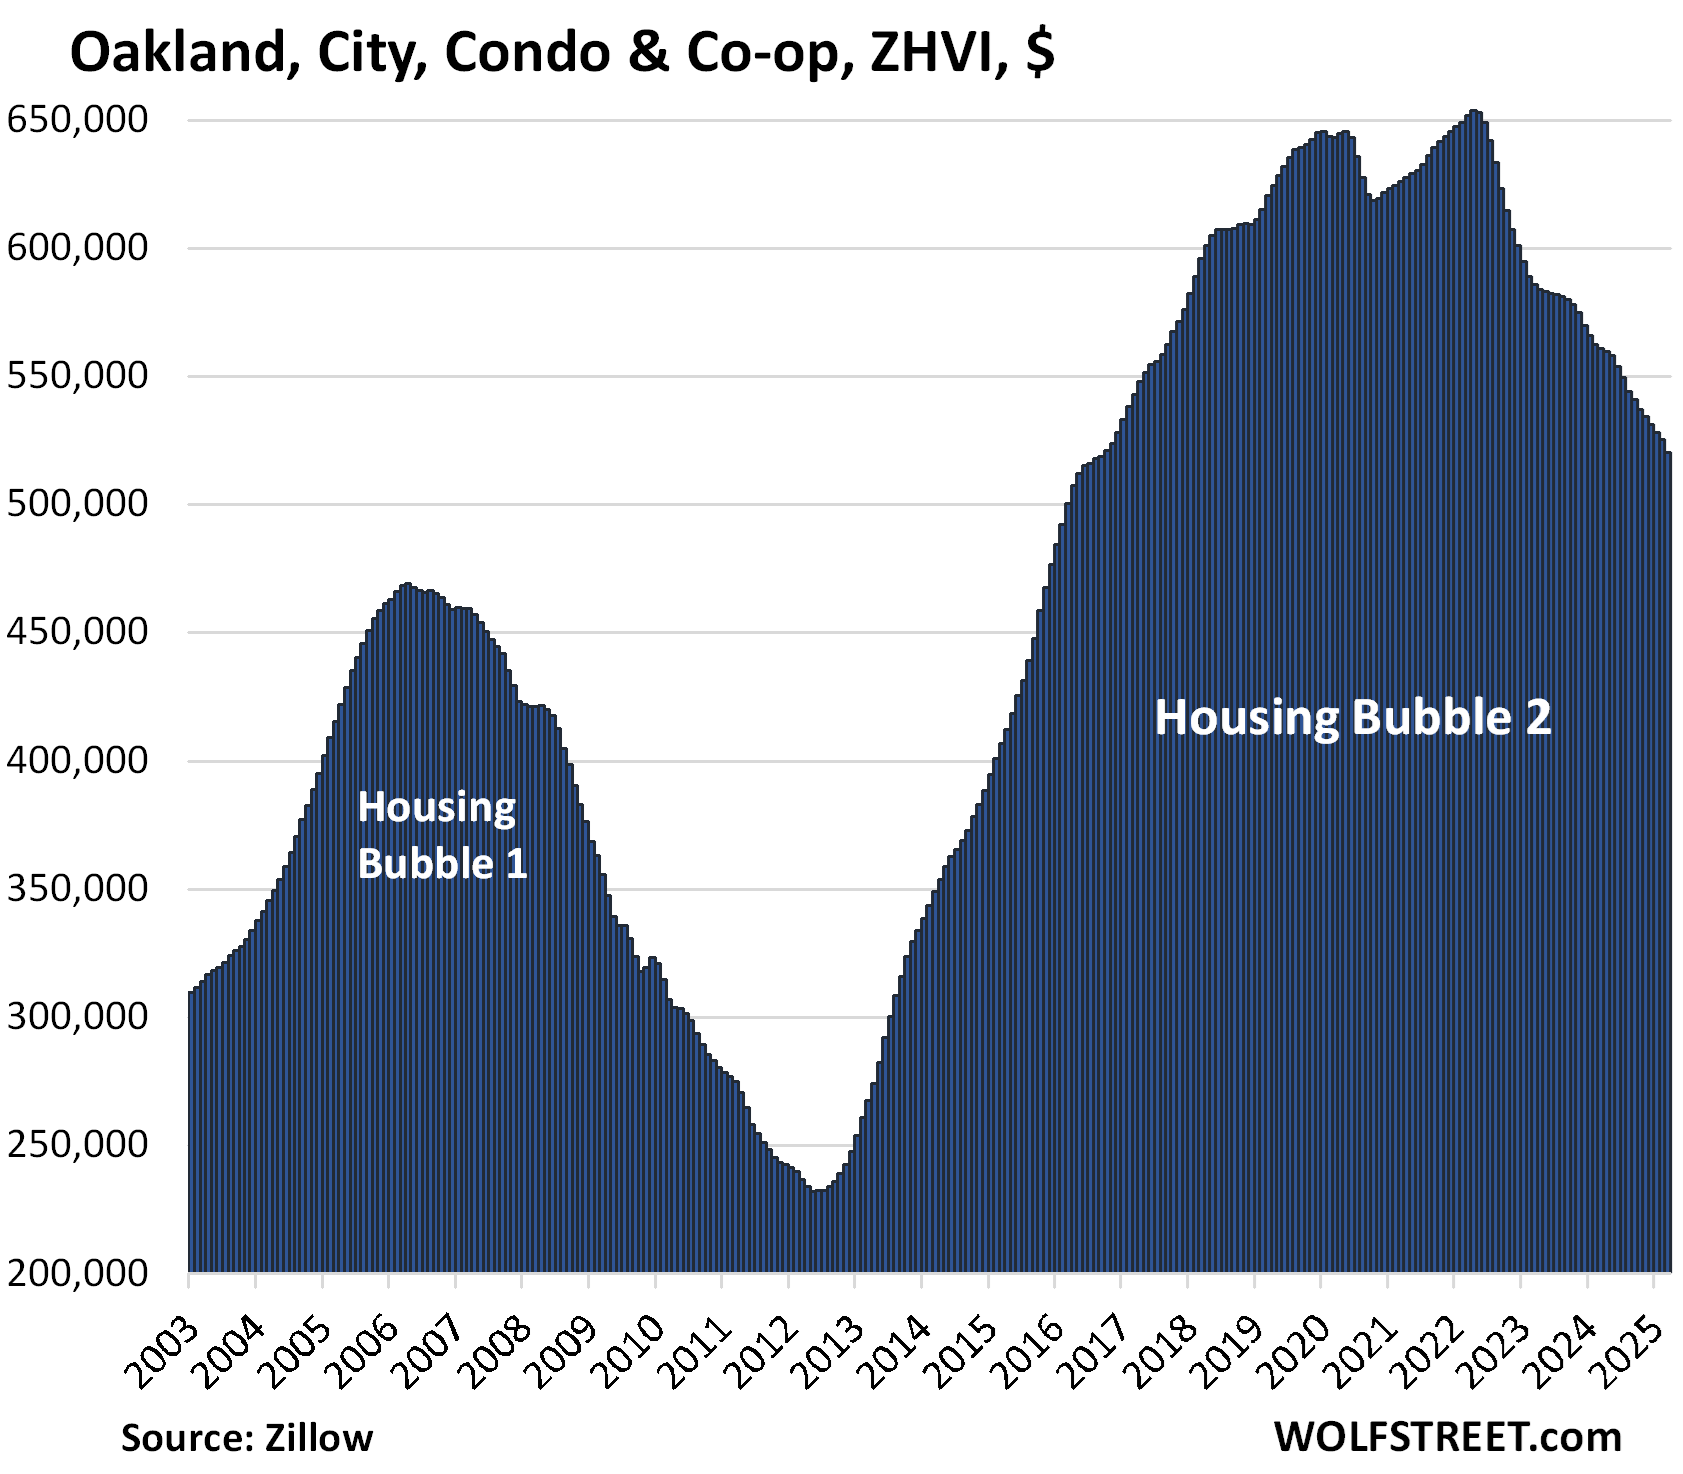
- Oakland, CA: -20%
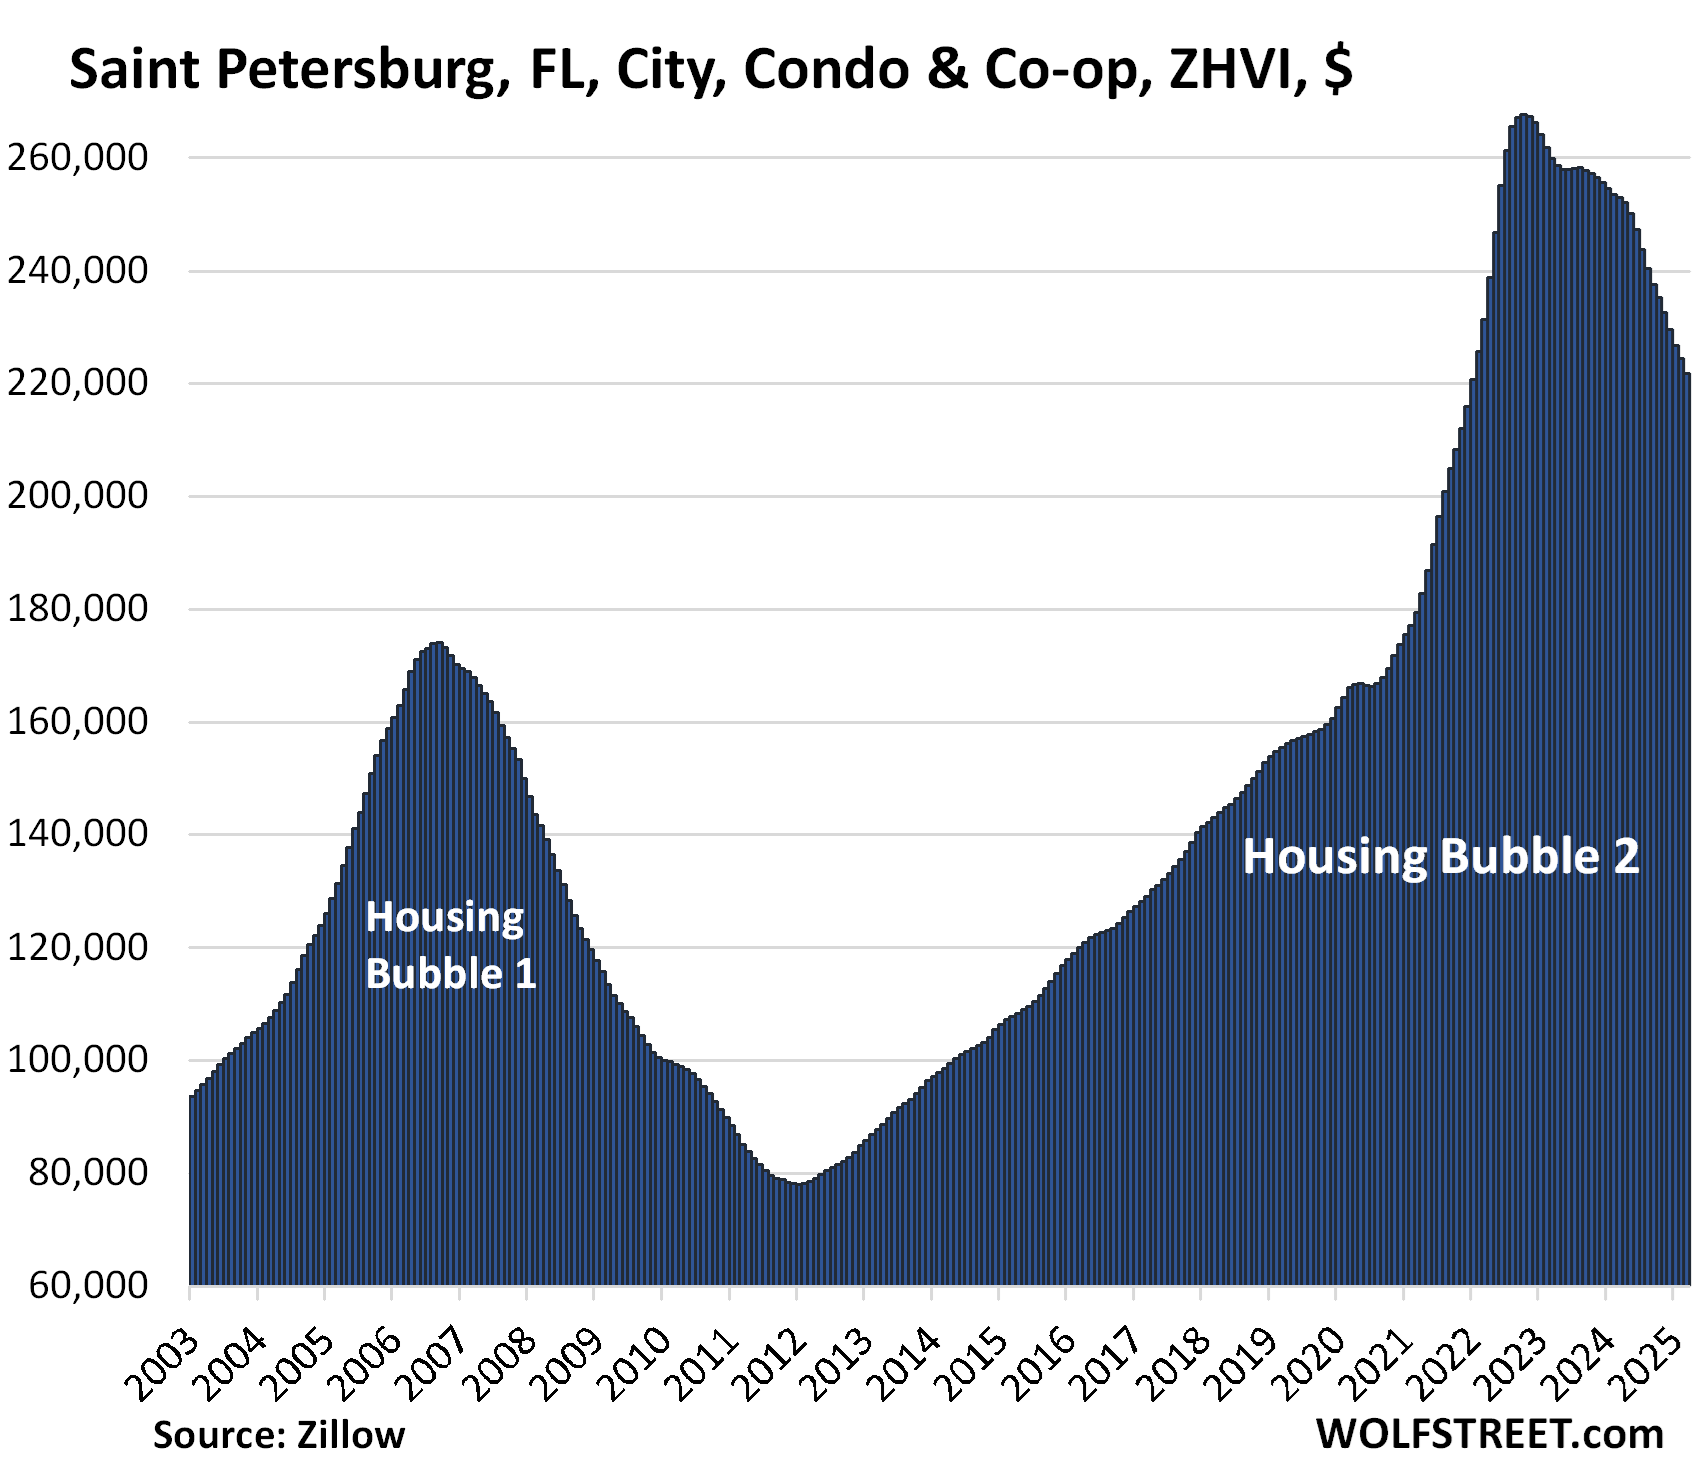
- Saint Petersburg, FL: -17%
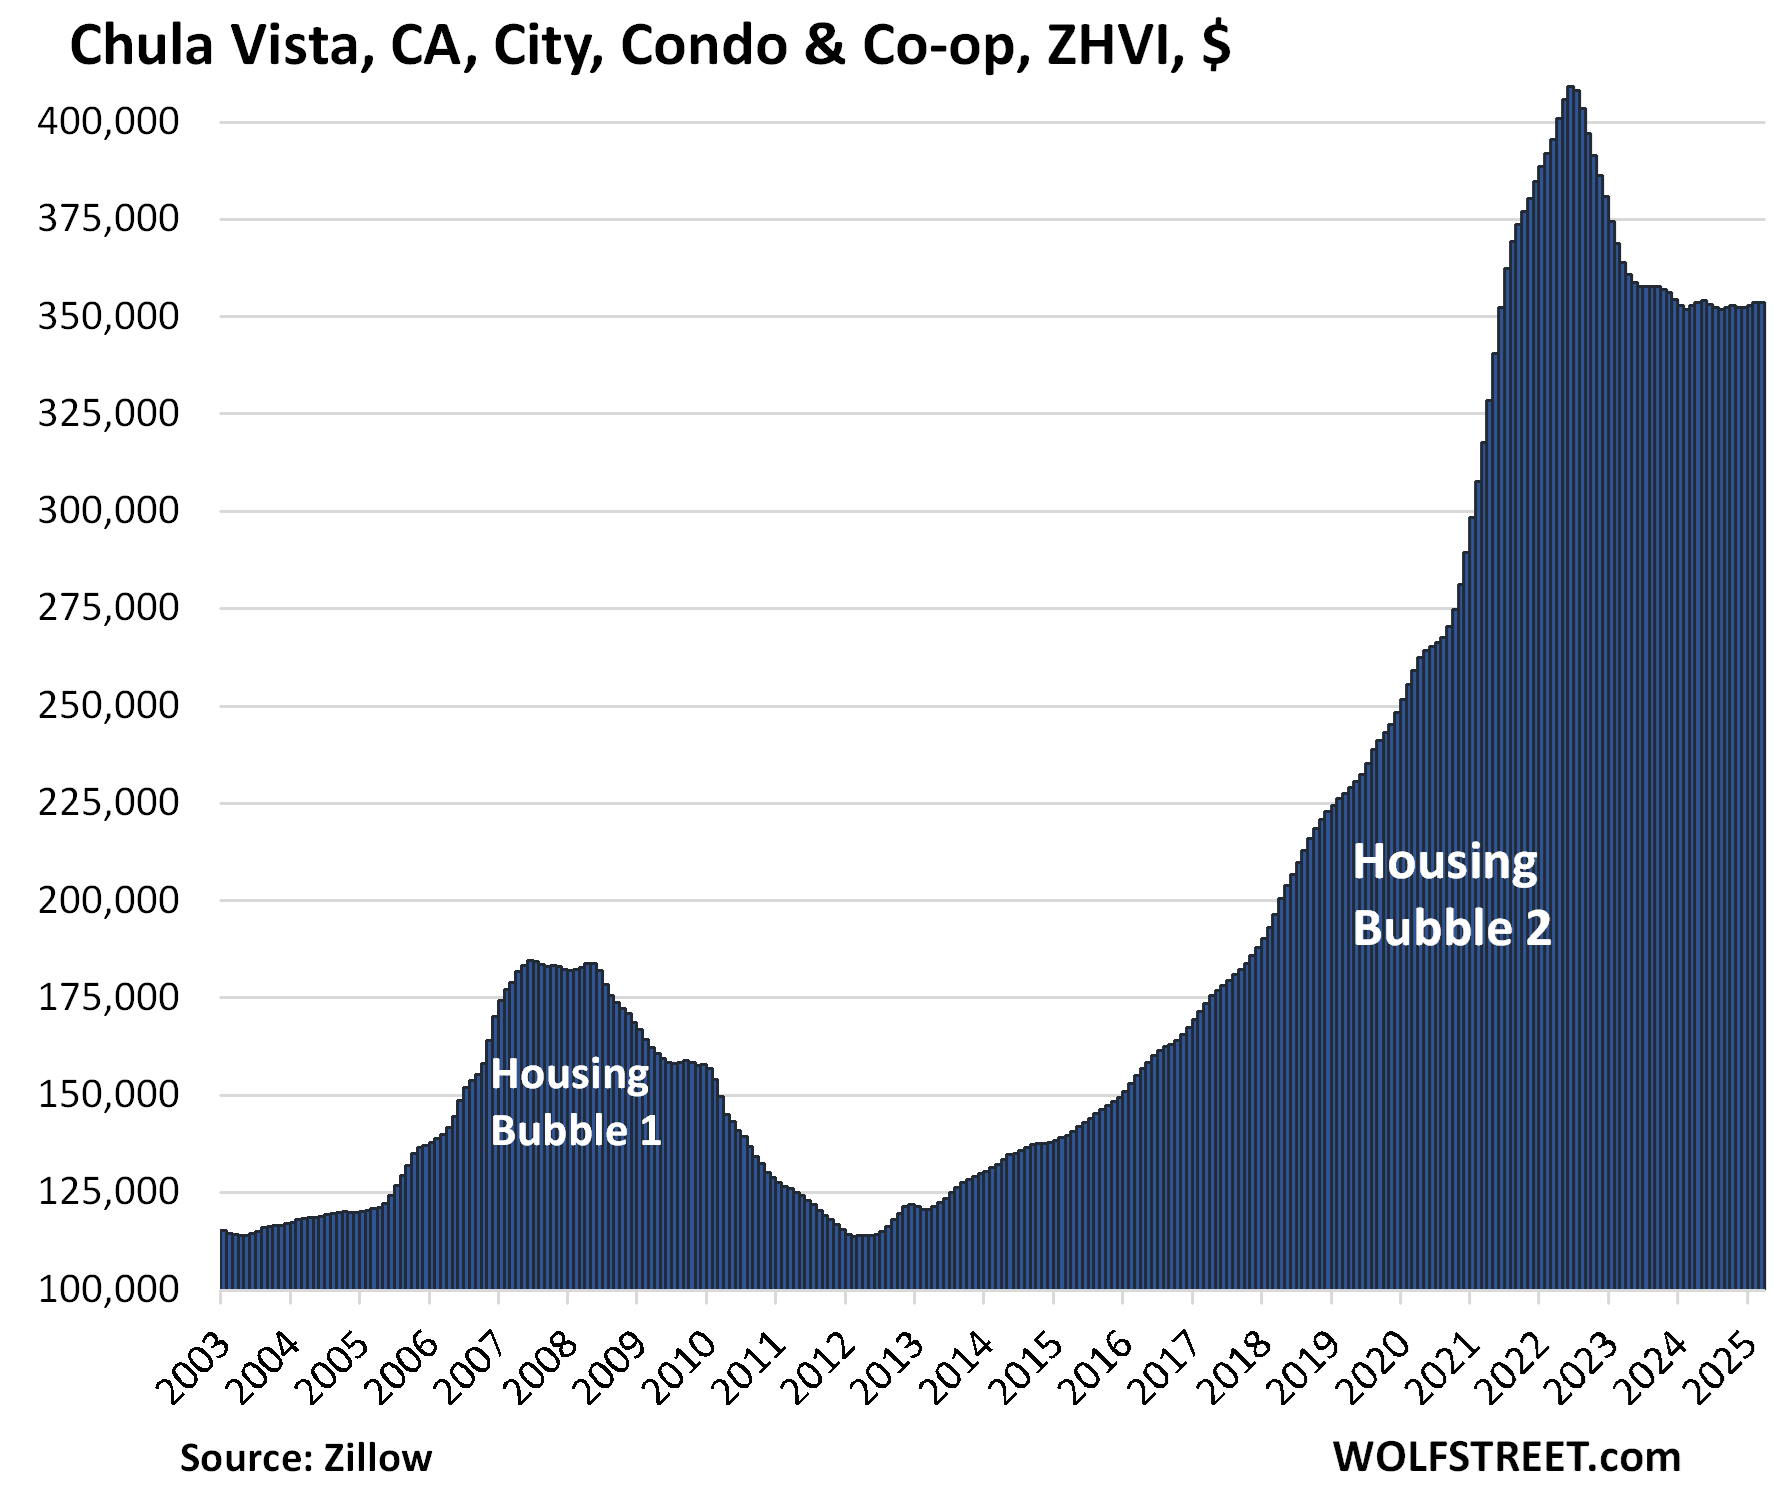
- Chula Vista, CA: -14%
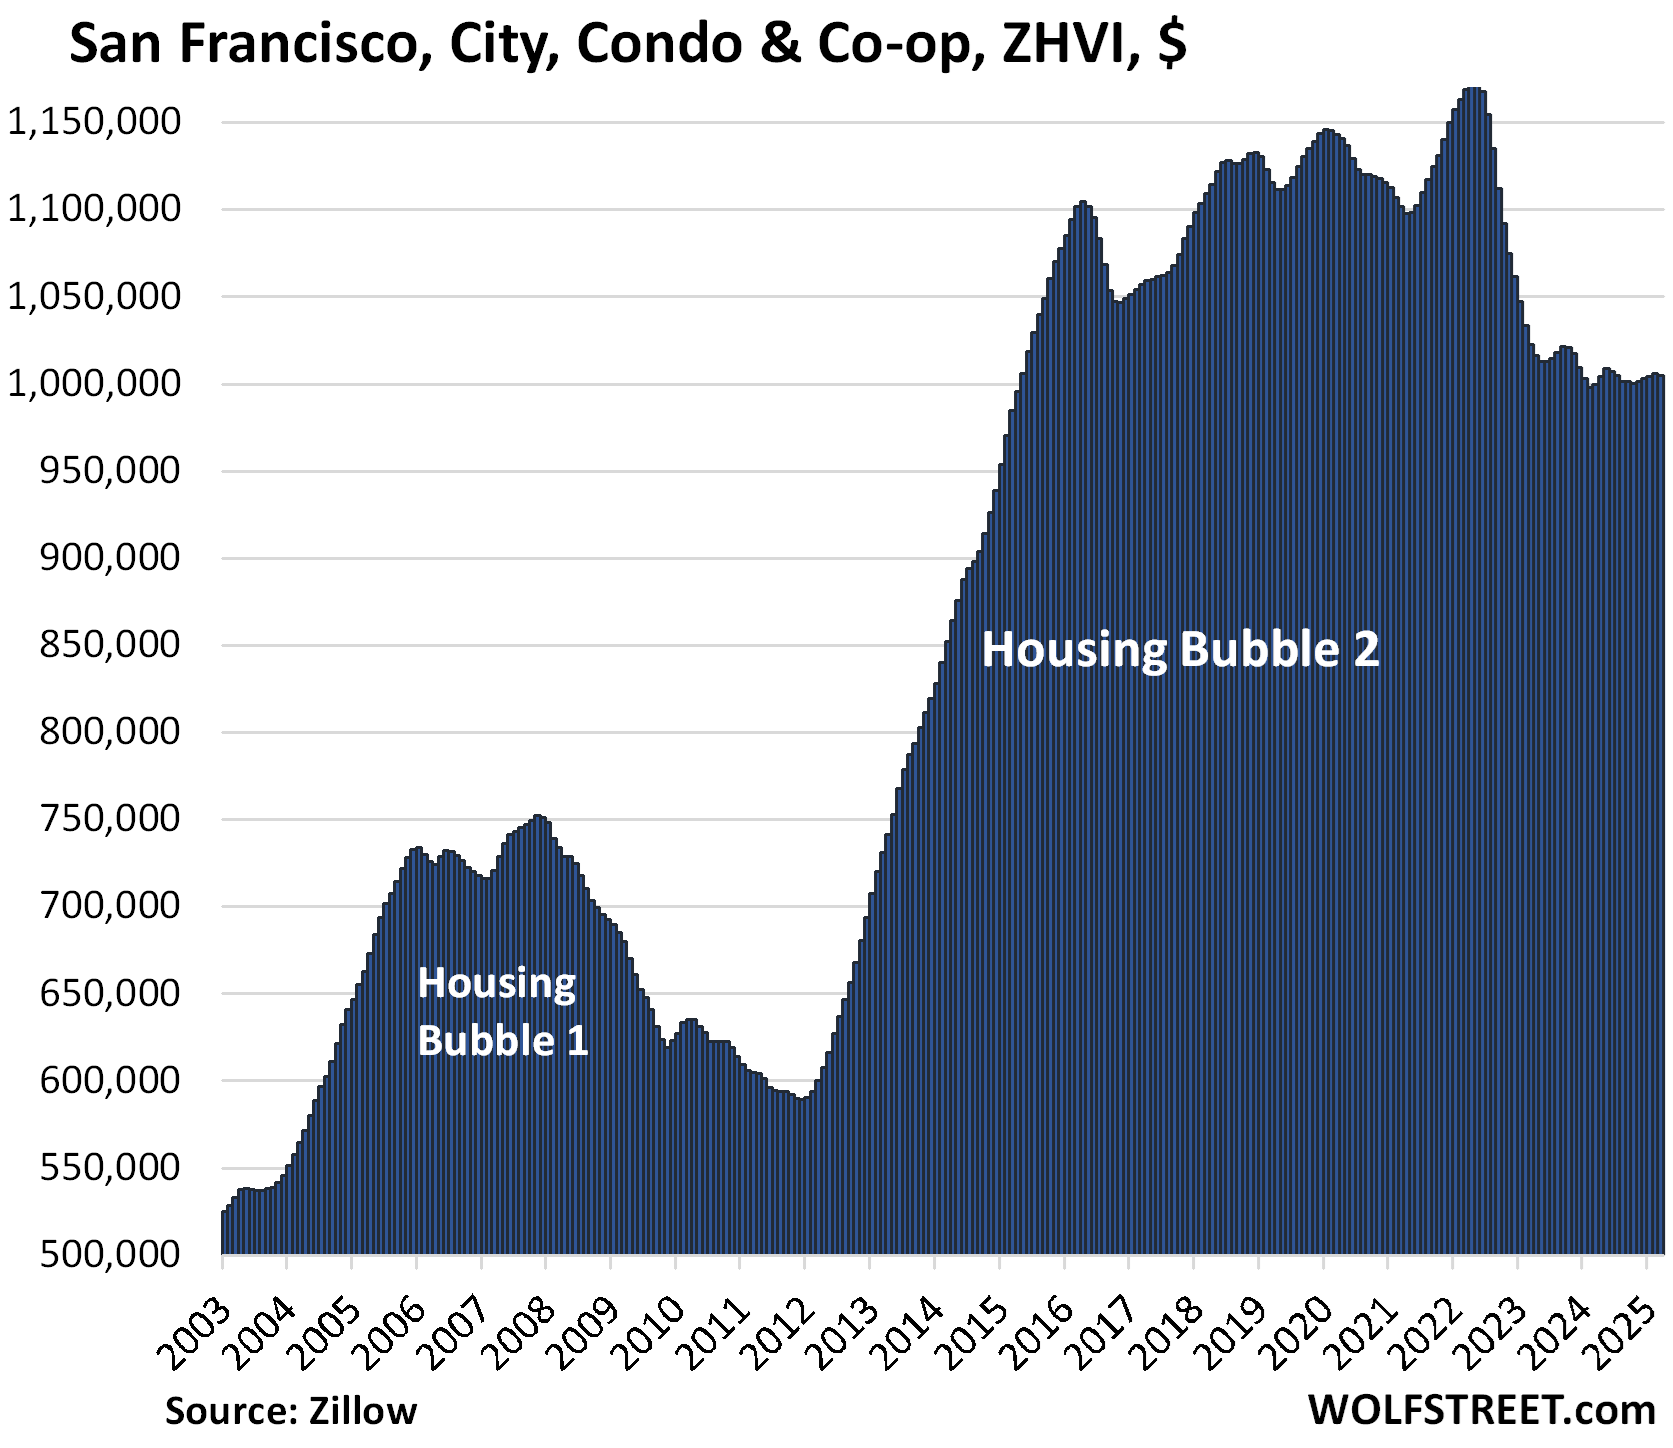
- San Francisco, CA: -14%
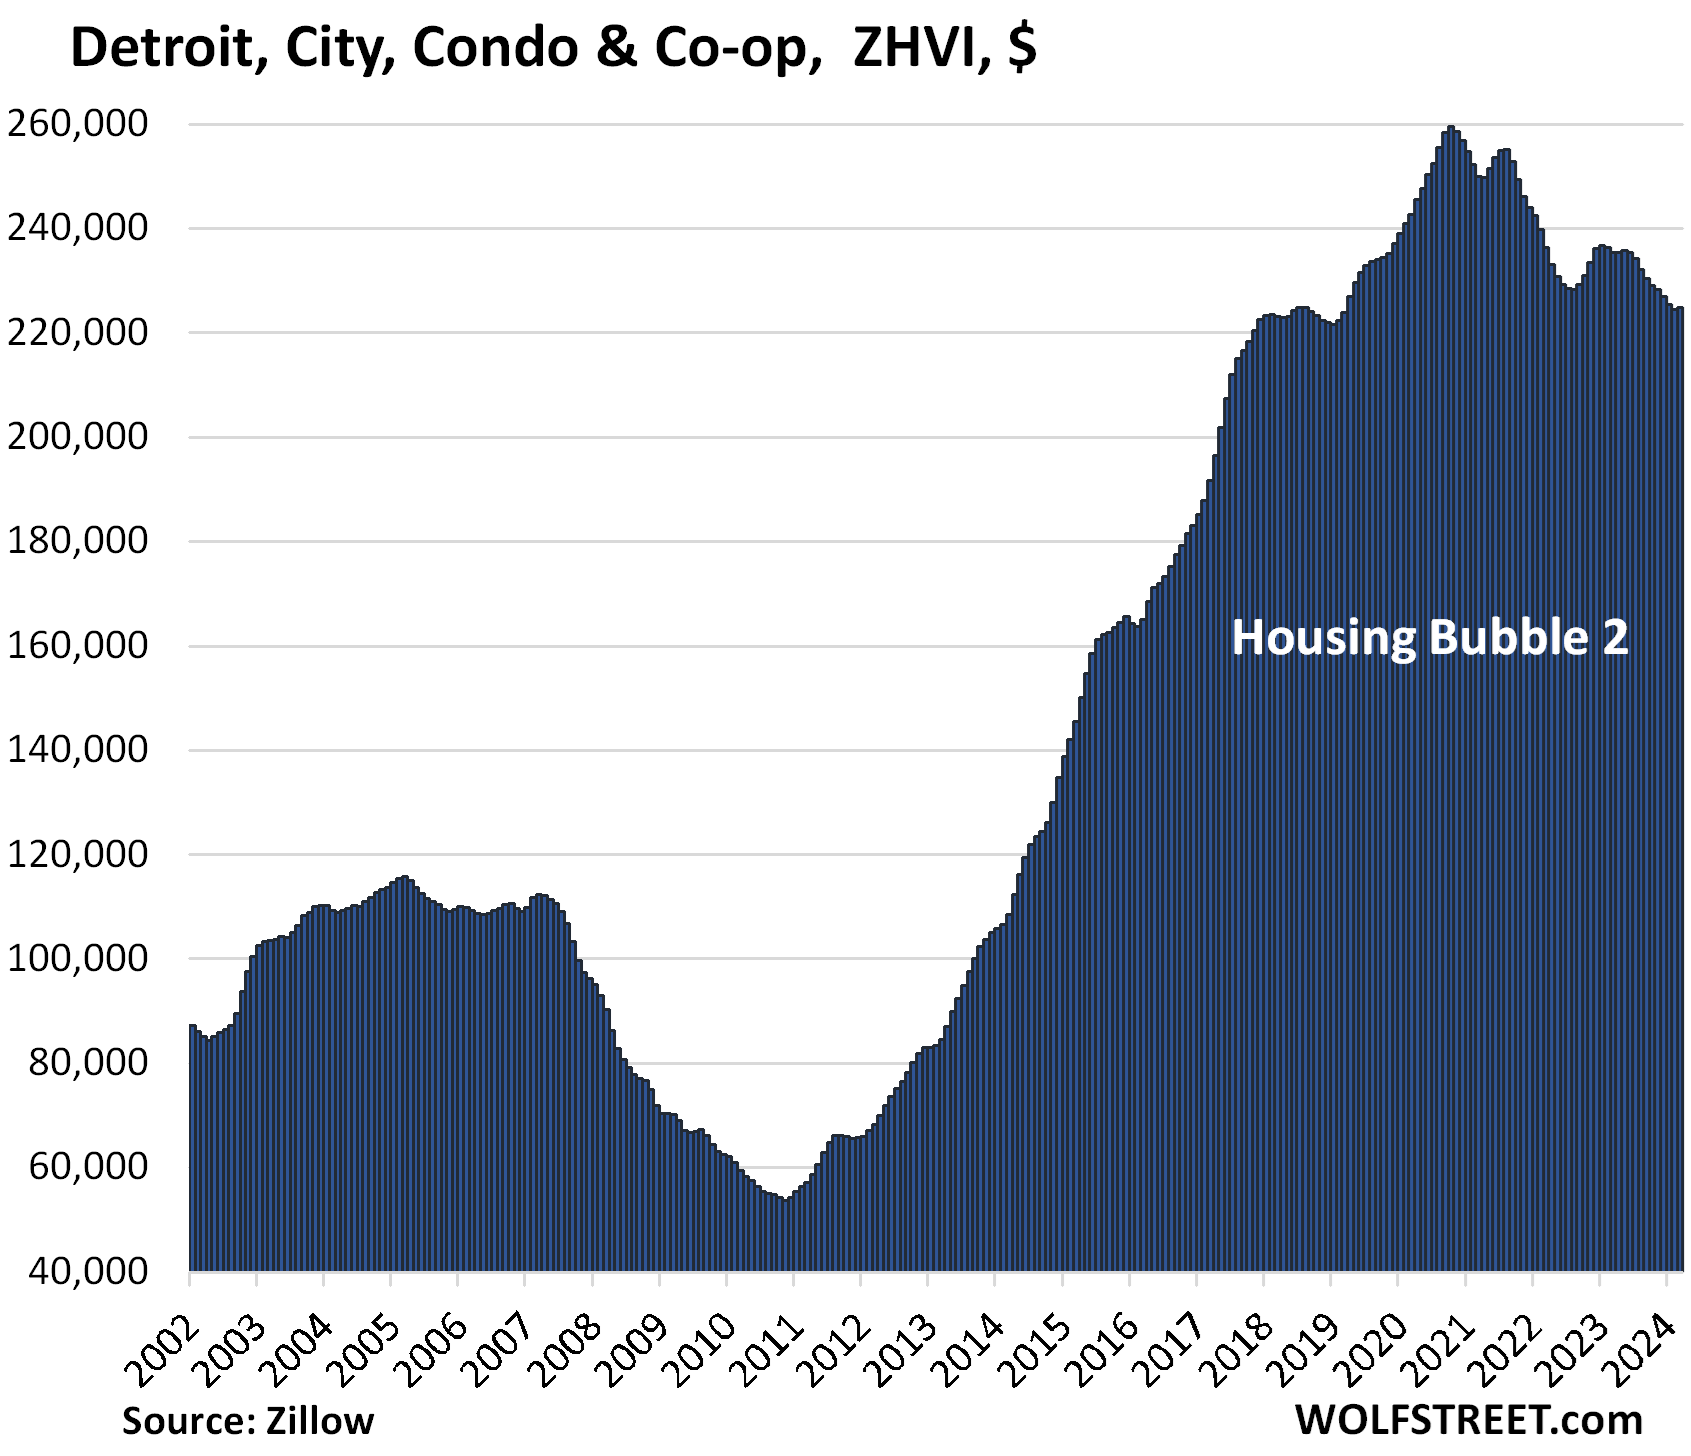
- Detroit, MI: -13%
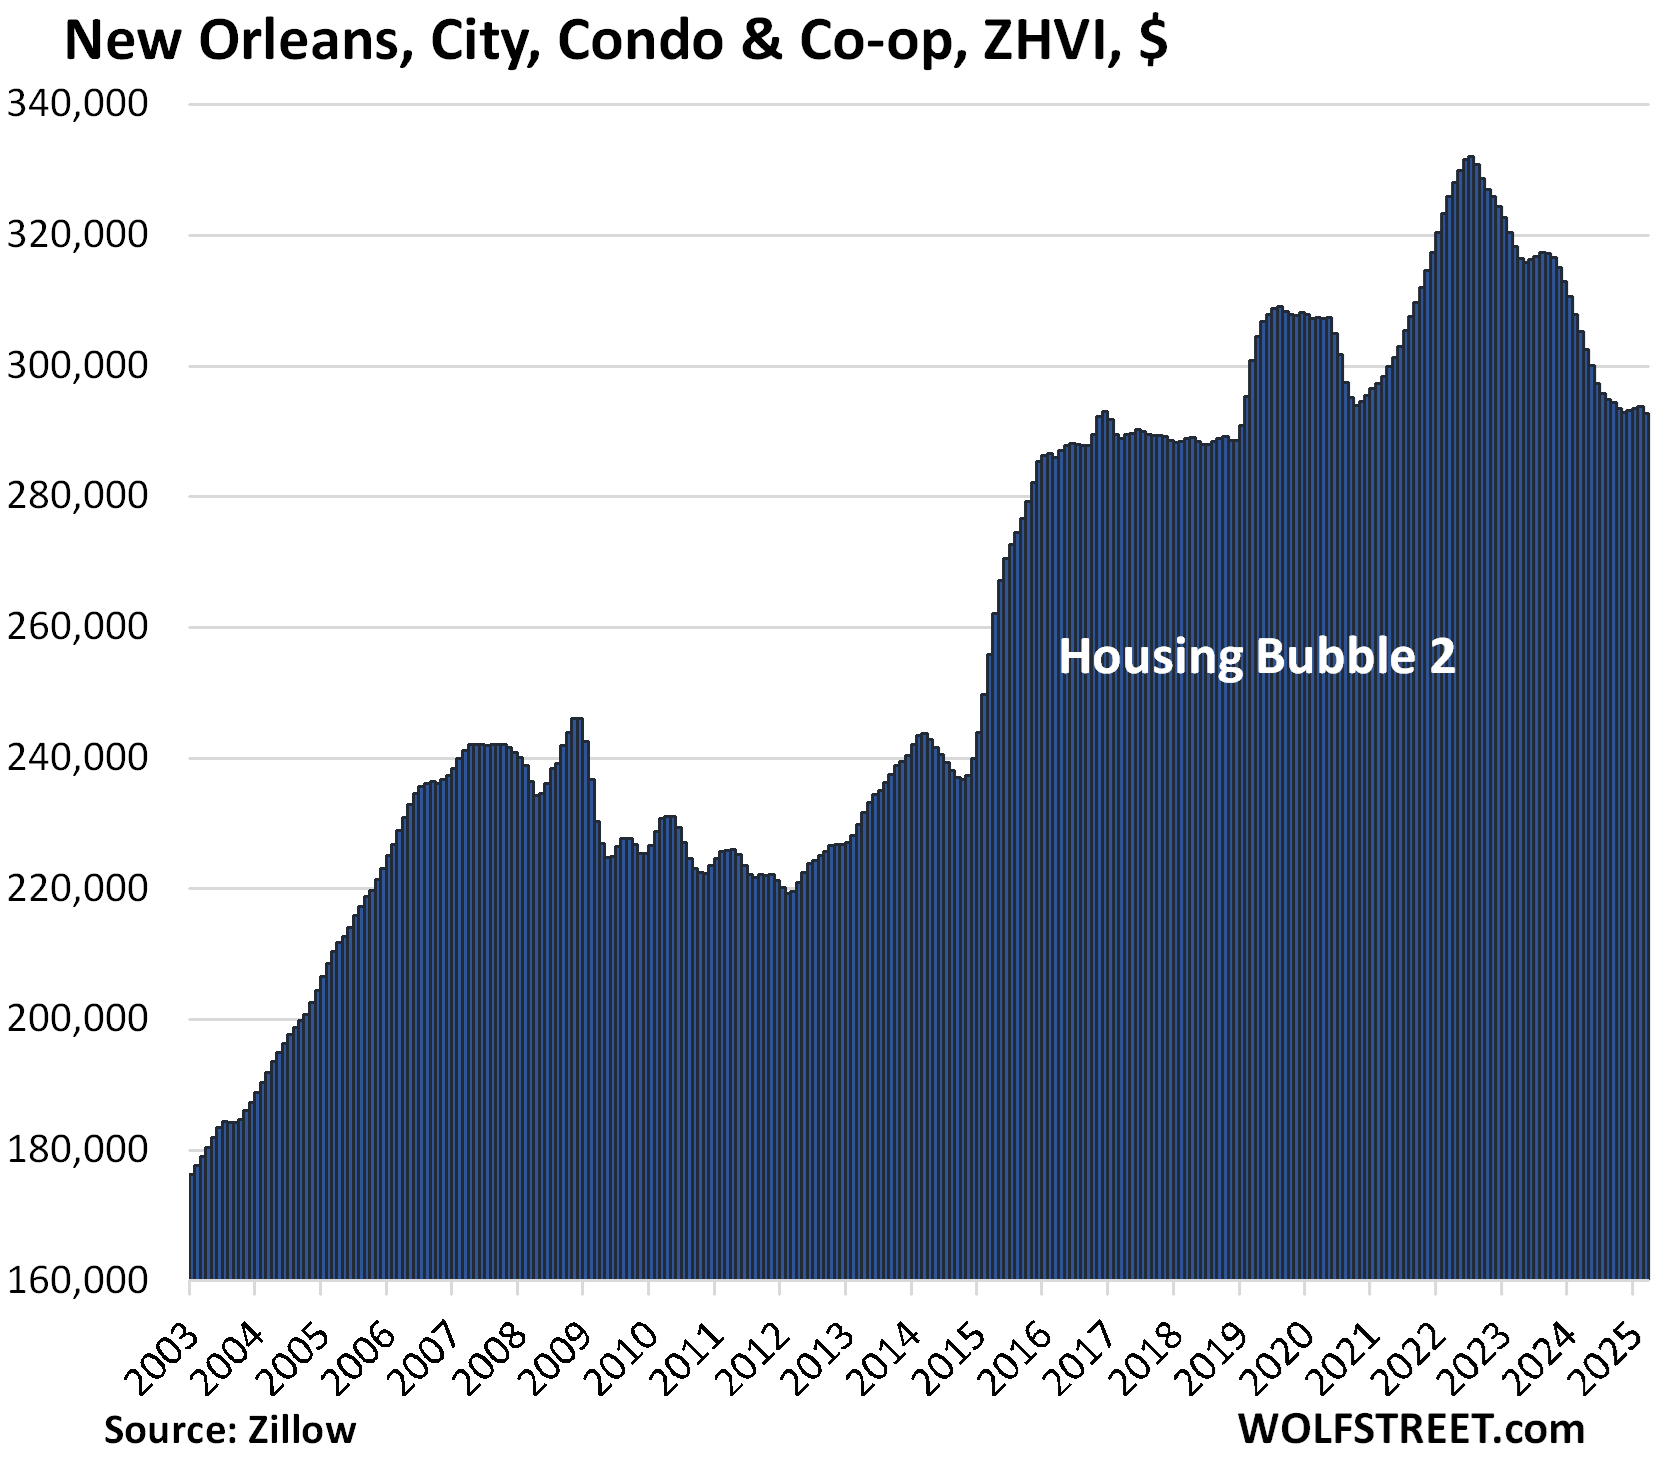
- New Orleans, LA: -12%
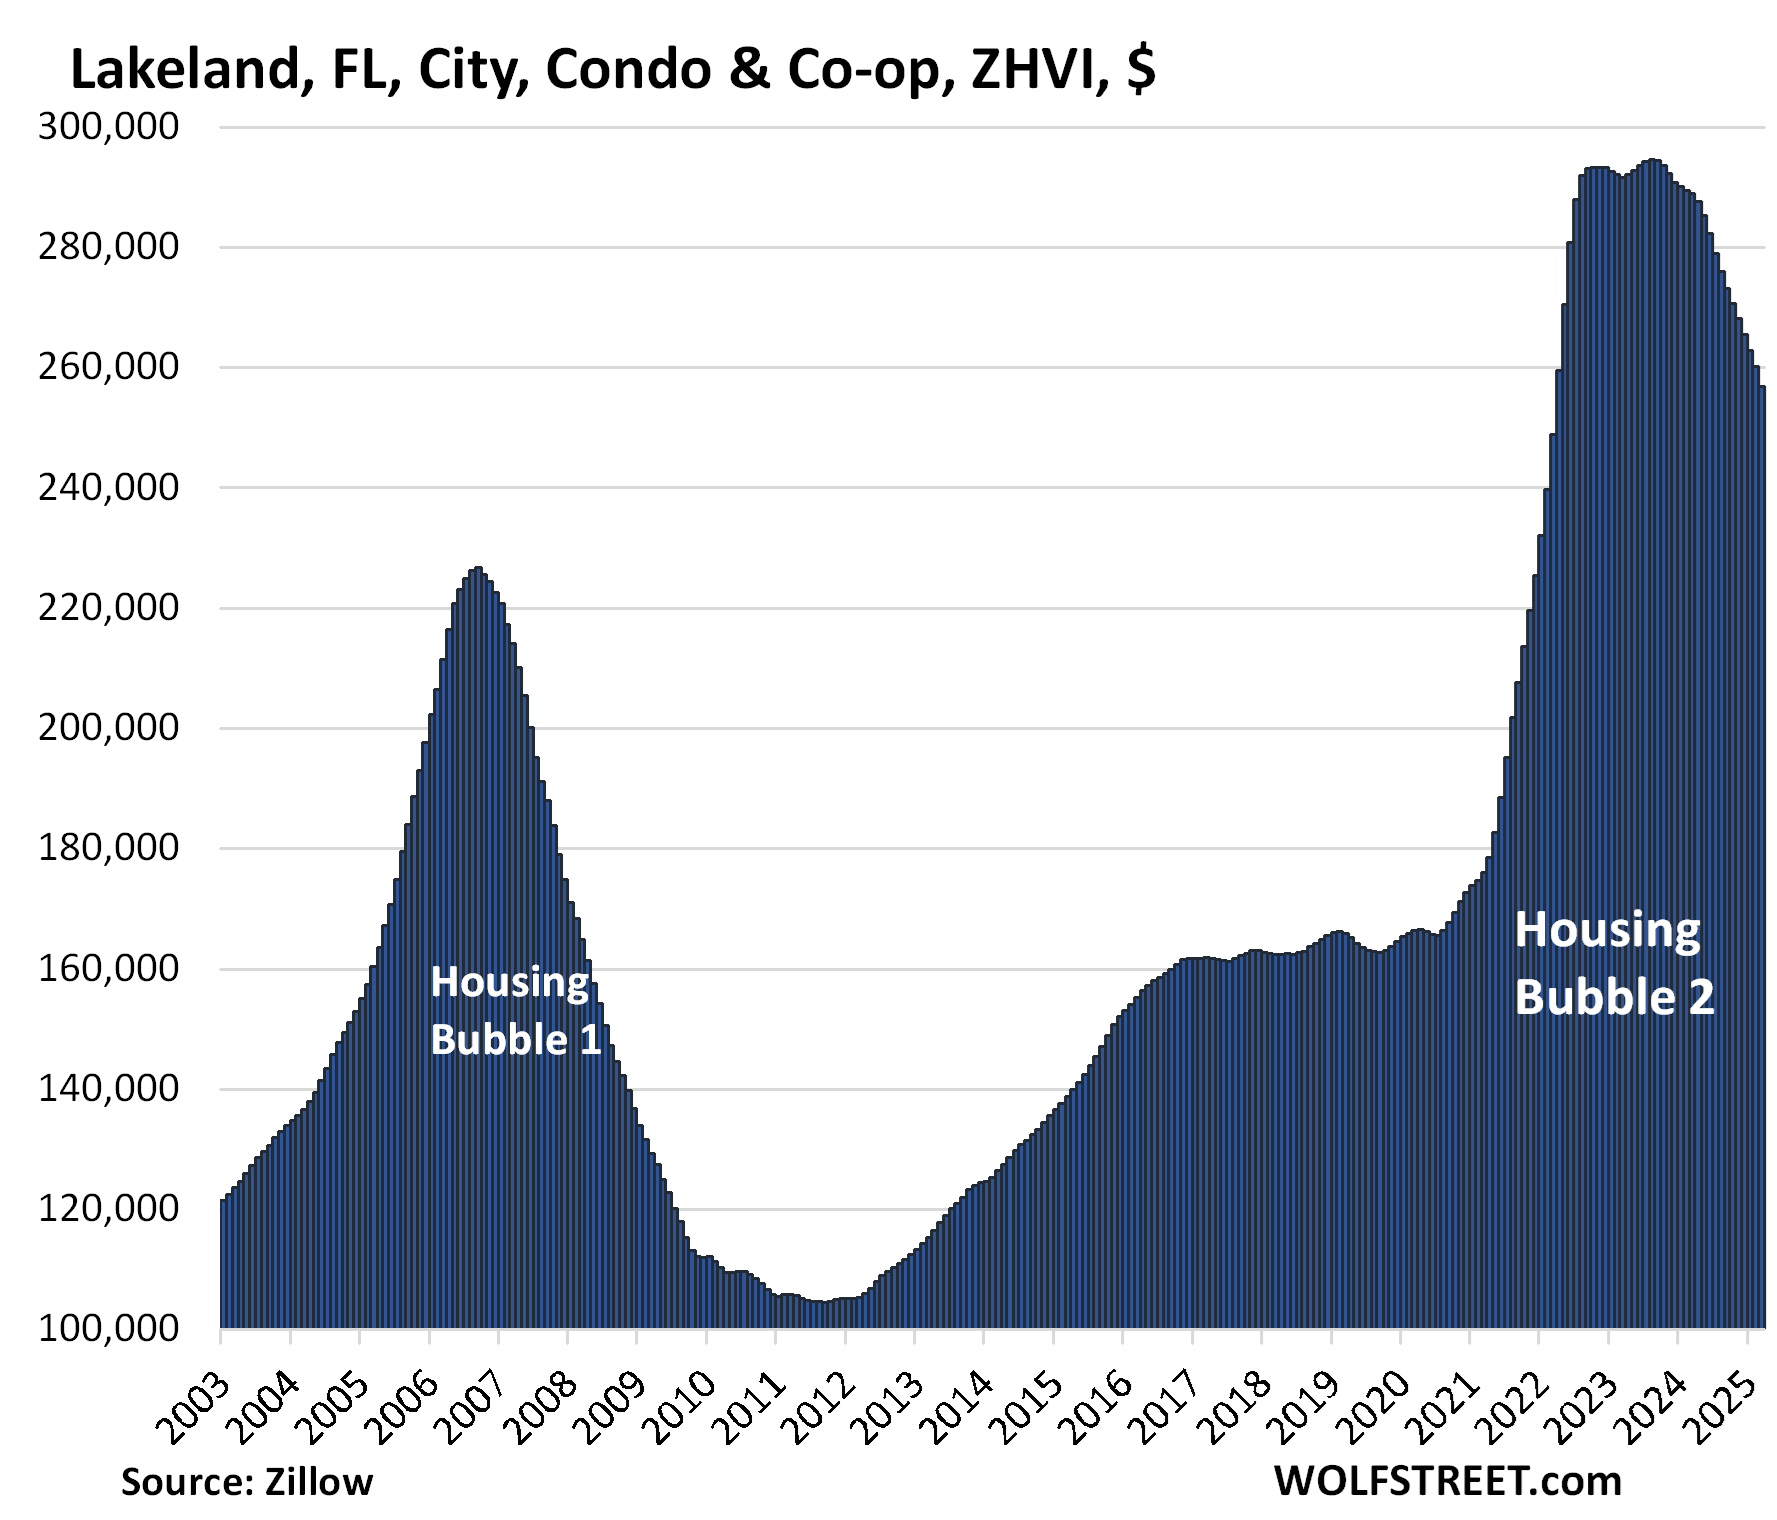
- Lakeland, FL: -13%
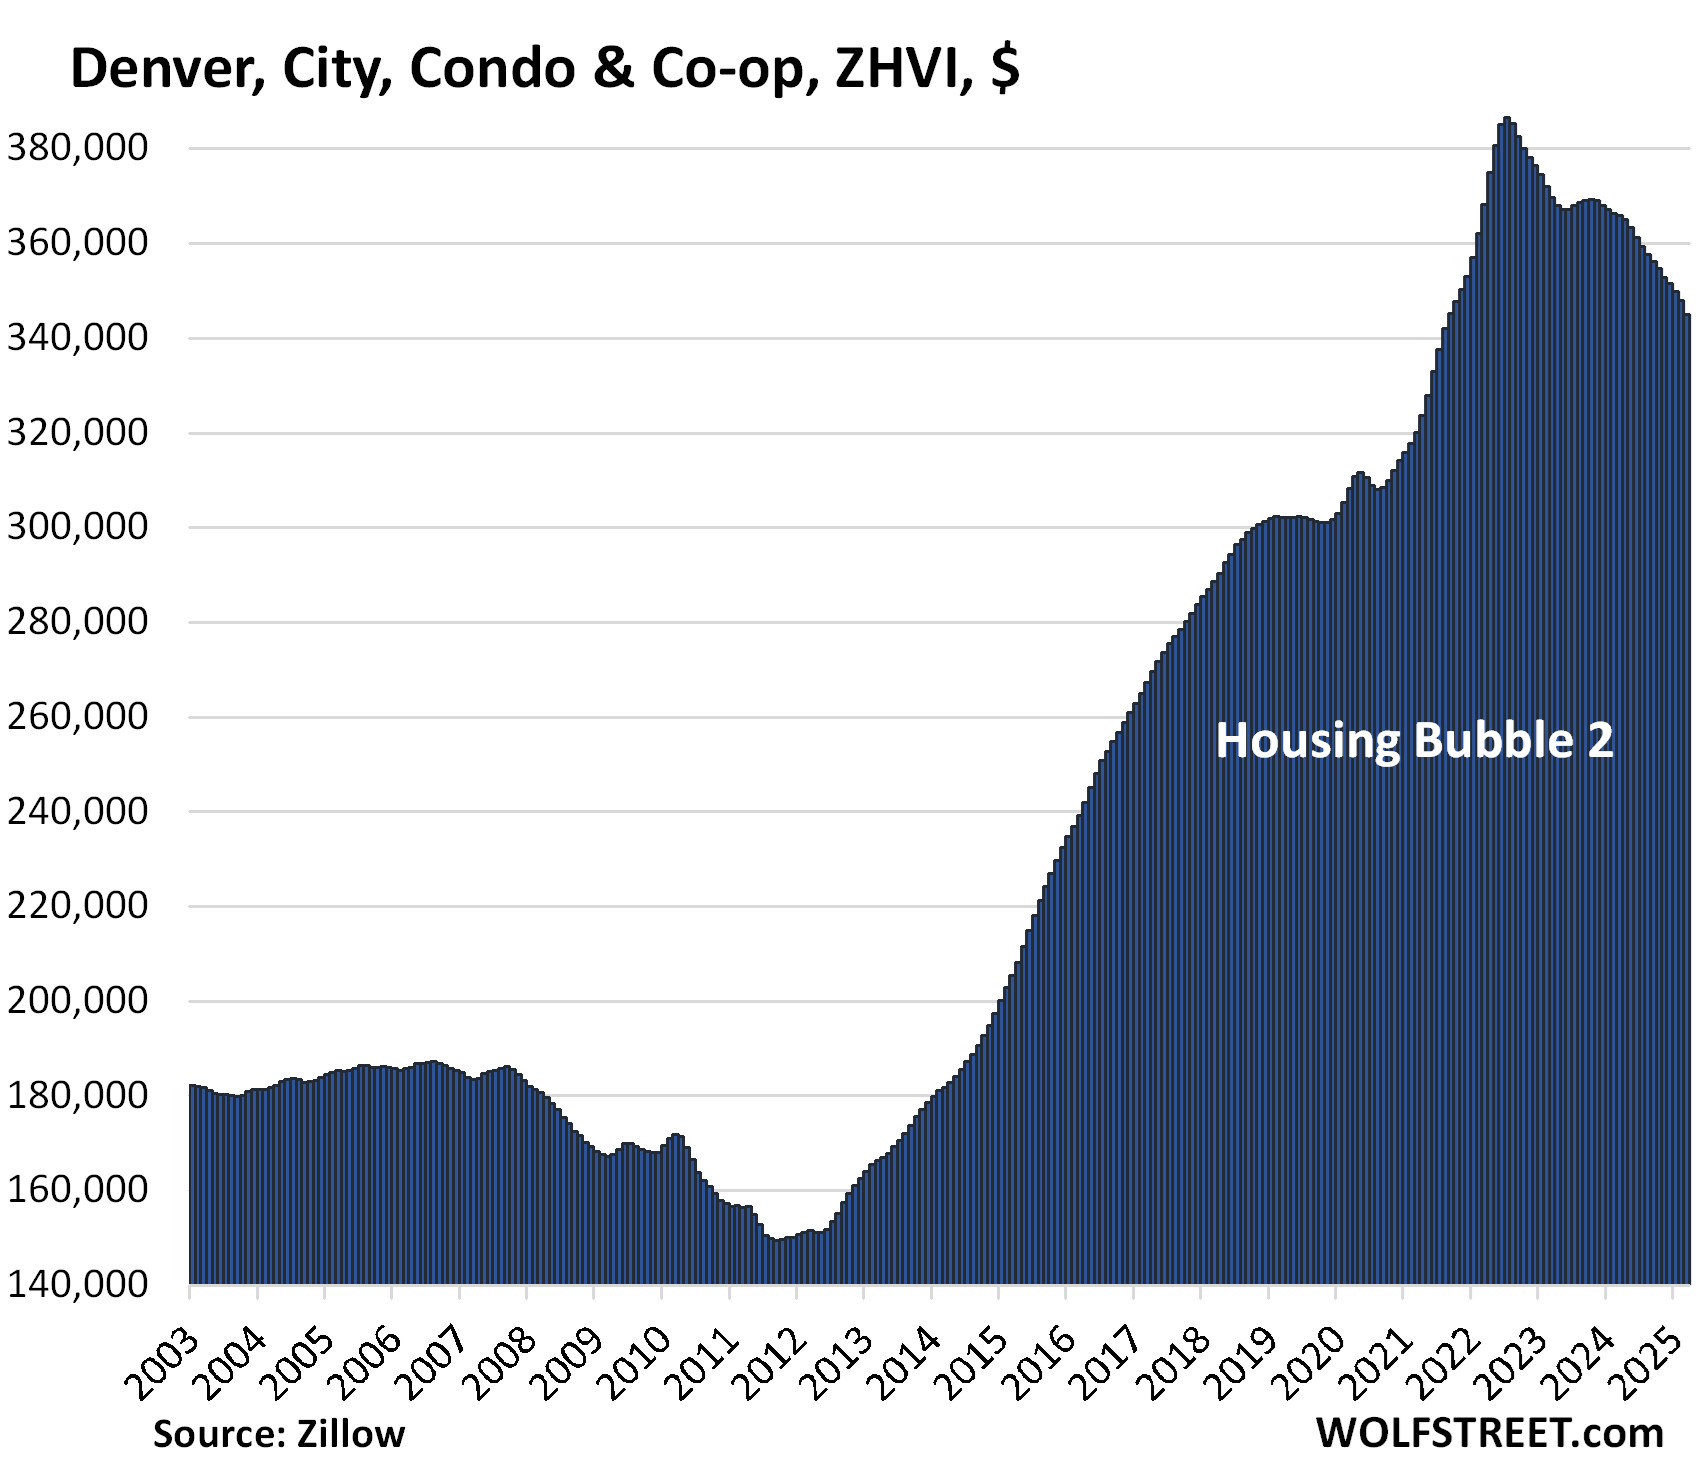
- Denver, CO: -11%
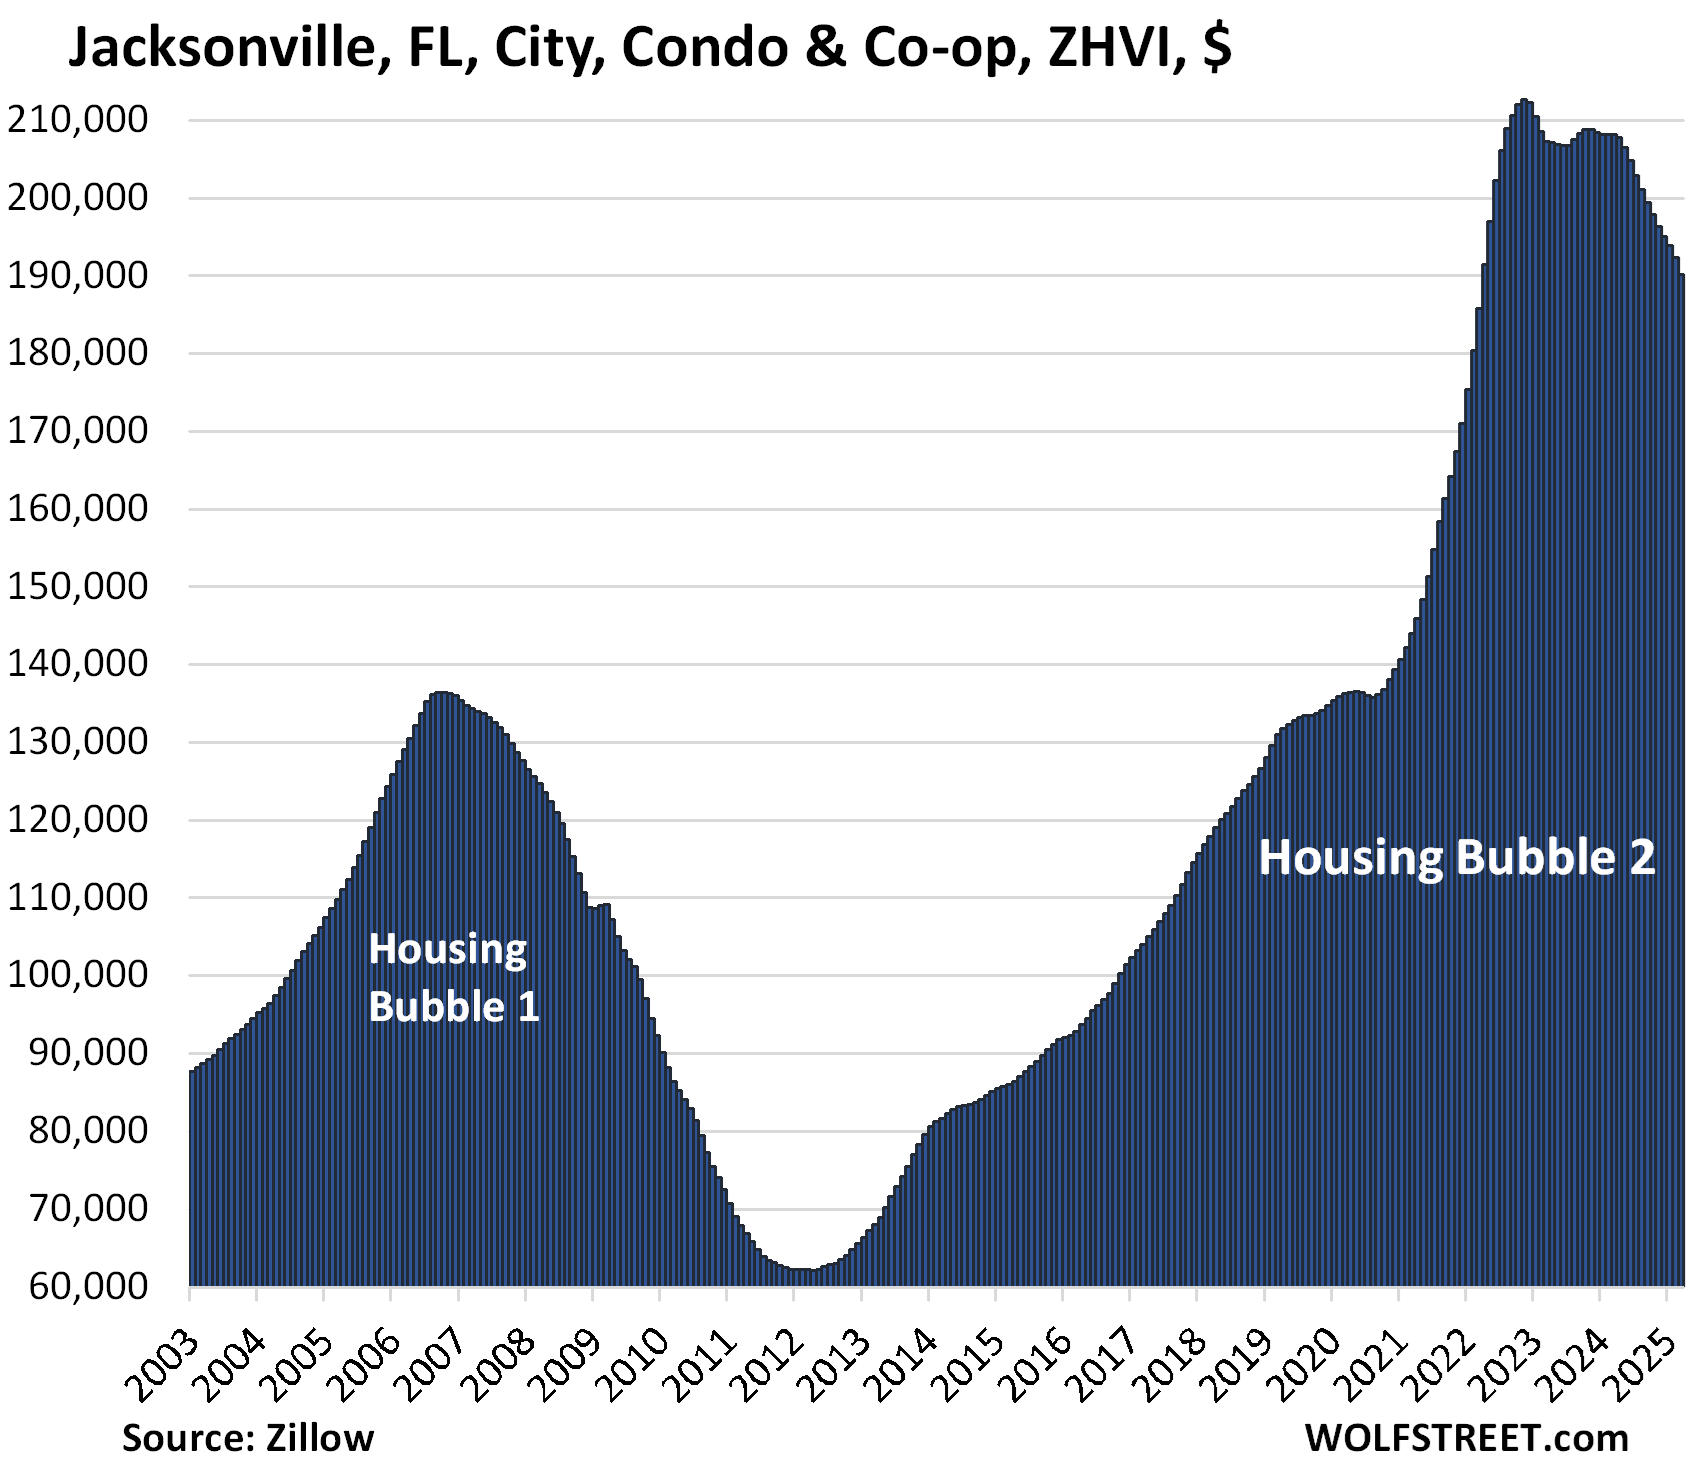
- Jacksonville, FL: -11%
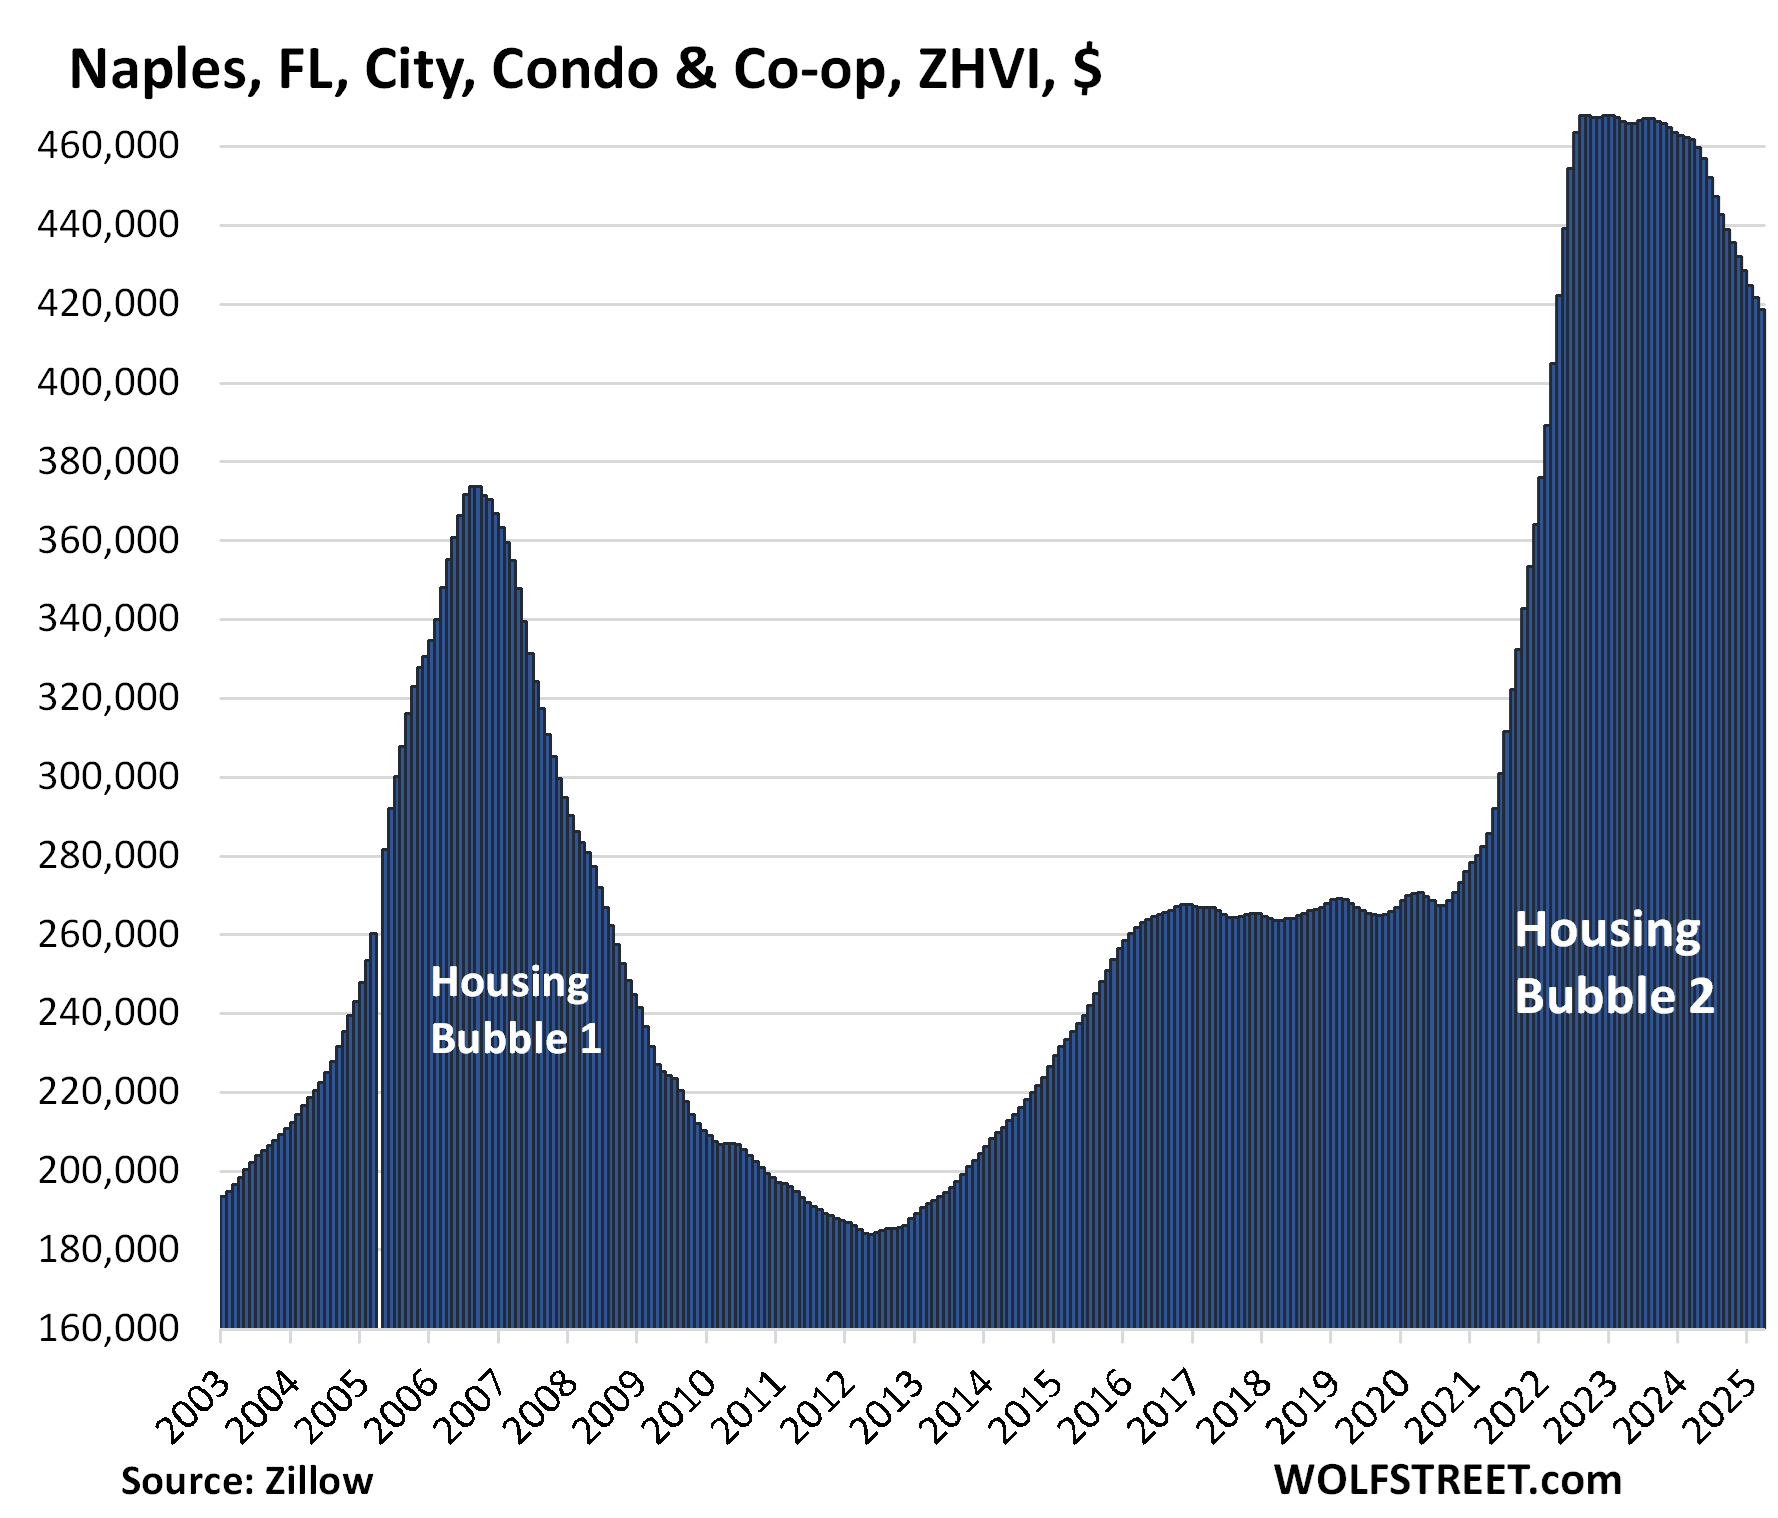
- Naples, FL: -11%
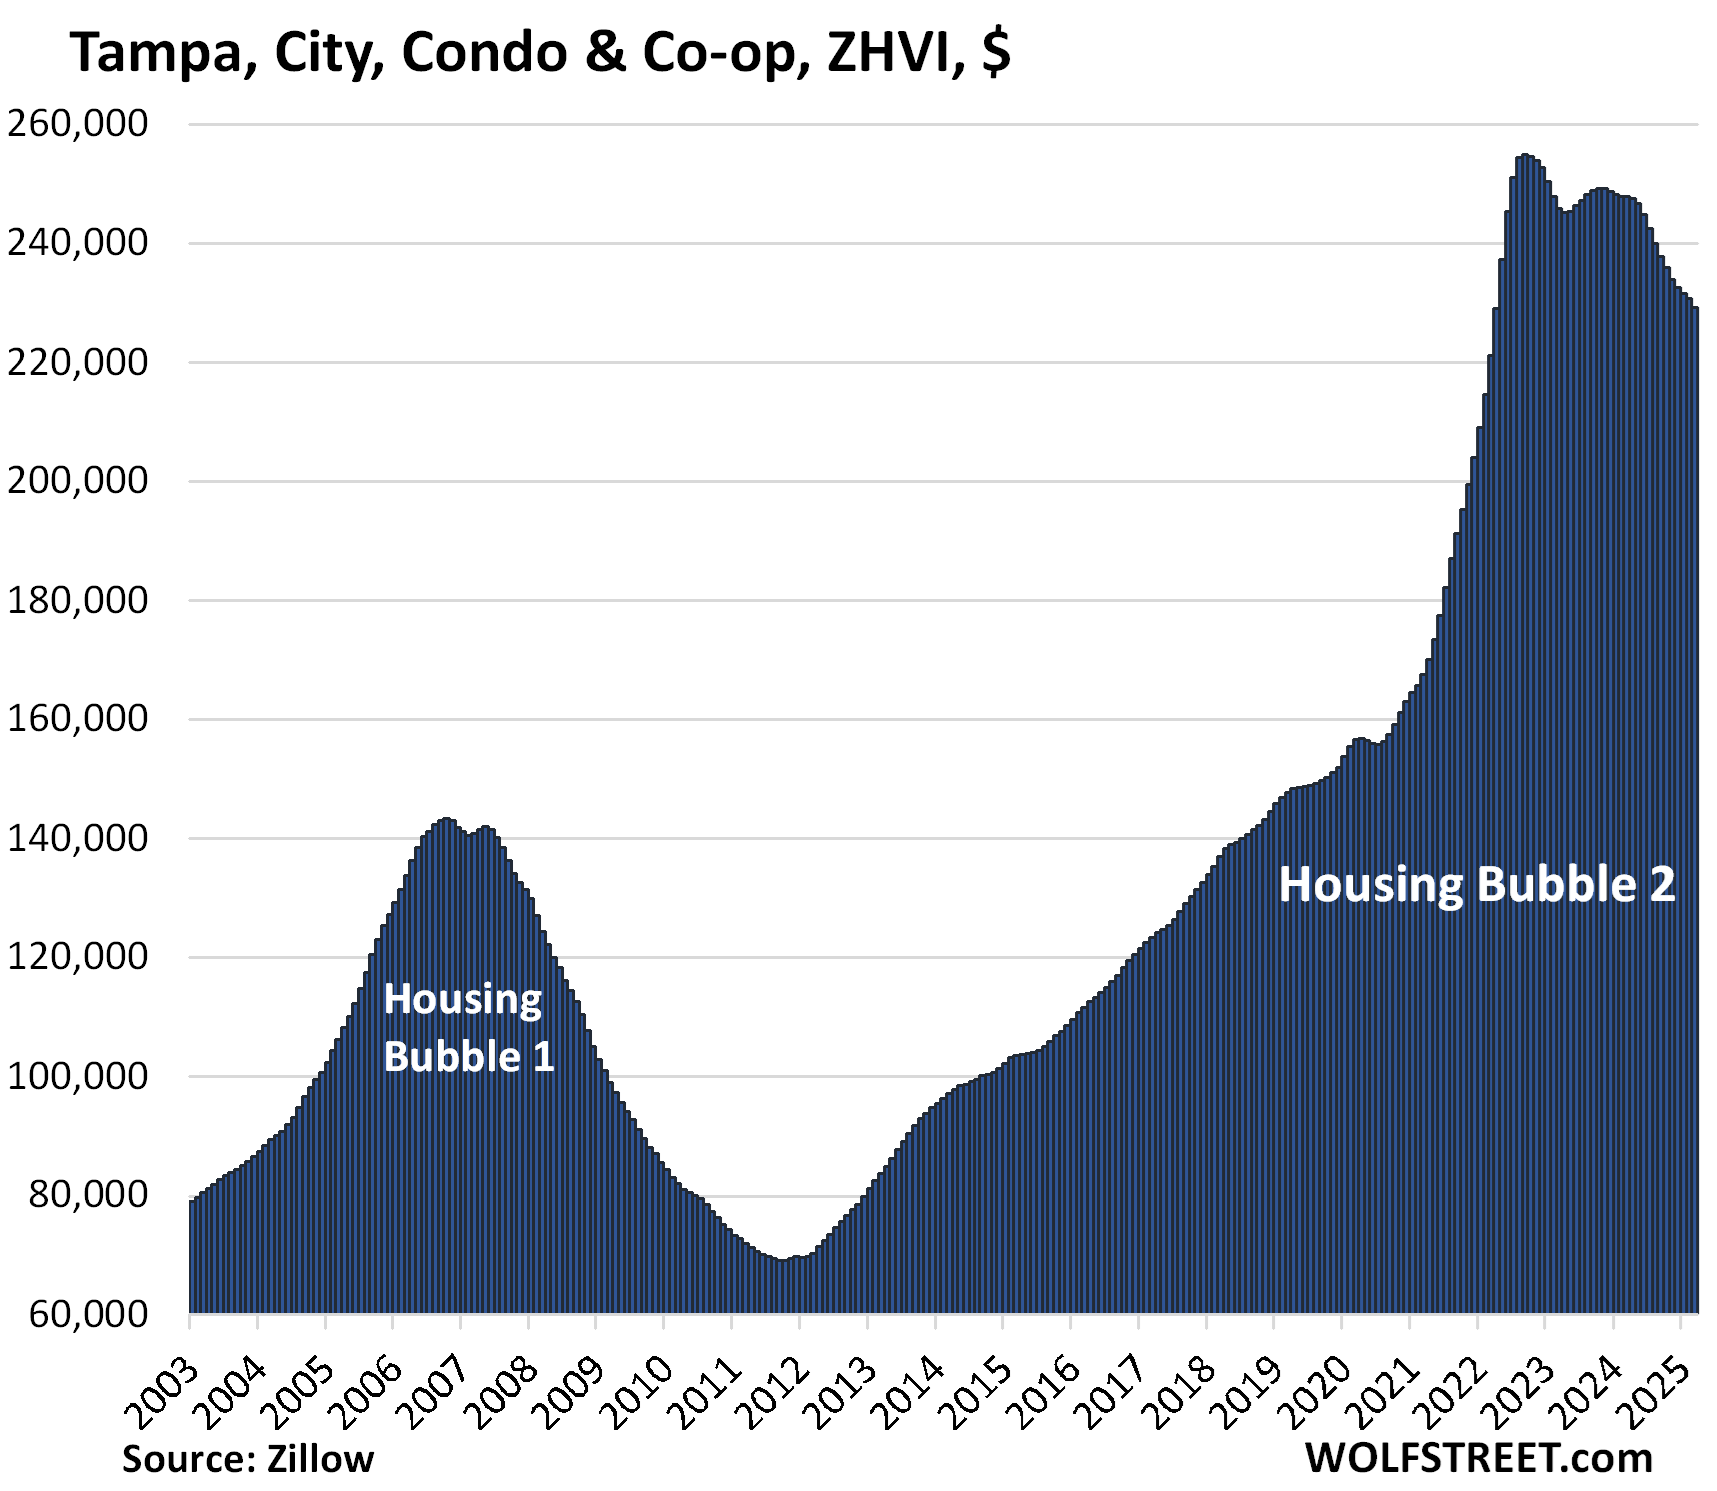
- Tampa, FL: -10%
- Mesa, AZ: -10%
- Portland, OR: -10%
- Seattle, WA: -10%
In Florida, price drops are accelerating. Of the 15 big cities here where condo prices through March have fallen by 10%-plus from their peaks, 5 are in Florida, but not yet including Miami and some other cities in the state with declines of still less than 10%. In the little tables for each city below, note the sharp month-to-month drops in those cities in Florida – a sign that the declines are heating up.
Condo dynamics are different.
Condos attract a large share of investors, including mom-and-pop investors, that want to generate income from long-term rentals, student rentals, or vacation rentals. And they want to cash in later on the expected huge capital gains. Condos also attract second-home buyers, especially along the coasts and in the mountains. In the southern part of the US, they also attract snowbirds, often retirees, from parts of the US and Canada with long and harsh winters.
But long-term rentals have come under pressure from the massive supply of brand-new apartment developments that sprang up over the past few years. The vacation-rental boom over the past few years created a huge supply of vacation rentals, and demand for them may have peaked. And snowbirds from Canada anecdotally are said to be getting second thoughts about their condos in Florida, Texas, and Arizona.
Then there are the issues of soaring HOA feeds in some areas, driven by soaring insurance costs.
Older condo buildings can whack owners over the head with huge special assessments to fund long-neglected repair and maintenance projects. For investors, that’s a tough nut to crack: Instead of getting regular cashflow from the unit, they’ve got to plow more money into it. Owners that don’t want to or can’t pay for those assessments would have to sell their units.
Interest rates have risen and stayed high, making purchases much more expensive after the 60%, 70%, or 80% three-year price spikes in the erstwhile hottest markets.
In addition, news of a growing “mortgage blacklist” at Fannie Mae began circulating. It has grown to over 5,000 condo properties that failed to meet Fannie Mae’s lending criteria. Over 1,400 of these properties are in Florida and over 700 are in California, the two states most impacted by it. Obviously, the numbers of properties on the blacklist are only a minuscule portion of the total number of condo properties. But condos in one of the blacklisted properties are difficult to finance, and therefore are difficult to sell other than to cash buyers, often at a big discount. In the broader sense, there may be more of a psychological impact from that blacklist, including the fear that an older not-blacklisted property might end up on the blacklist in the future.
In some densely populated cities, such as San Francisco, condos make up a bigger part of the housing market than single-family residences.
The absurd price spikes come unglued.
So here are the 15 bigger cities where condo prices have dropped by 10% or more from their respective peaks. Most of those peaks were in mid-2022, but some peaks were in prior years.
Condo prices here are seasonally adjusted three-month average prices of “mid-tier” condos. The data are from the Zillow Home Value Index (ZHVI), which is based on millions of data points in Zillow’s “Database of All Homes,” including from public records (tax data), MLS, brokerages, local Realtor Associations, real-estate agents, and households across the US. It includes pricing data for off-market deals and for-sale-by-owner deals.
Blame for this absurdity in 2020 through mid-2022 goes to the Fed’s schemes of money-printing and interest rate repression at the time, which triggered a general mania for asset purchases. But those schemes stopped in 2022, and then were reversed to some extent, including by un-printing $2.24 trillion so far and by much higher short-term policy rates, the combination of which caused mortgage rates to surpass 6% since September 2022, and lingering on either side of 7% much of the time, including now even after the Fed has cut short-term policy rates by 1 full percentage point (here is my explanation why mortgage rates have remained high).
The left figure in the little tables below shows the drop from the peak. The right figure shows the still huge gains since 2000.
Cities in Texas, and Denver, didn’t really have much of a Housing Bubble 1, and therefore didn’t have much of a Housing Bust 1. But they made up for it during Housing Bubble 2.
| Austin, City, Condo Prices | |||
| From Jul 2022 peak | MoM | YoY | Since 2000 |
| -22% | -0.3% | -5.7% | 121% |
Lowest since April 2021.
| Oakland, City, Condo Home Prices | |||
| From May 2022 peak | MoM | YoY | Since 2000 |
| -20% | -1.0% | -7.2% | 179% |
Lowest since September 2016.
| Saint Petersburg, Fl, City, Condo Prices | |||
| From Oct 2022 peak | MoM | YoY | Since 2000 |
| -17% | -1.1% | -12% | 226% |
Lowest since January 2022.
| Chula Vista, CA, City, Condo Prices | |||
| From Jun 2022 peak | MoM | YoY | Since 2000 |
| -14% | 0% | 0% | 222% |
| San Francisco, City, Condo Prices | |||
| From May 2022 peak | MoM | YoY | Since 2000 |
| -14% | -0.1% | 0.5% | 145% |
Back to May 2015.
| Detroit, City, Condo Prices | |||
| From Sep 2021 peak | MoM | YoY | Since 2000 |
| -13% | 0.2% | -4.3% | 271% |
| New Orleans, City, Condo Prices | |||
| From Jun 2022 peak | MoM | YoY | Since 2000 |
| -12% | -0.4% | -4.1% | 102% |
| Lakeland, FL, City, Condo Prices | |||
| From July 2022 peak | MoM | YoY | Since 2000 |
| -13% | -1.3% | -11% | 161% |
| Denver, City, Condo Prices | |||
| From Jul 2022 peak | MoM | YoY | Since 2000 |
| -11% | -0.9% | -5.7% | 148% |
Lowest since September 2021.
| Jacksonville, FL, City, Condo Prices | |||
| From Nov 2022 peak | MoM | YoY | Since 2000 |
| -11% | -1.1% | -8.6% | 171% |
| Naples, FL, City, Condo Prices | |||
| From Aug 2022 peak | MoM | YoY | Since 2000 |
| -11% | -0.7% | -9% | 175% |
This would kind of funny, if it weren’t so serious:
| Tampa, City, Condo Prices | |||
| From Sep 2022 peak | MoM | YoY | Since 2000 |
| -10% | -0.7% | -7.5% | 293% |
| Mesa, AZ, City, Condo Prices | |||
| From Aug 2022 peak | MoM | YoY | Since 2000 |
| -10% | -0.5% | -4.1% | 215% |
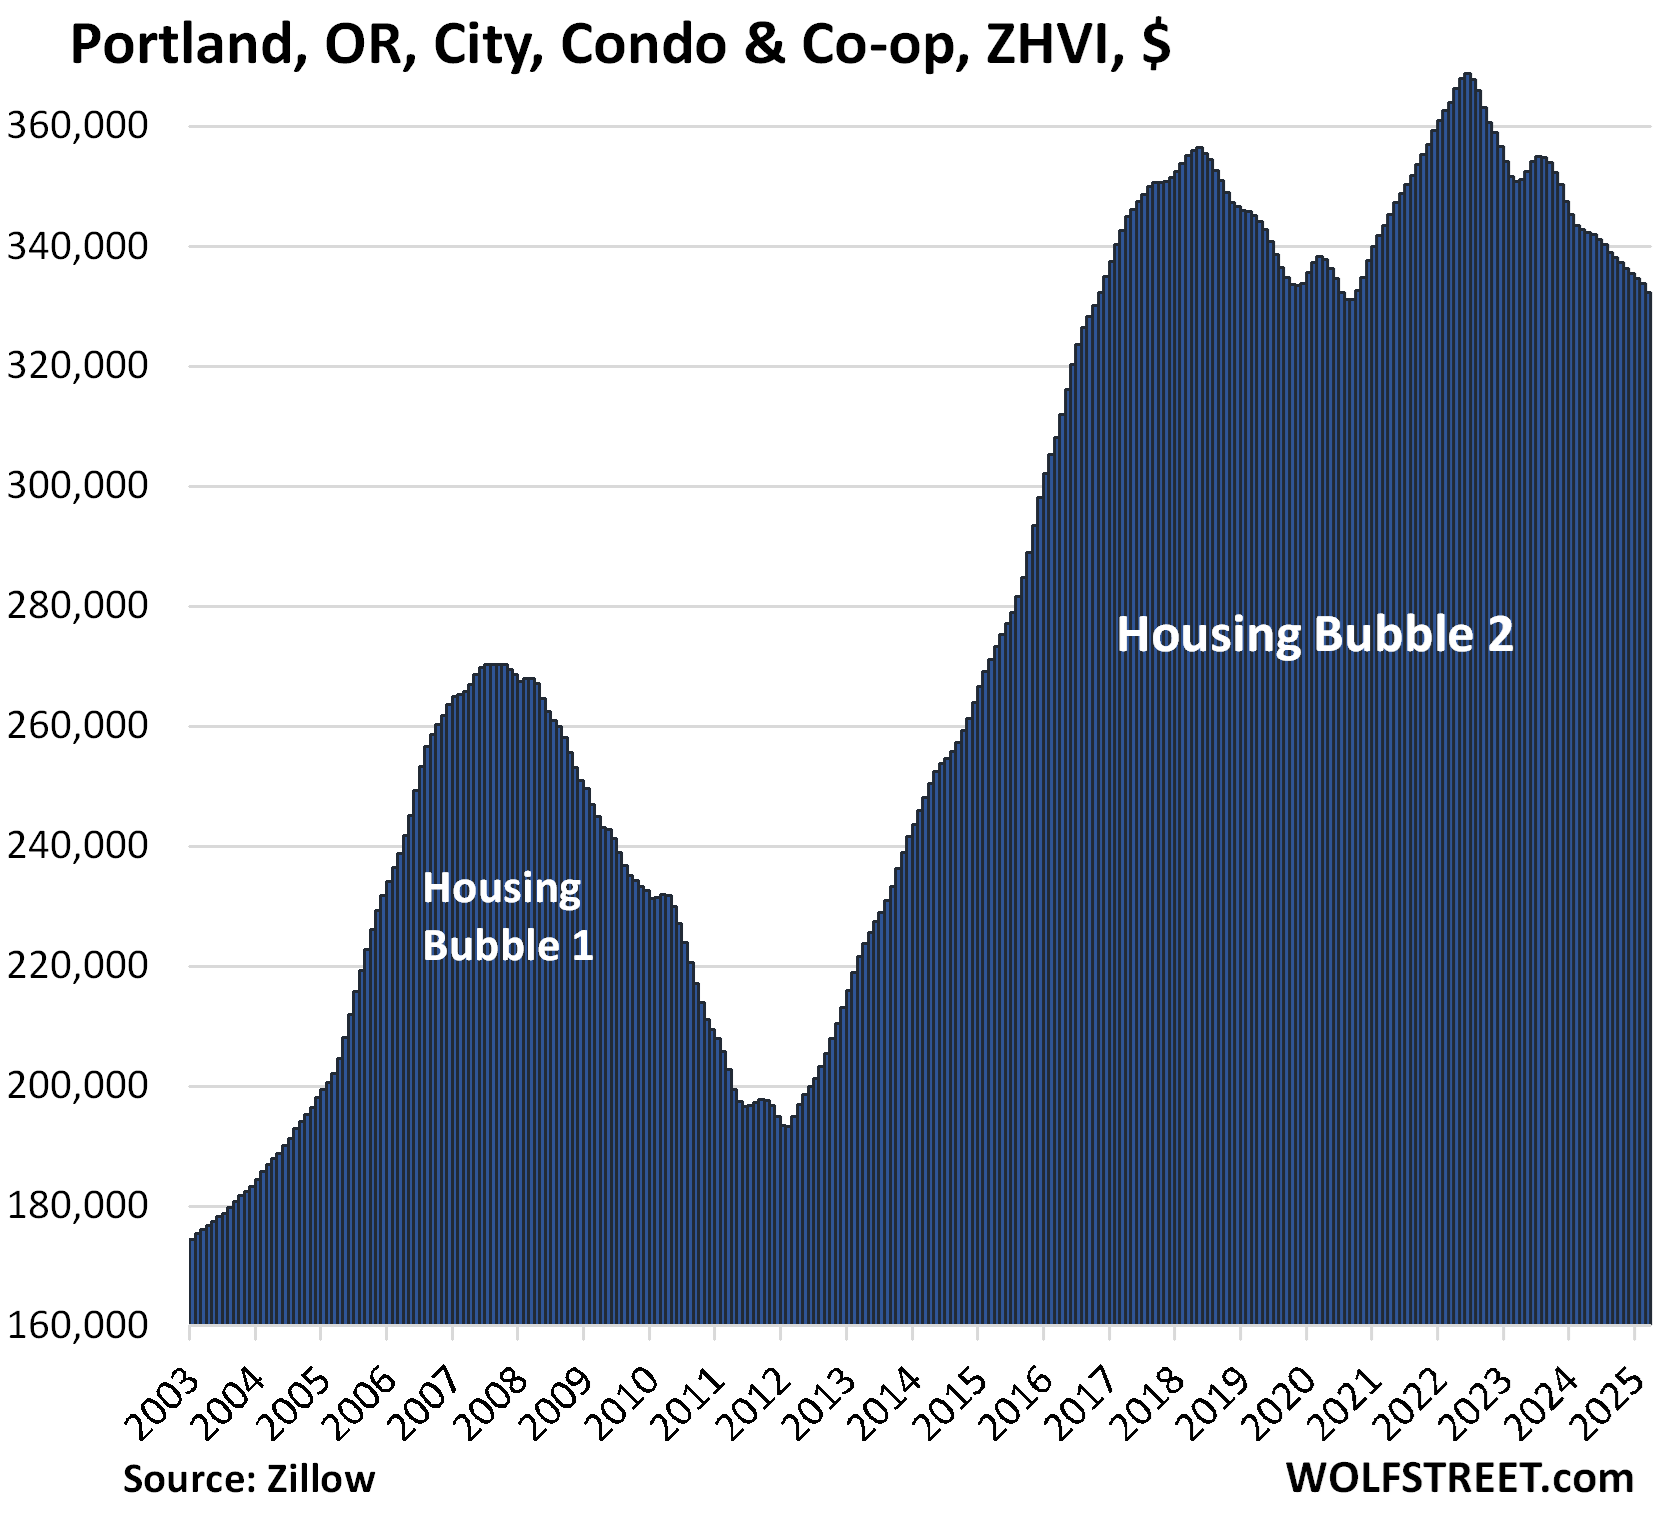
| Portland, City, Condo Prices | |||
| From Jun 2022 peak | MoM | YoY | Since 2000 |
| -10% | -0.4% | -3.0% | 117% |
Back to November 2016.
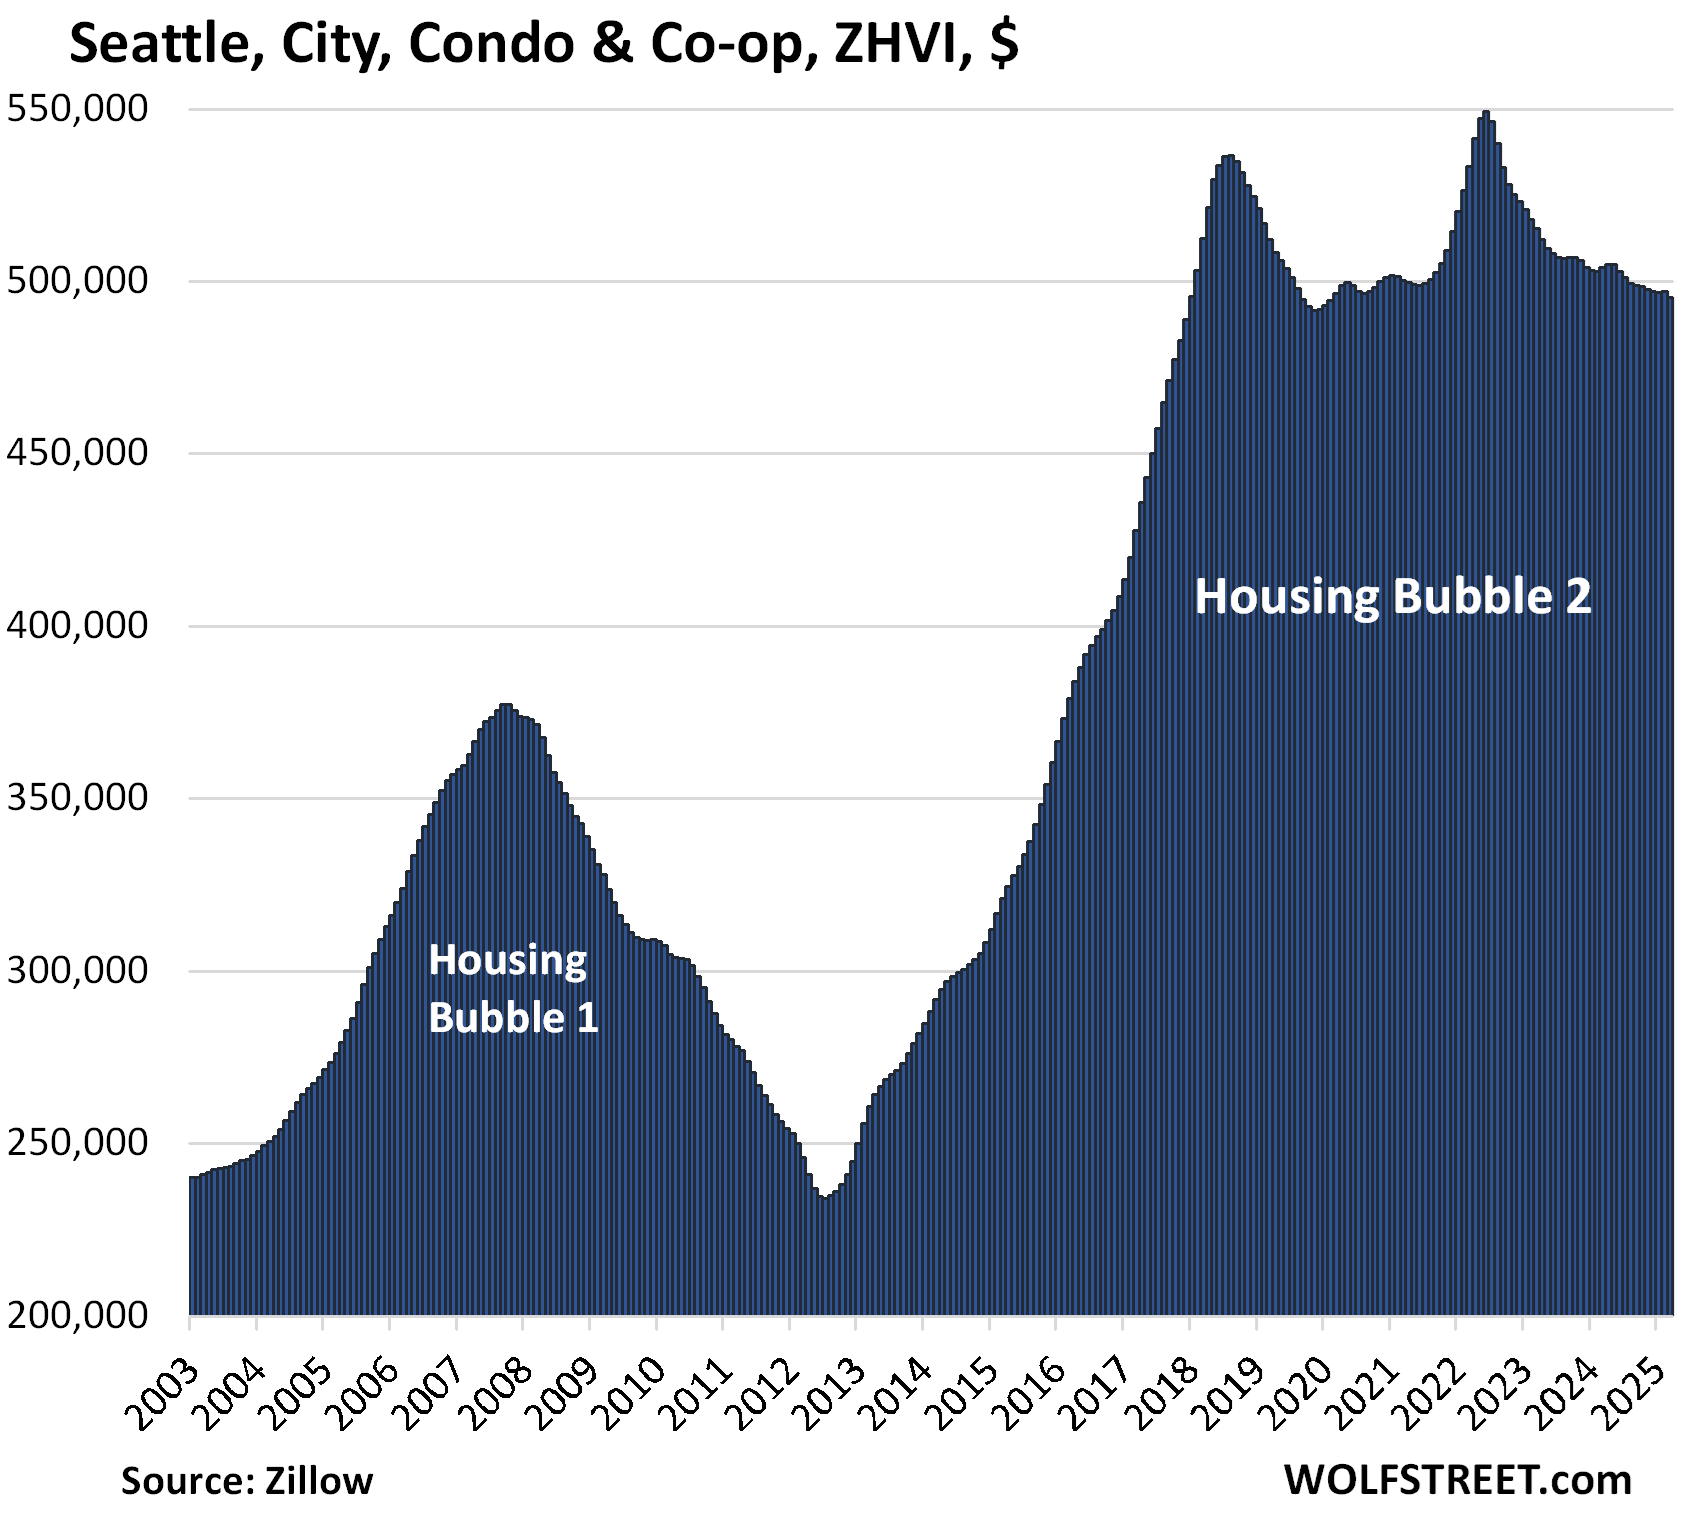
| Seattle, City Condo Prices | |||
| From Jun 2022 peak | MoM | YoY | Since 2000 |
| -10% | -0.4% | -1.7% | 147% |
Back to early 2018.
Enjoy reading WOLF STREET and want to support it? You can donate. I appreciate it immensely. Click on the mug to find out how:

![]()
The post In 15 Bigger Cities, Condo Prices Already -10% to -22%, 5 Are in Florida with Accelerating Drops. Absurdity Comes Unglued appeared first on Energy News Beat.