Energy News Beat
The Fed, after complaining about missing immigrants in labor market data, now has further support for its pivot to wait-and-see.
By Wolf Richter for WOLF STREET.
We’ve been discussing this issue – and its impact on employment data – since April after the Congressional Budget Office came out with estimates of actual population growth that included the huge wave of recent immigrants that wasn’t included in the Census Bureau’s population data, and thereby wasn’t included in the employment data by the Bureau of Labor Statistics, which extrapolates its household survey data to the population estimates from the Census Bureau.
Because many of the newly arrived immigrants, legal or illegal, are either working or looking for work, employment and labor force data were understated because they didn’t reflect those immigrants.
In December, the Census Bureau released its annual revisions that finally included this population growth of 8 million people over the past three years. So we knew that the annual adjustments by the BLS to its household survey data of employment and the labor force would produce a massive spike in January.
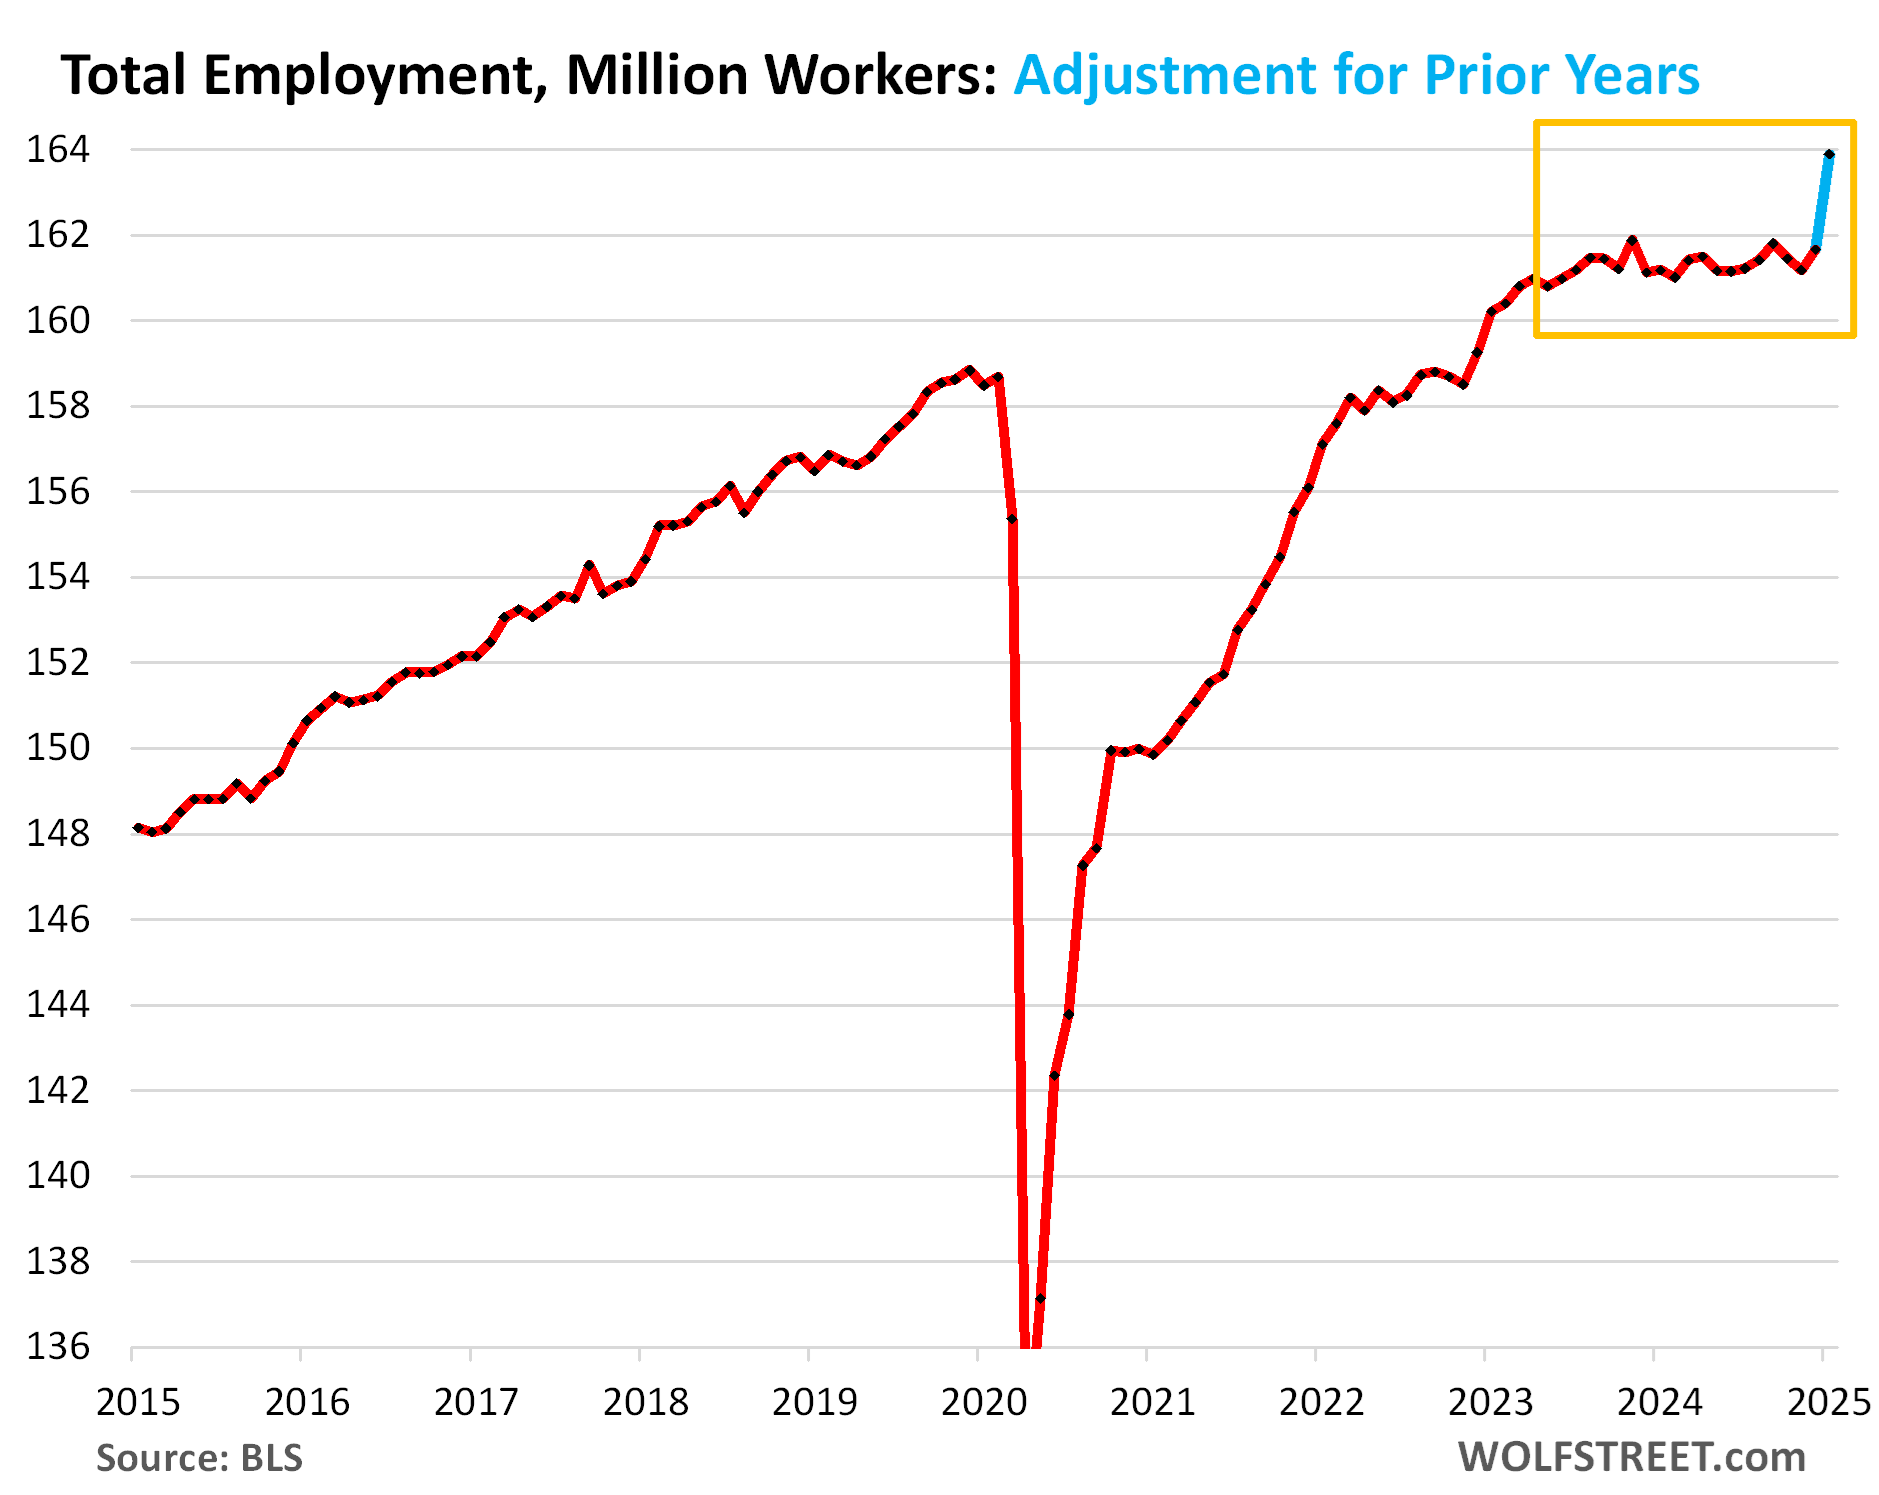
The BLS sticks the entire population adjustments to the household survey data into January, which created a spike of employment (+2.23 million in January from December) and a spike of the labor force (+2.20 million in January from December) that correct for several years of understatement. The BLS doesn’t revise backwards its household survey data with that population data. These adjustments, up and down, lumped into one month, happen every year, but this year they’re huge.
Total employment spiked by 2.23 million in January from December, to 163.9 million, reflecting the adjustment in the household survey data for the massive wave of immigrants, legal and illegal, over the past years.
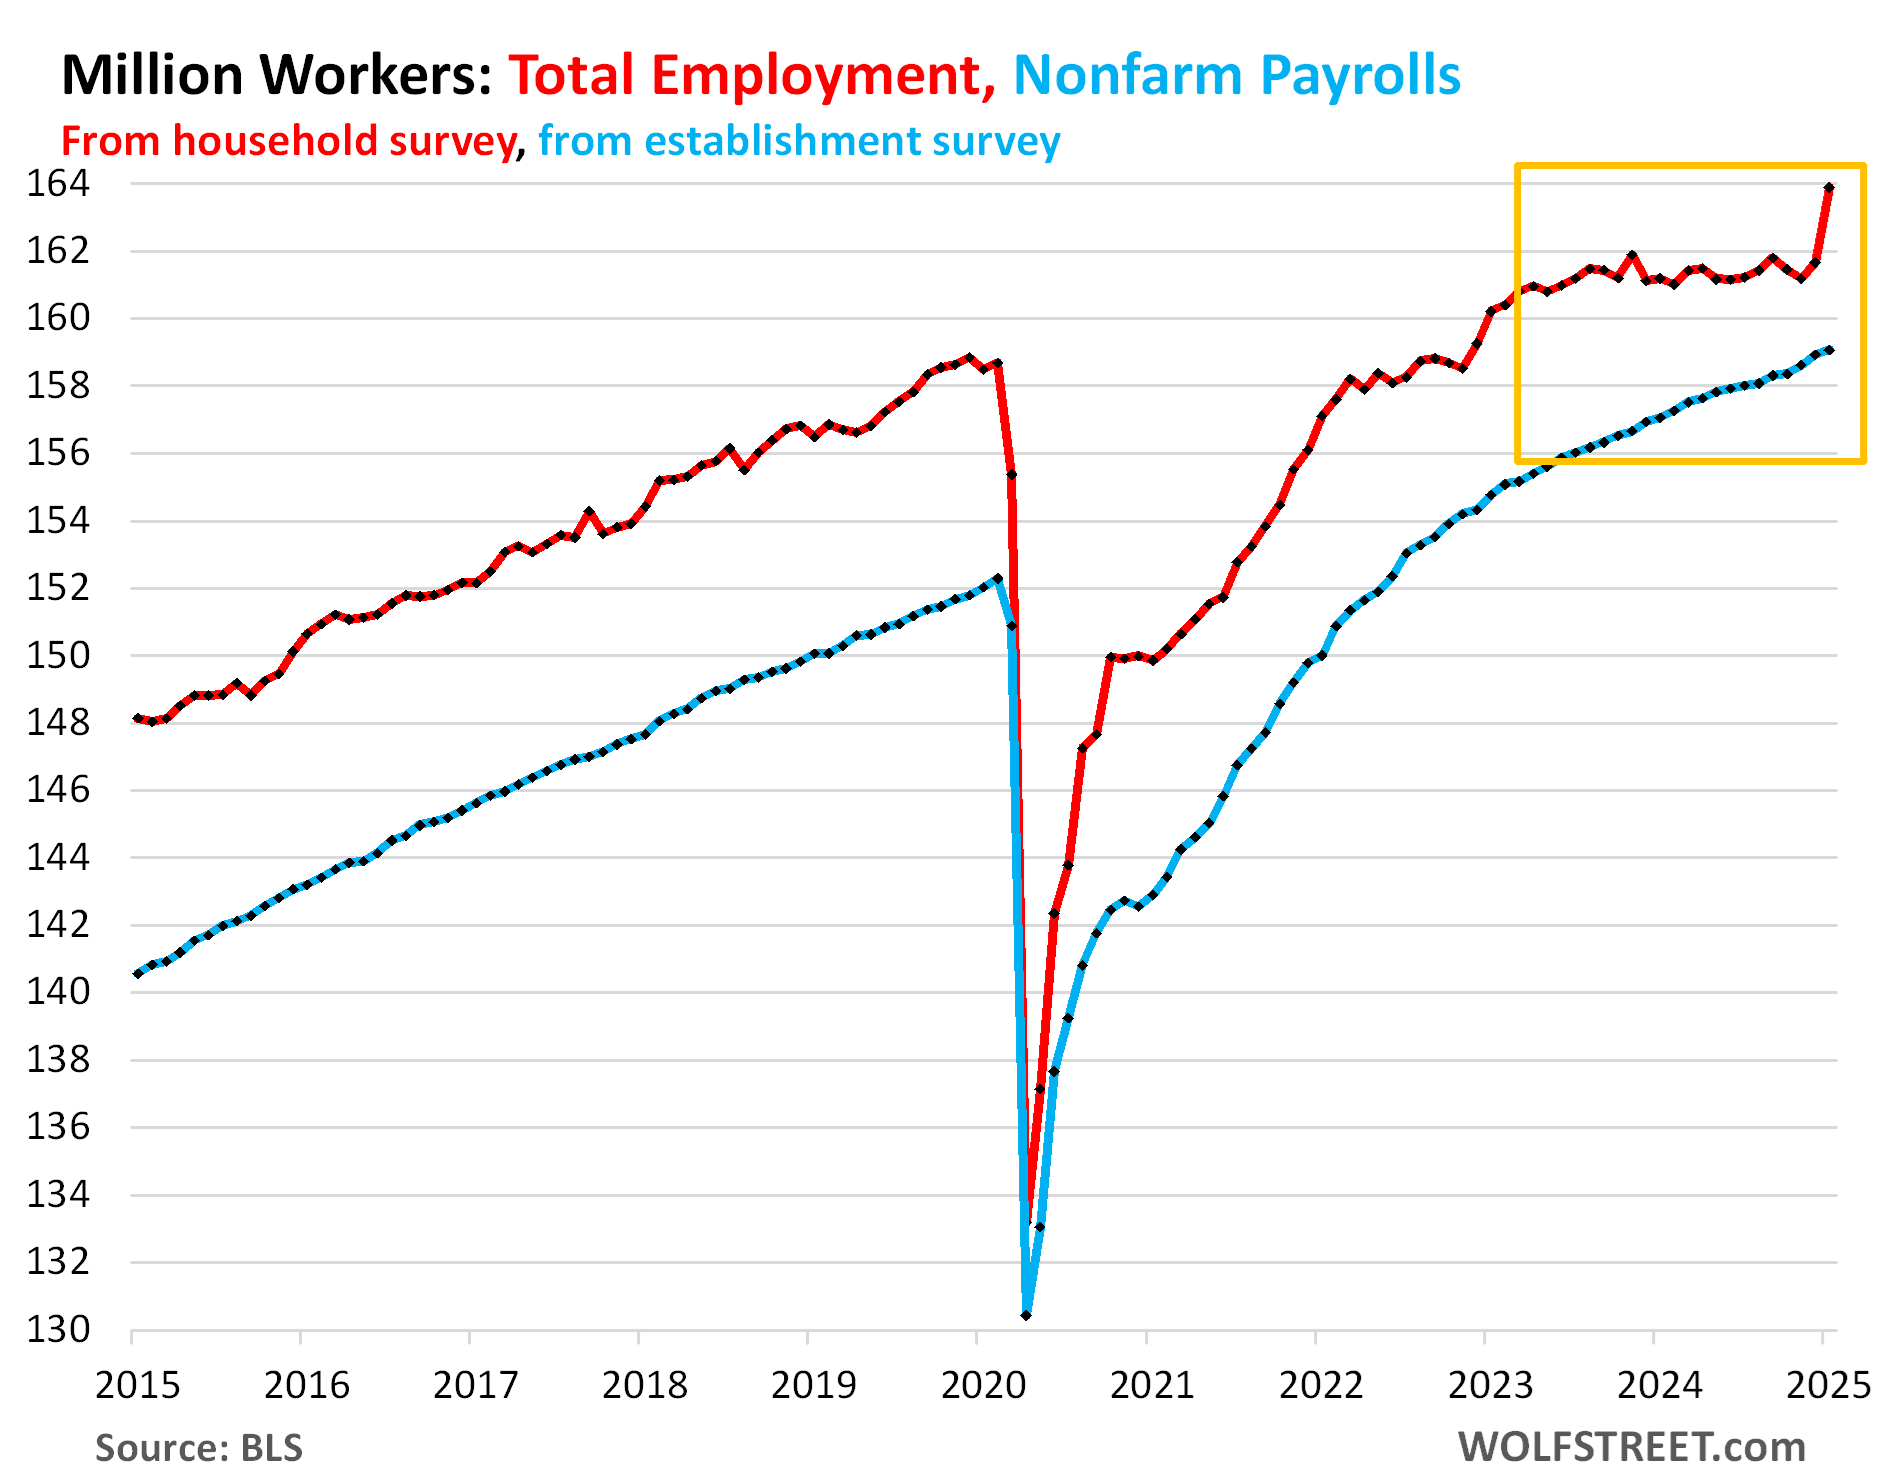
The household survey includes workers who are excluded from nonfarm payrolls reported by establishments, such as self-employed workers whose businesses are not incorporated, farm workers, and private household workers. So, total employment as depicted by the household survey is typically 6-8 million workers higher than nonfarm payrolls.
Because of the understatement of total employment in the household survey data over the past few years, that difference between total employment and nonfarm employment shrank to just 2.7 million workers in December.
Today, the huge upward adjustment to total employment and the previously announced downward revisions of nonfarm employment (more in a moment) caused the difference to increase to 4.83 million.
This chart shows that disconnect over the past two years between total employment (red) and nonfarm employment (as revised, blue), and how it reverted to pre-pandemic trend in January:
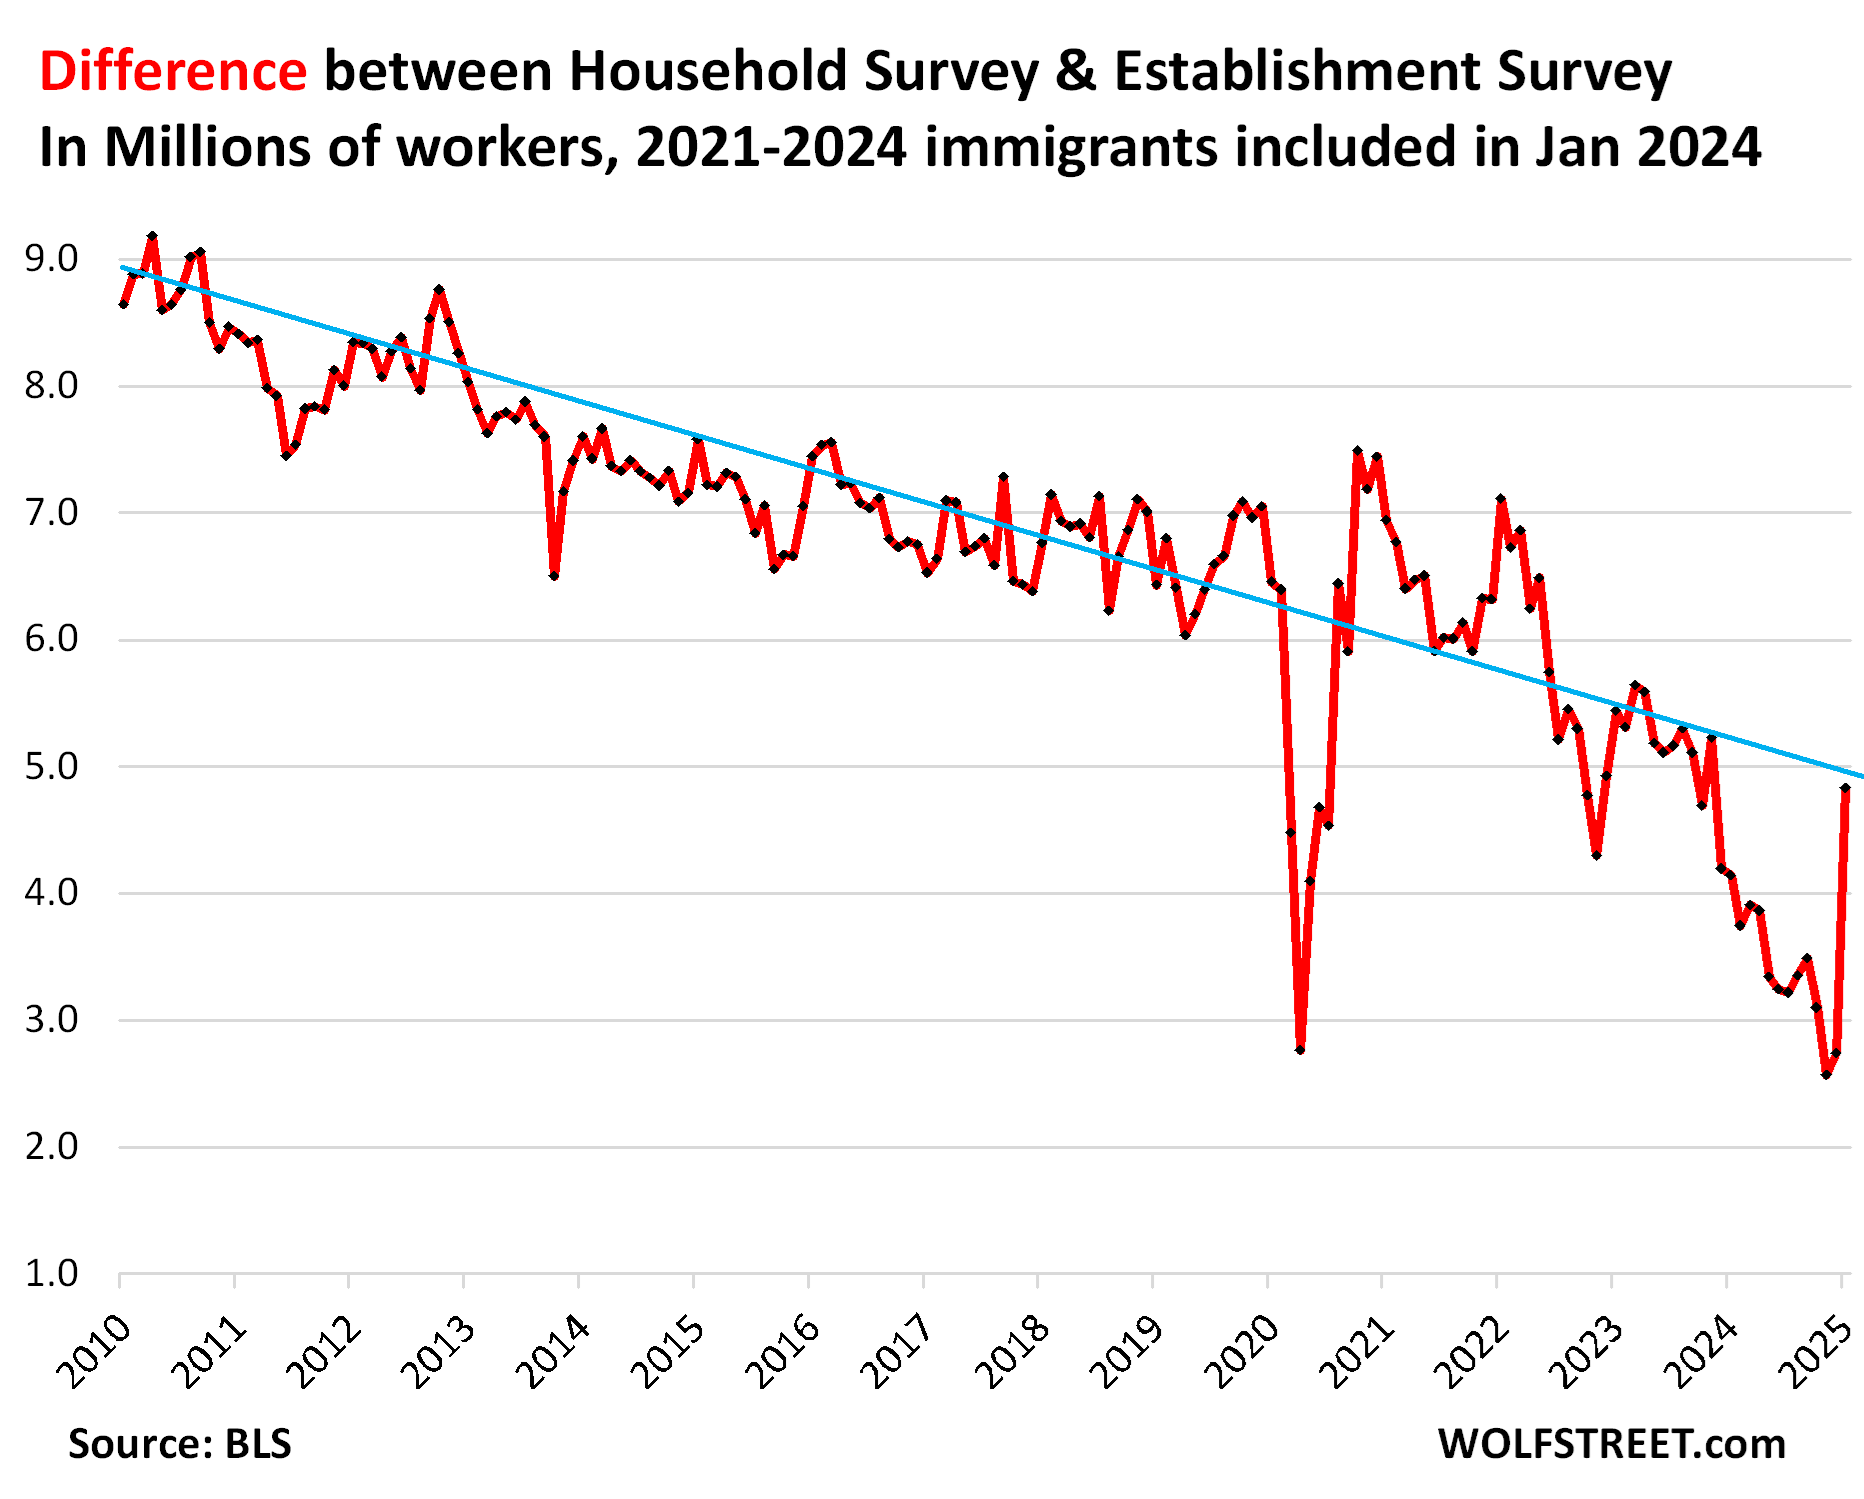
This is how the spread between total employment in the household survey and nonfarm payrolls from the establishment survey shrank from 6-7 million before the pandemic to 2.7 million in December, and how it reverted to pre-pandemic trend in January (blue line):
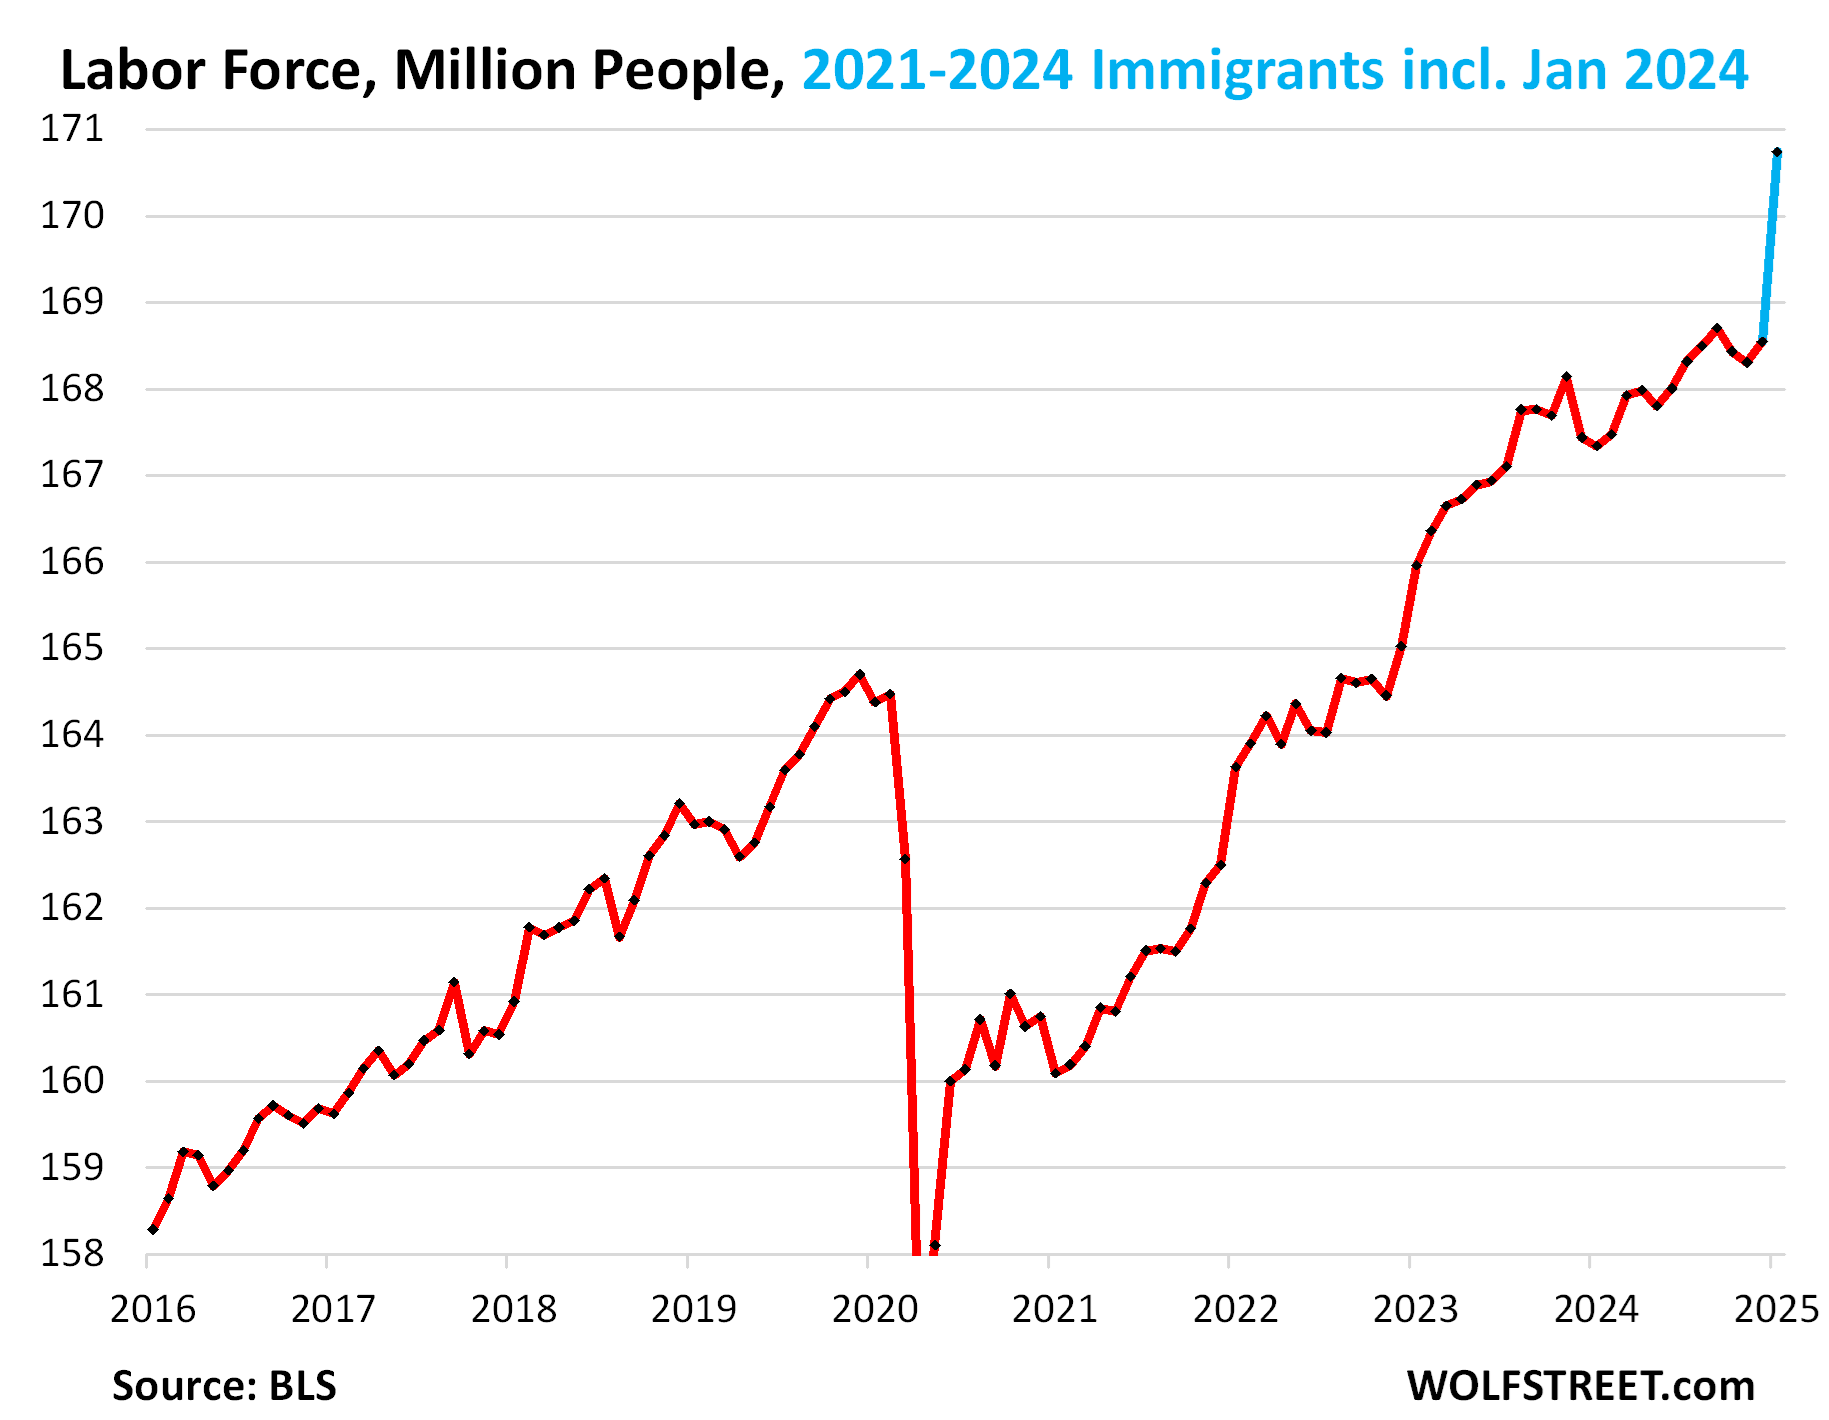
The Labor Force spiked by 2.20 million people in January from December, to 170.7 million people, reflecting the adjustment for the massive wave of legal and illegal immigrants in 2021-2024 that have joined the labor force but that were not included in the Census Bureau’s population data that the BLS uses.
The labor force includes total employment plus the people who were actively looking for a job during the survey period but didn’t have a job.
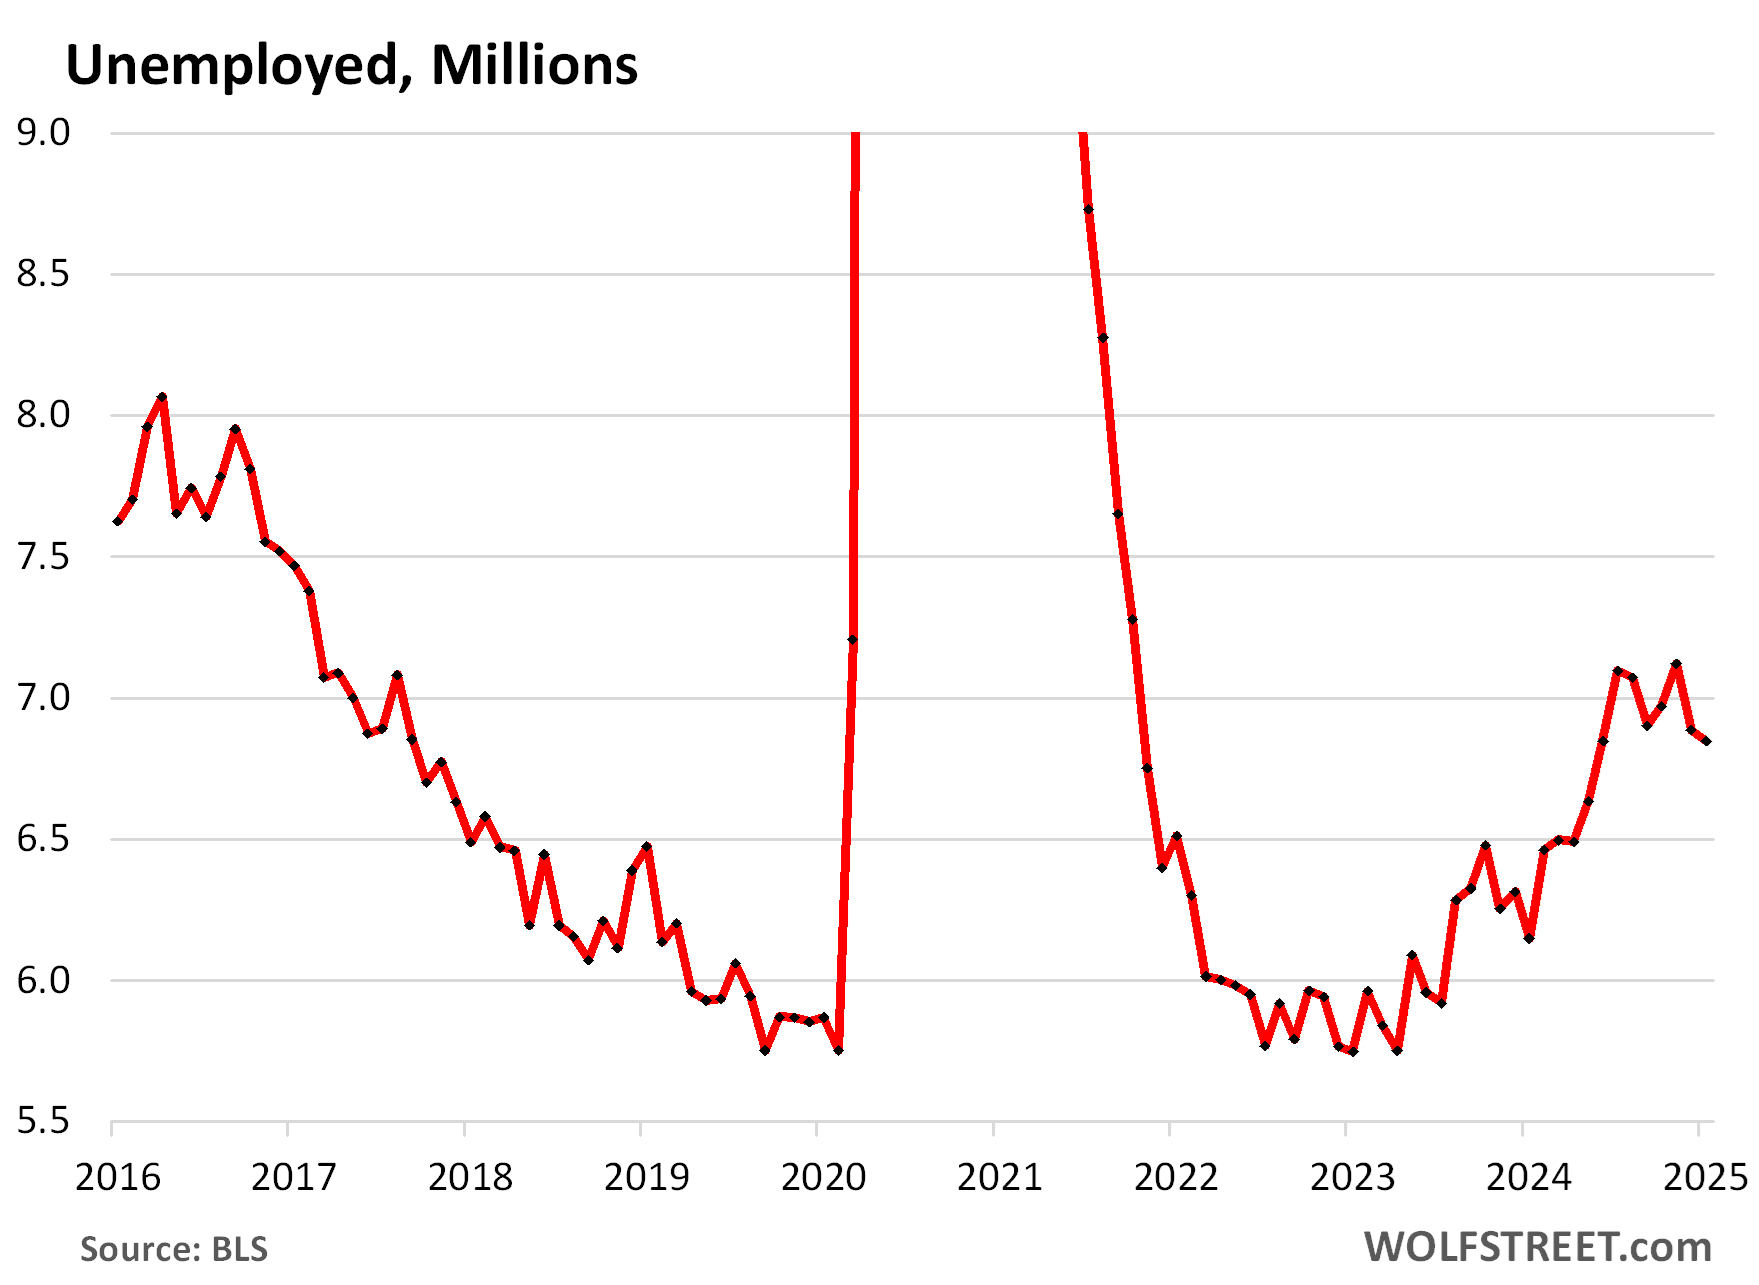
Unemployment fell by 37,000 to 6.85 million people who were actively looking for a job during the survey period, the lowest since June 2024, according to the adjusted household survey data today.
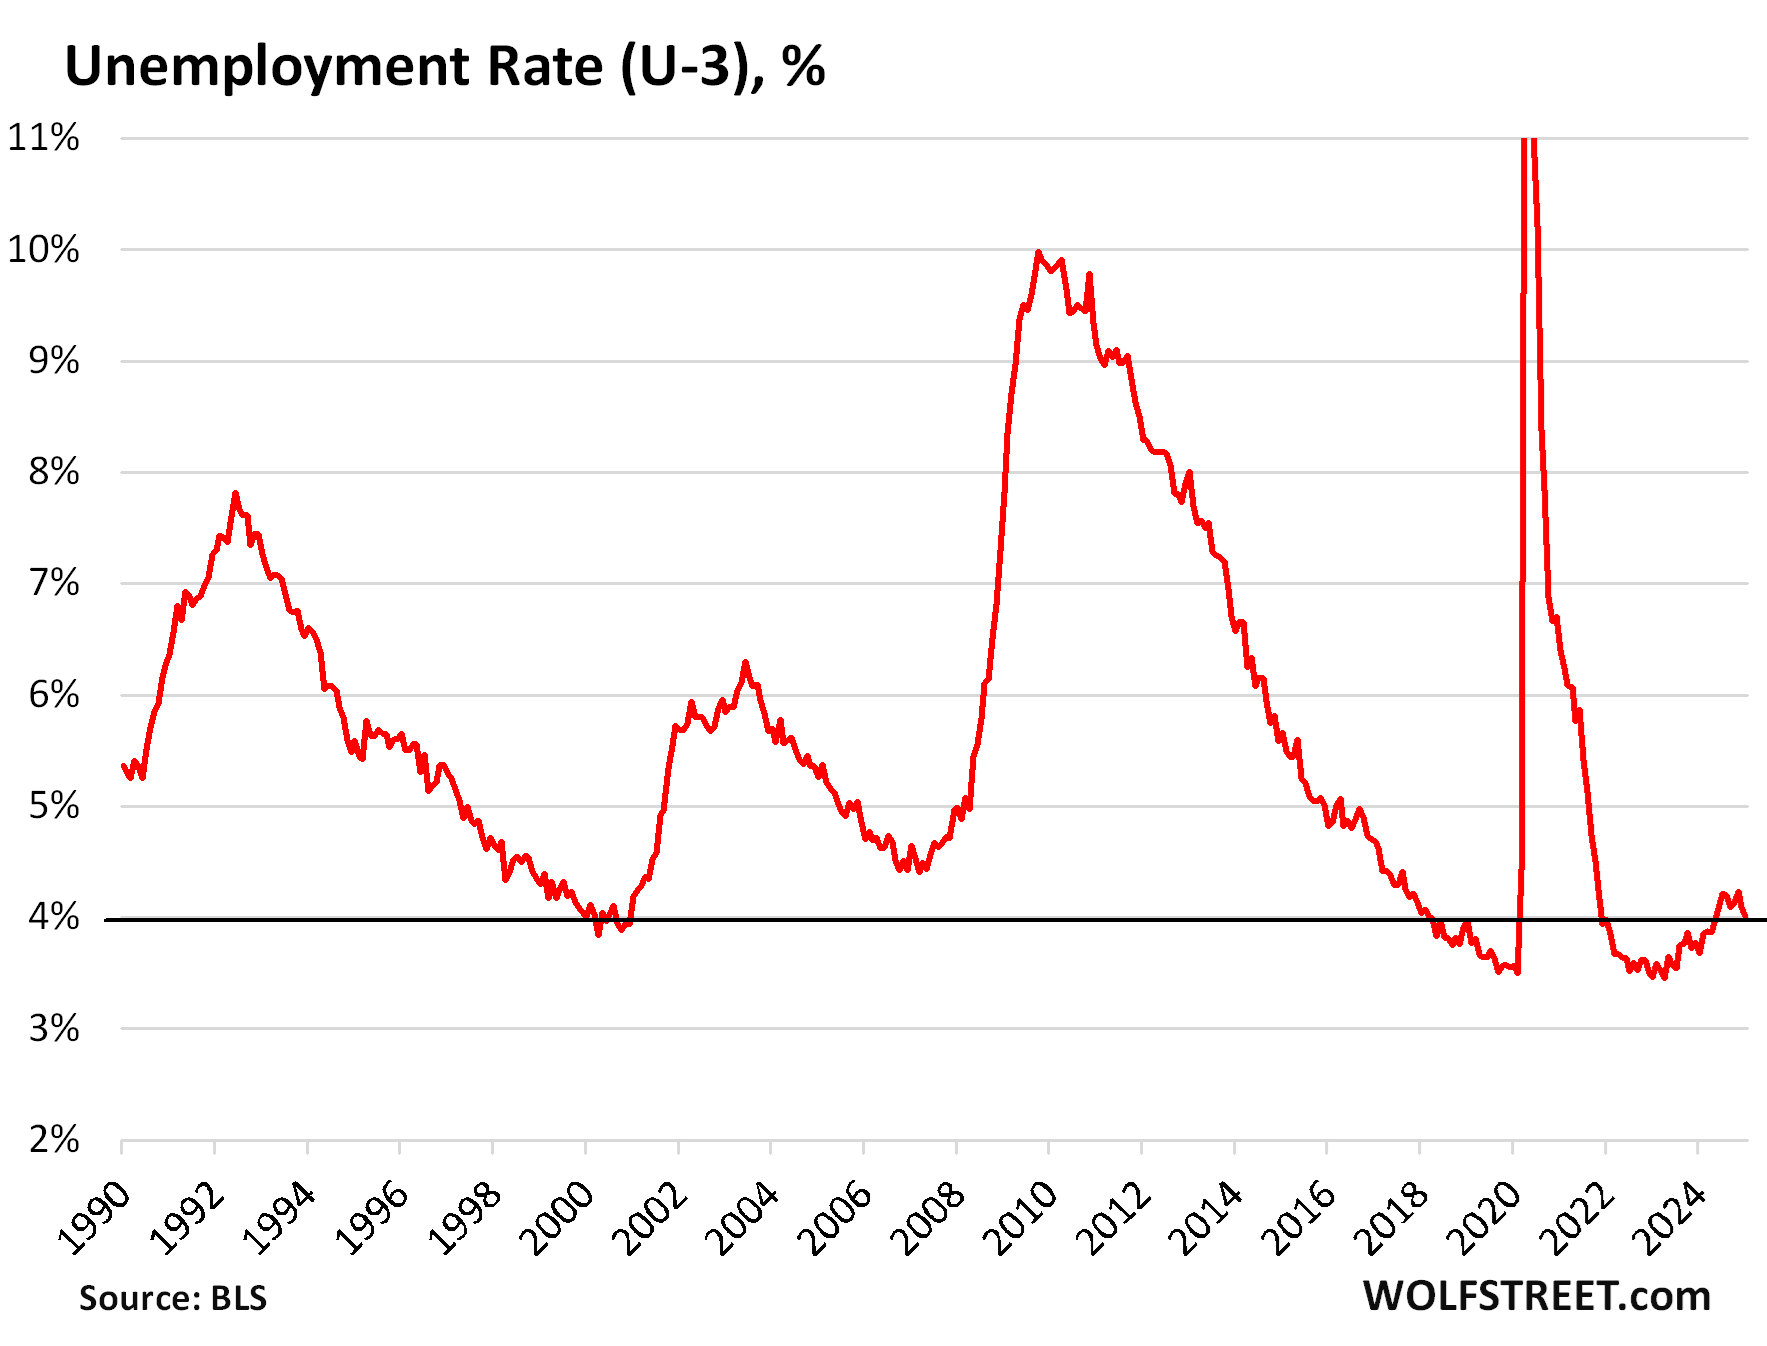
The unemployment rate (U-3) declined to 4.0% In January, the lowest since May. The unemployment rate is defined as total unemployment divided by the labor force. Both, total unemployment and the labor force were adjusted for January to reflect the wave of immigration, which caused the unemployment rate to be slightly lower than it had been reported late last year.
This unemployment rate of 4.0% is historically low, as the long view shows, depicting a solid labor market, and well below the Fed’s median projection in its Summary of Economic Projections at the December meeting: For the end of 2024, the median projection dipped to 4.2%, and for the end of 2025, it dipped to 4.3%:
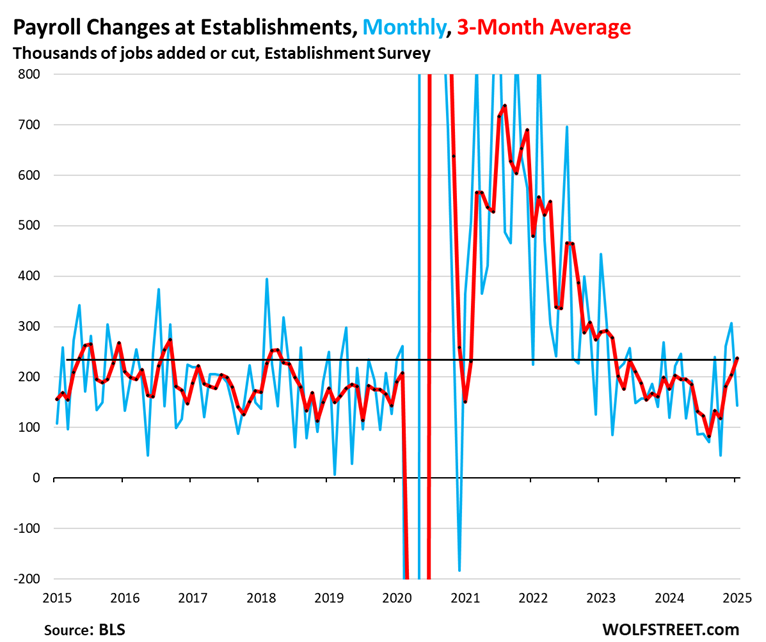
Nonfarm payrolls rose by 143,000 in January from December, to 159.1 million. November’s job growth was revised up by 49,000 to 261,000; and December was revised up by 51,000 to 307,000, according to the BLS today (blue in the chart below).
The three-month average job growth, including the revisions, was 237,000 per month, the highest since March 2023, and at the high end of the pre-pandemic range (red).
The three-month average also shows the Fed’s panic moment when it kept declining in 2024 and finally dropped to only 82,000 jobs created in August, which caused the Fed to cut by 50 basis points at the September meeting.
The nonfarm jobs revisions, whose preliminary estimates had been announced in August by the BLS as a lumpsum figure for the period from April 2023 through March 2024, were applied in today’s release to each month going back to the beginning of 2023. Per today’s release:
- Job creation in 2024 revised lower by 236,000 jobs to 2.00 million jobs created.
- Job creation in 2023 revised lower by 419,000 jobs to 2.59 million jobs created.
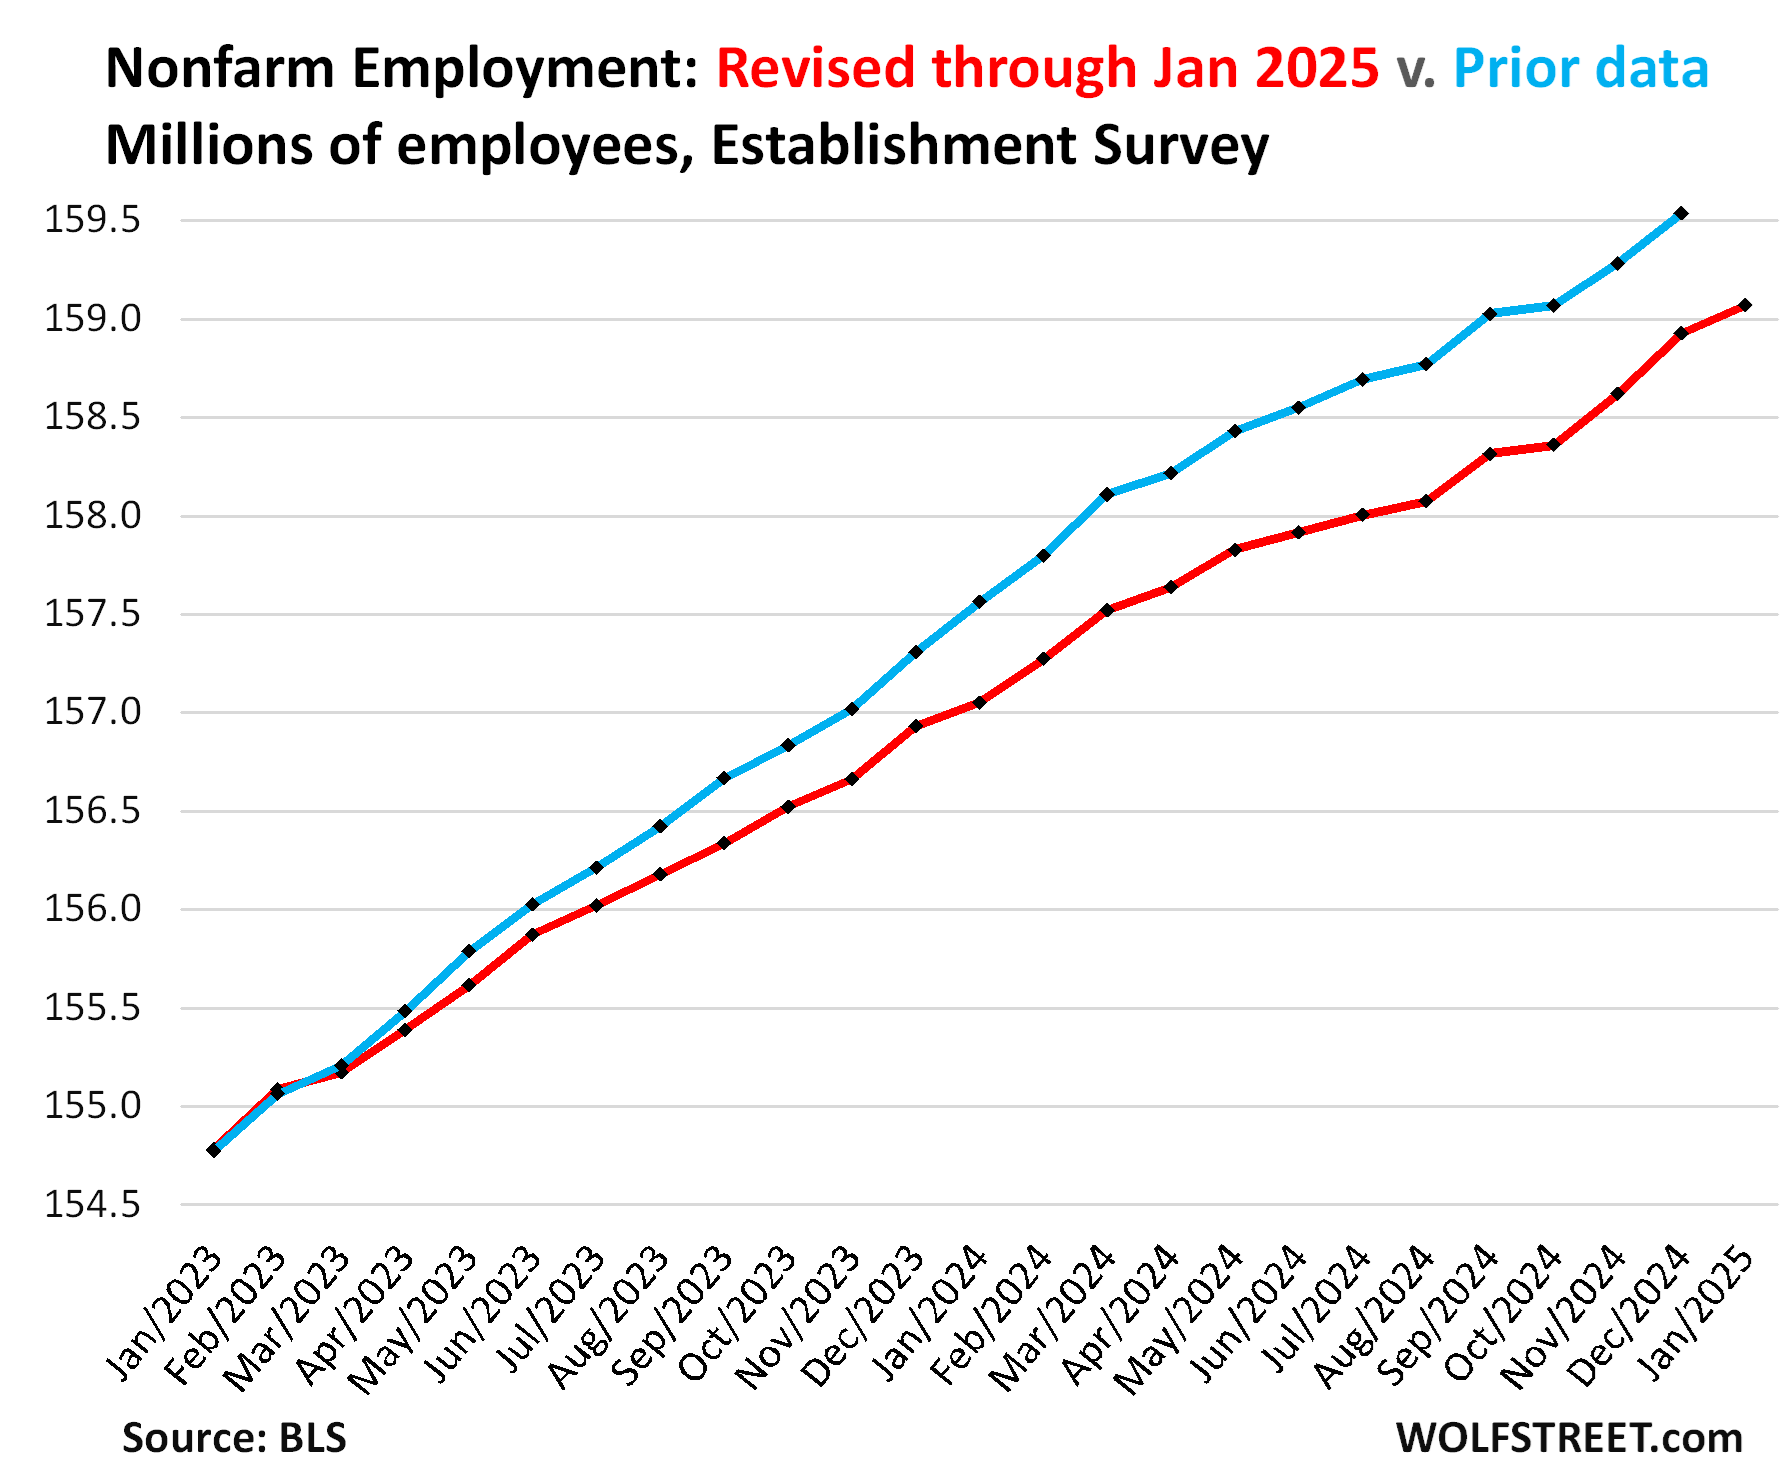
This chart shows the revised monthly nonfarm jobs (red) through January and the previously reported data through December (blue). Even the revised nonfarm jobs data depicts a solid labor market.
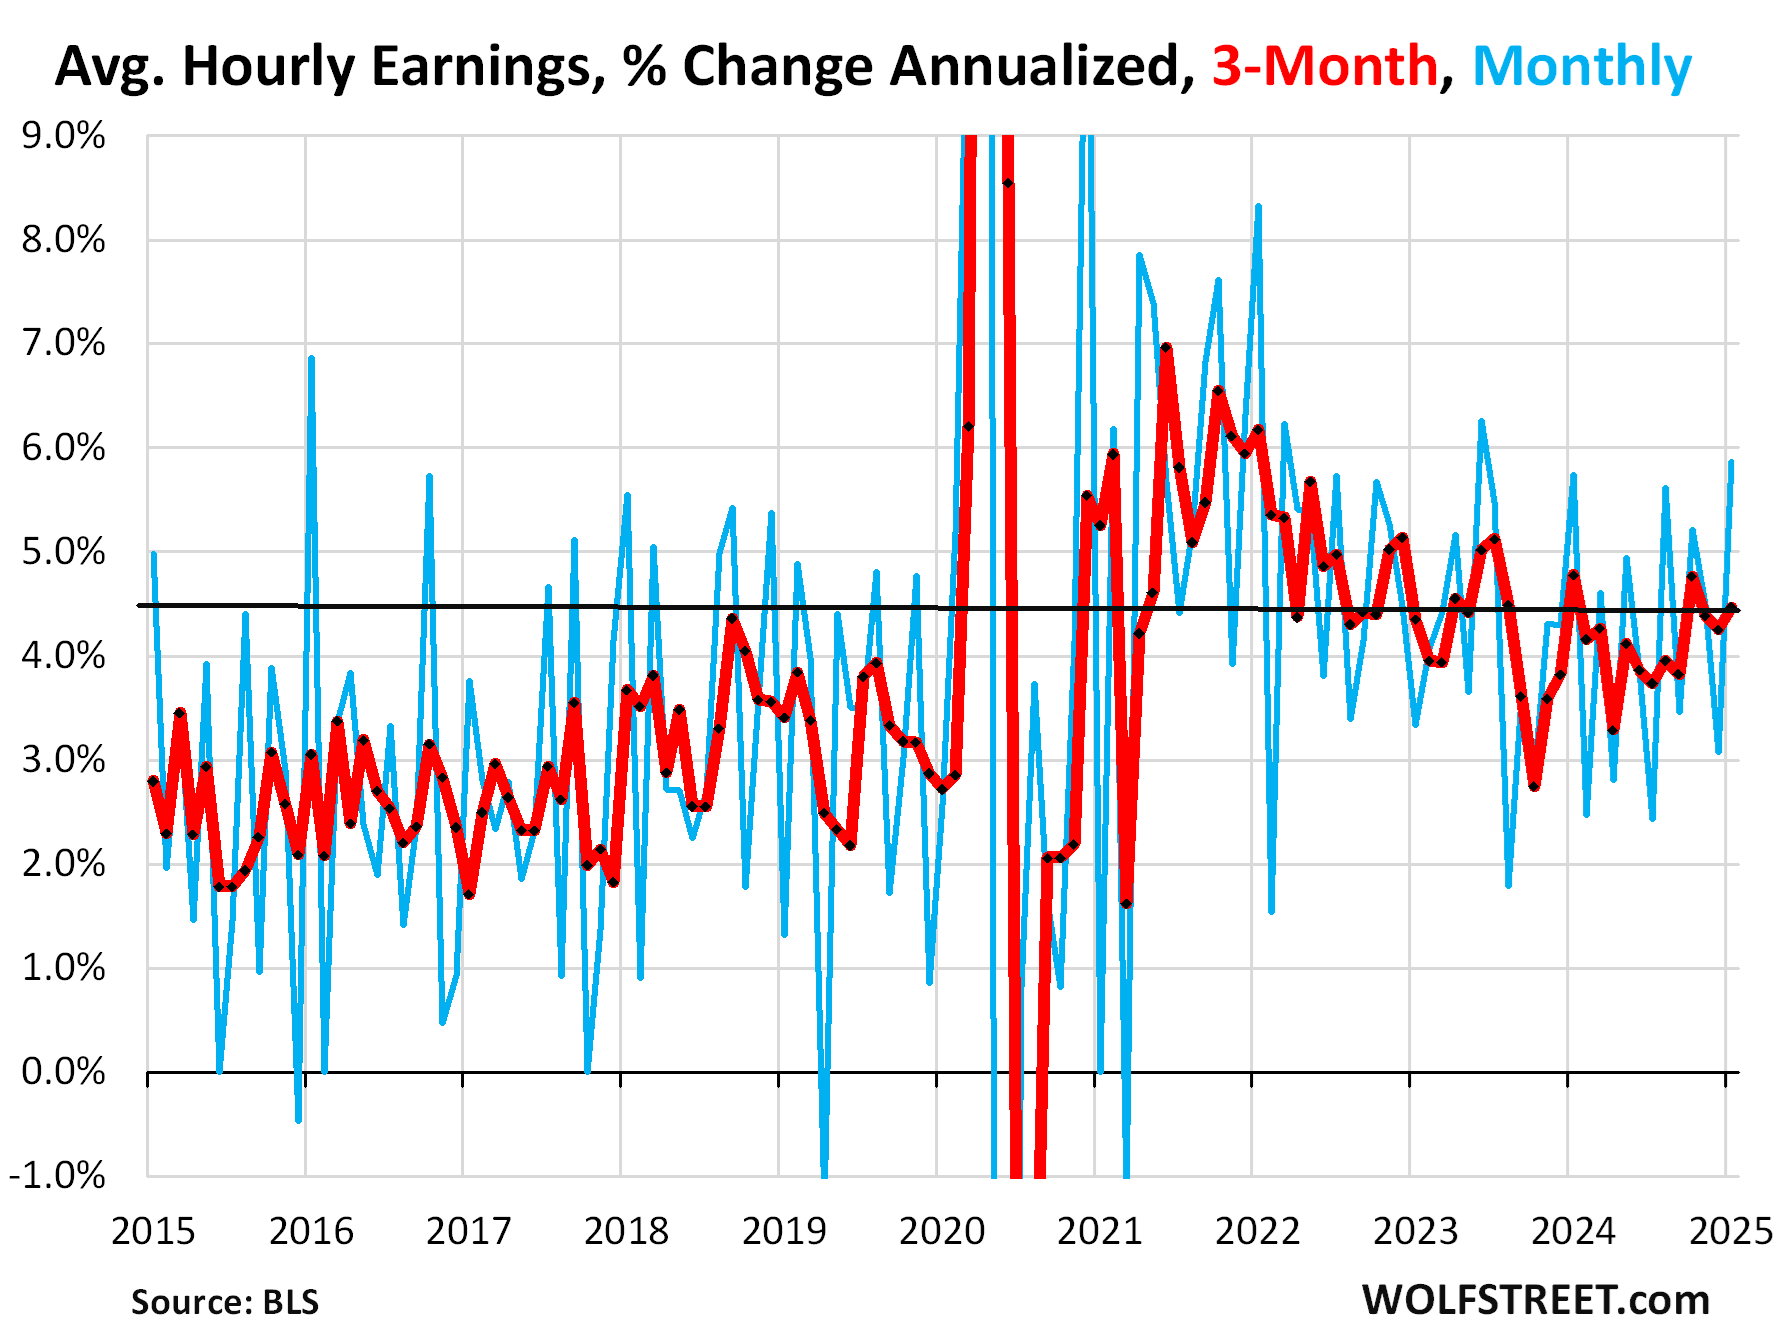
Average hourly earnings in January jumped by 0.48% (5.9% annualized), the biggest increase since June 2023. And the prior three months were revised higher.
This caused the three-month average to accelerate to +4.5% annualized (red):
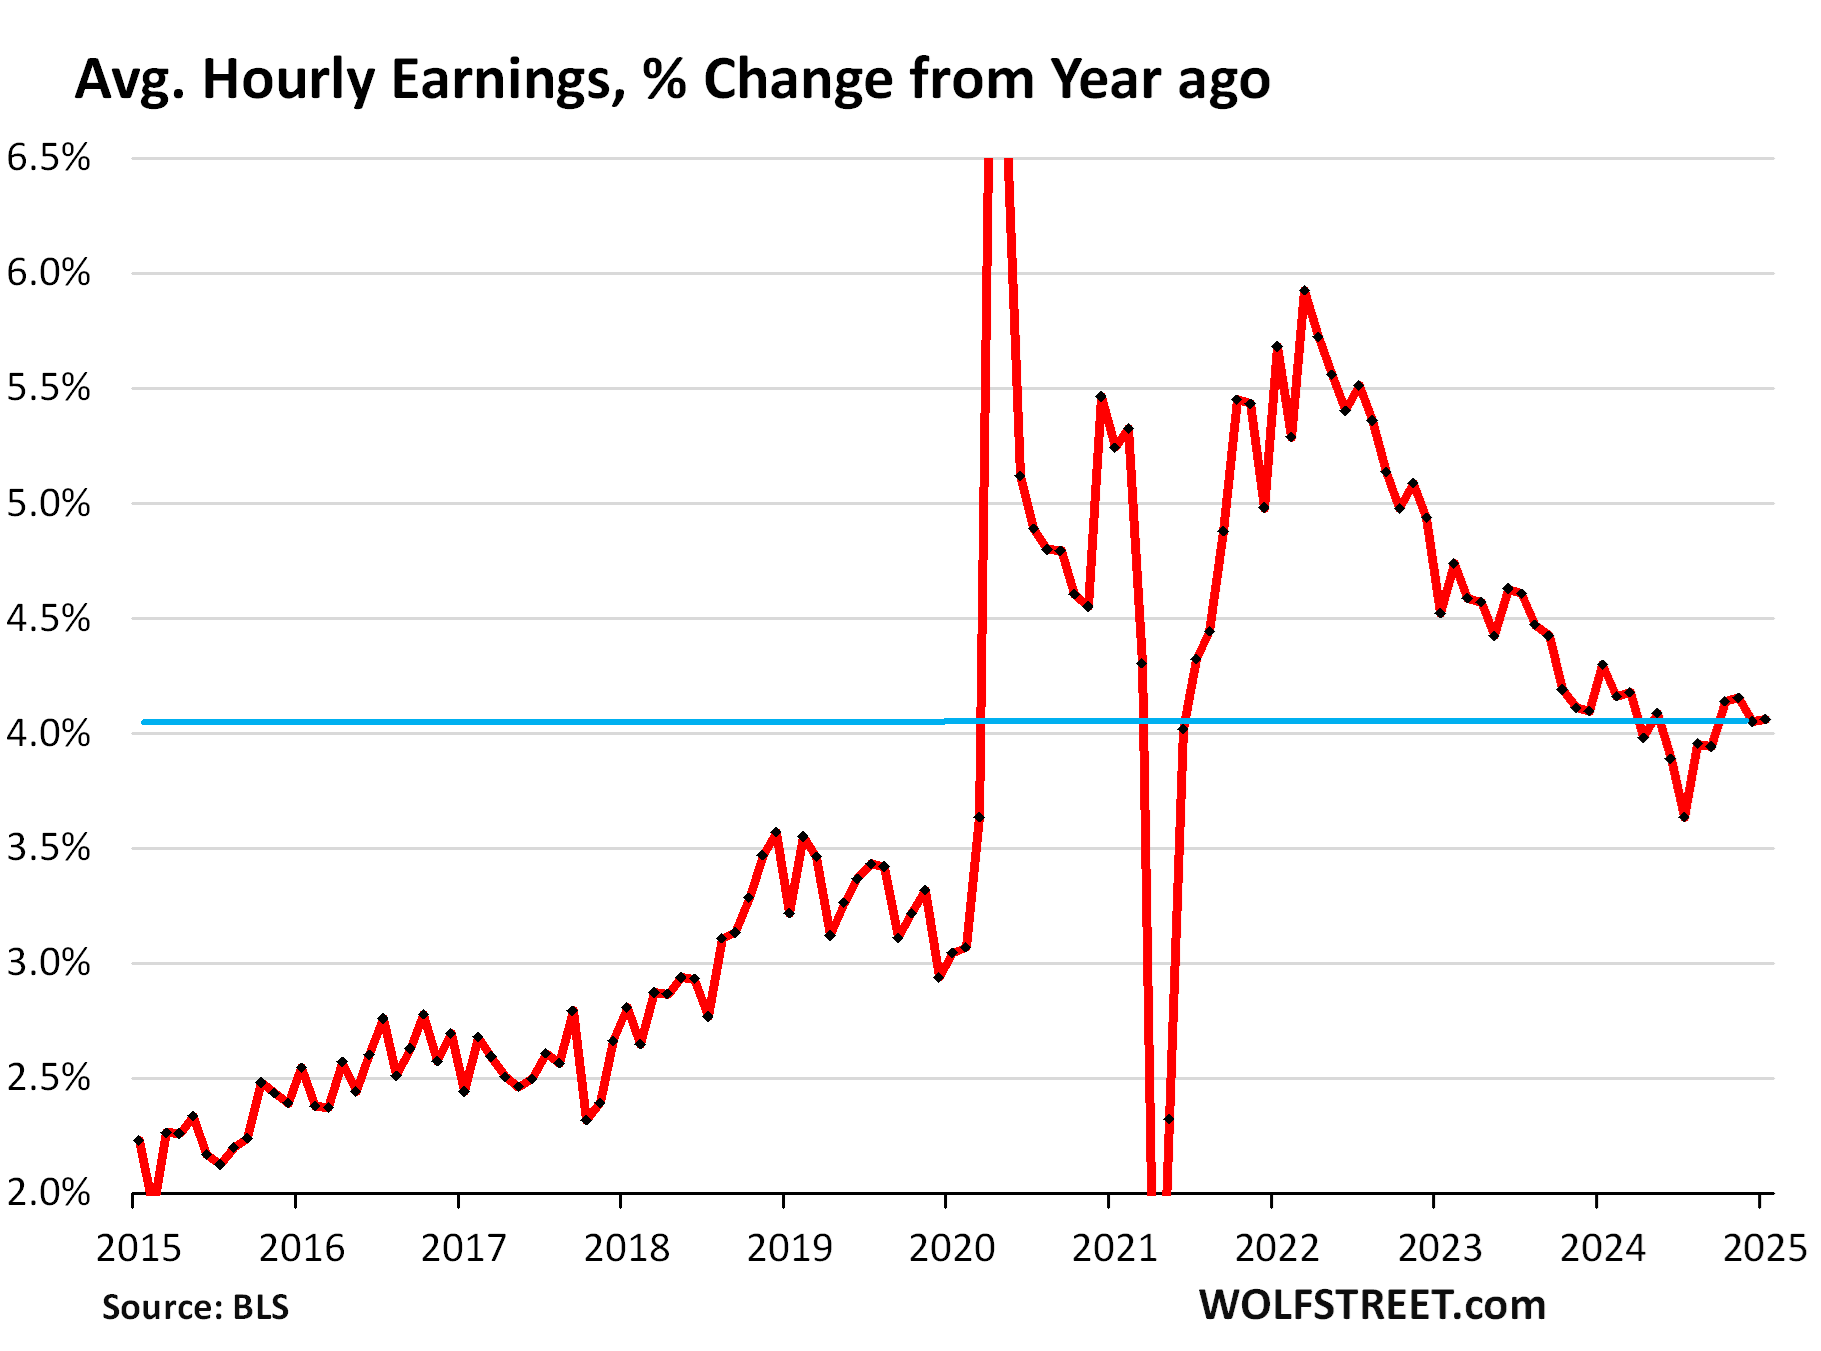
Average hourly earnings year-over-year were also revised higher going back to mid-2024 and in January rose by 4.1%, the fourth month in a row above 4%.
The Fed complained about the lack of immigration data in the labor market figures, lamenting that it has to make policy decisions based on employment data that didn’t include the massive wave of immigrants, and having to wait for a long time before the adjustments and revisions are made.
Fed governor Michelle Bowman, in a speech a week ago, was one of the latest, exhorting government agencies to provide more accurate immigration data on a timelier basis. This is what the said:
“I hope the revision of the Bureau of Labor Statistics labor data, which will be released next week, will more accurately capture the changing dynamics of immigration and net business creation and bring more clarity on the underlying pace of job growth.
“It is crucial that U.S. official data accurately capture structural changes in labor markets in real time, such as those in recent years, so we can more confidently rely on these data for monetary and economic policymaking.
“In the meantime, given conflicting economic signals, measurement challenges, and significant data revisions, I remain cautious about taking signal from only a limited set of real-time data releases.”
With these revisions of employment and unemployment data, the Fed now has further support for its pivot to wait-and-see, with the revised unemployment rate at 4.0%, well below the Fed’s projections; with nonfarm job growth solid, particularly over the past three months (+237,000 on average); and with average hourly wages growing at a faster rate (+4.5% three-month average annualized, +4.1% year-over-year) than previously reported.
Enjoy reading WOLF STREET and want to support it? You can donate. I appreciate it immensely. Click on the beer and iced-tea mug to find out how:

Would you like to be notified via email when WOLF STREET publishes a new article? Sign up here.
![]()
The post Huge Upward Adjustment to Employment & Labor Force as Wave of Immigrants is Finally Included, Unemployment Drops, Wage Growth Accelerates: The Annual Revisions Are Here appeared first on Energy News Beat.