
Energy News Beat
By Wolf Richter for WOLF STREET.
The summary could go something like this in terms of the past three years: More workers (employment +7.79 million, or +5.0%, BLS data), earning more money (average hourly earnings +13.4%), boosted total disposable income (+20%, BEA data). And over these three years, these workers added to their debts but at a slower pace (+13.8%) than their income grew (+20%). So the overall burden of their debts in terms of their income declined even further. This is not to say that subprime – a small subset that is always in trouble, which is why it’s called “subprime” – isn’t, as always, in trouble.
Total household debt outstanding inched up by $93 billion in Q4, or by 0.5%, from Q3, to $18.0 trillion, according to the Household Debt and Credit Report from the New York Fed today. Year-over-year, total household debt grew by 3.0%:
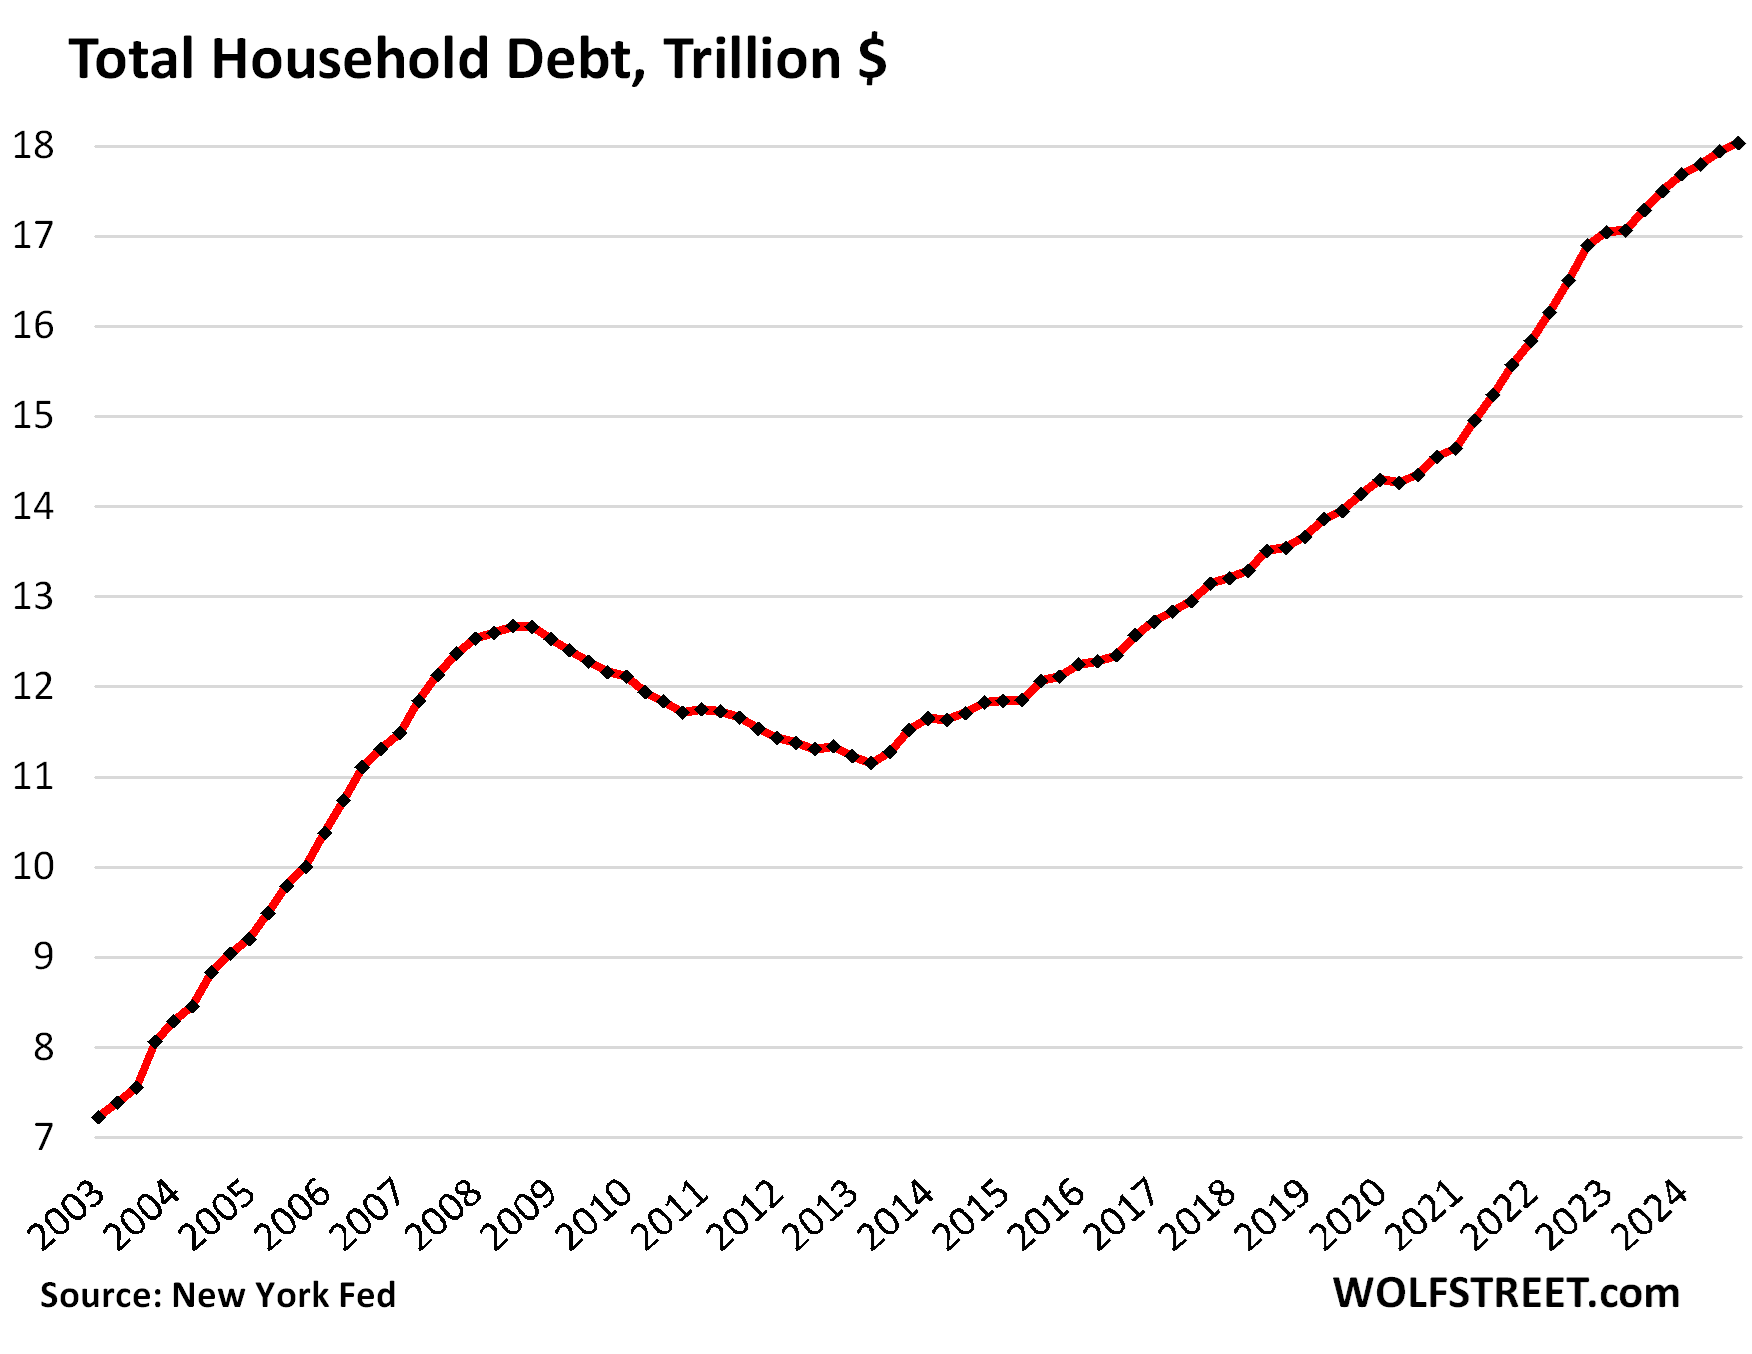
Each category of household debt – mortgages, HELOCs, auto loans, credit cards, other revolving credit (including BNPL), and student loans – increased in Q4, some of it barely. We’ll get into the weeds of each category in separate articles over the next few days. Today, we look at the overall debt, its burden, delinquencies, collections, foreclosures, and bankruptcies.
The burden of household debt: Debt-to-income ratio.
To view the overall burden of debt on households, while accounting for more workers and higher incomes, we use the debt-to-disposable-income ratio.
Disposable income, released by the Bureau of Economic Analysis, is household income from all sources except capital gains, minus payroll taxes: So income from after-tax wages, plus income from interest, dividends, rentals, farm income, small business income, transfer payments from the government, etc. This is essentially the cash that consumers have available to spend on housing, food, toys, debt payments, etc. And what they don’t spend, they save.
- From Q3 to Q4, disposable income +1.3%, total debts +0.5%.
- Year-over-year, disposable income +5.1%, total debts +3.0%.
So quarter-over-quarter and year-over-year, disposable income rose at a faster pace than household debts, and the burden of the debt on households declined further. We wish that were true for the federal government’s finances.
The resulting debt-to-income ratio of 82.0% in Q4 was the lowest ratio in the data going back to 2003, except for a few quarters during the free-money-stimulus era that had briefly inflated disposable income beyond recognition.
So the aggregate balance sheet of consumers is in good shape. The heavily leveraged economic entities in the US are the federal government and businesses, not consumers. This balance-sheet strength of consumers — 65% own their own homes, over 60% hold equities, and their debt burden is relatively low — explains in part why consumer spending has been so strong, despite the higher interest rates.
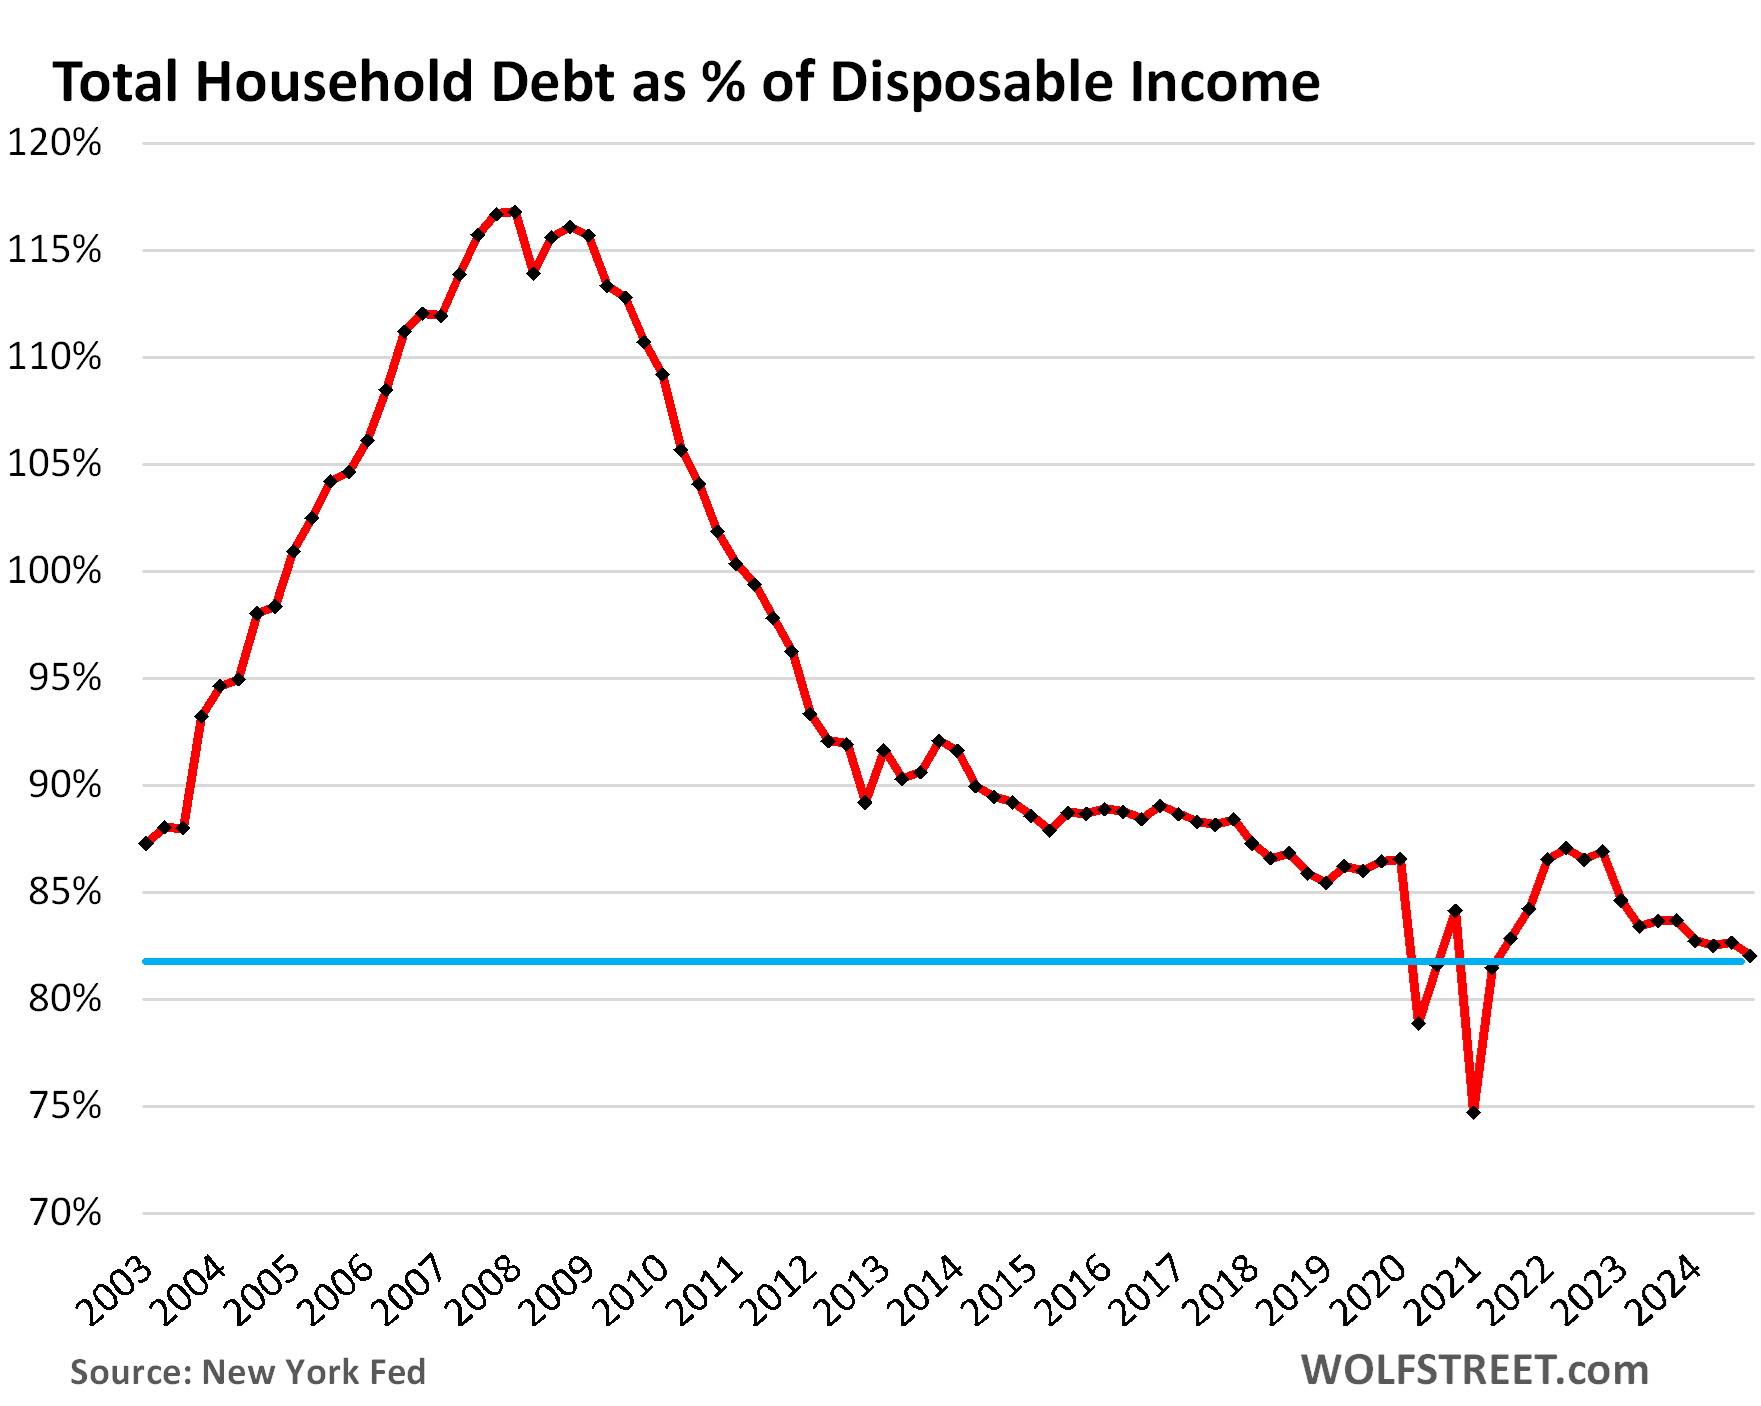
This wasn’t always so. In the early 2000s, households piled on huge debts in relationship to their incomes, and their debt-to-disposable-income ratio spiked in five years from 88% in 2003 to 117% in 2007. That this wasn’t going to work out should have been clear. And it didn’t work out, and it contributed to blowing up the financial system that had provided this debt.
But our Drunken Sailors, as we lovingly and facetiously have come to call them, have learned a lesson and have become a sober bunch, most of them, not all.
Free-Money is over.
Subprime means bad credit, not low income. A small subset of our Drunken Sailors has subprime credit scores because they’ve been behind with their payments, have defaulted on their debts and other obligations, etc. But low-income people cannot borrow at all or only very little. It’s the people with higher incomes that have access to lots of credit that get into it over their heads and fall behind. People with good incomes early on in their careers fall into this trap easily, and eventually get out of it again.
Subprime isn’t a permanent condition, but a phase that consumers move into and out of: Some people get into trouble, and fall behind on their payments, and their credit scores drop to subprime, while others are curing their credit problems and are working their way out of a subprime credit rating. It’s in constant flux.
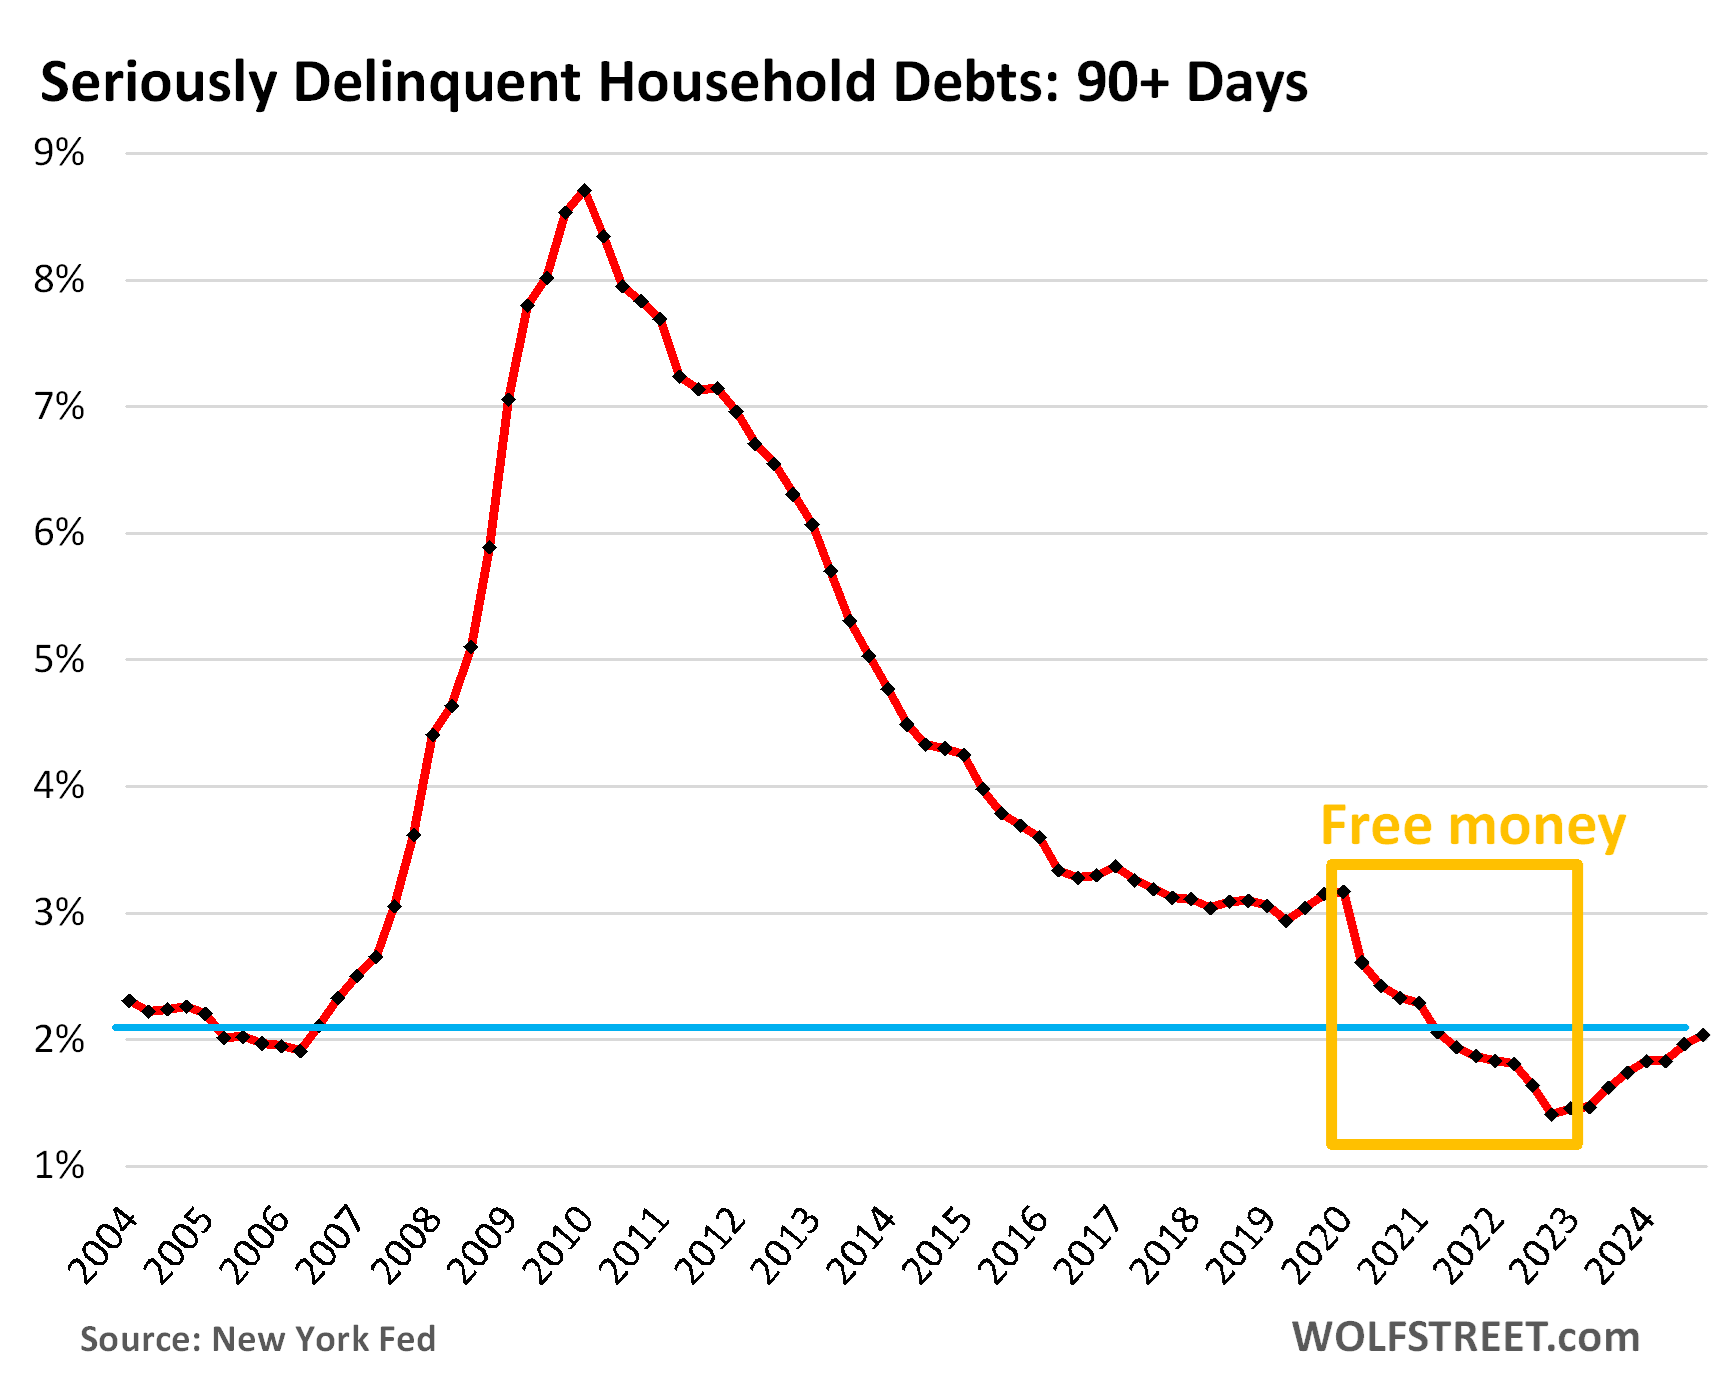
Serious delinquencies after Free-Money: Household debts that were 90 days or more delinquent by the end of Q4 inched up to 2.0%. Beyond the Free-Money era (gold box), we have to look back nearly 20 years to see a similarly low rate.
In the Good Times of 2018-2019, before Free-Money, the serious delinquency rate was about 3%.
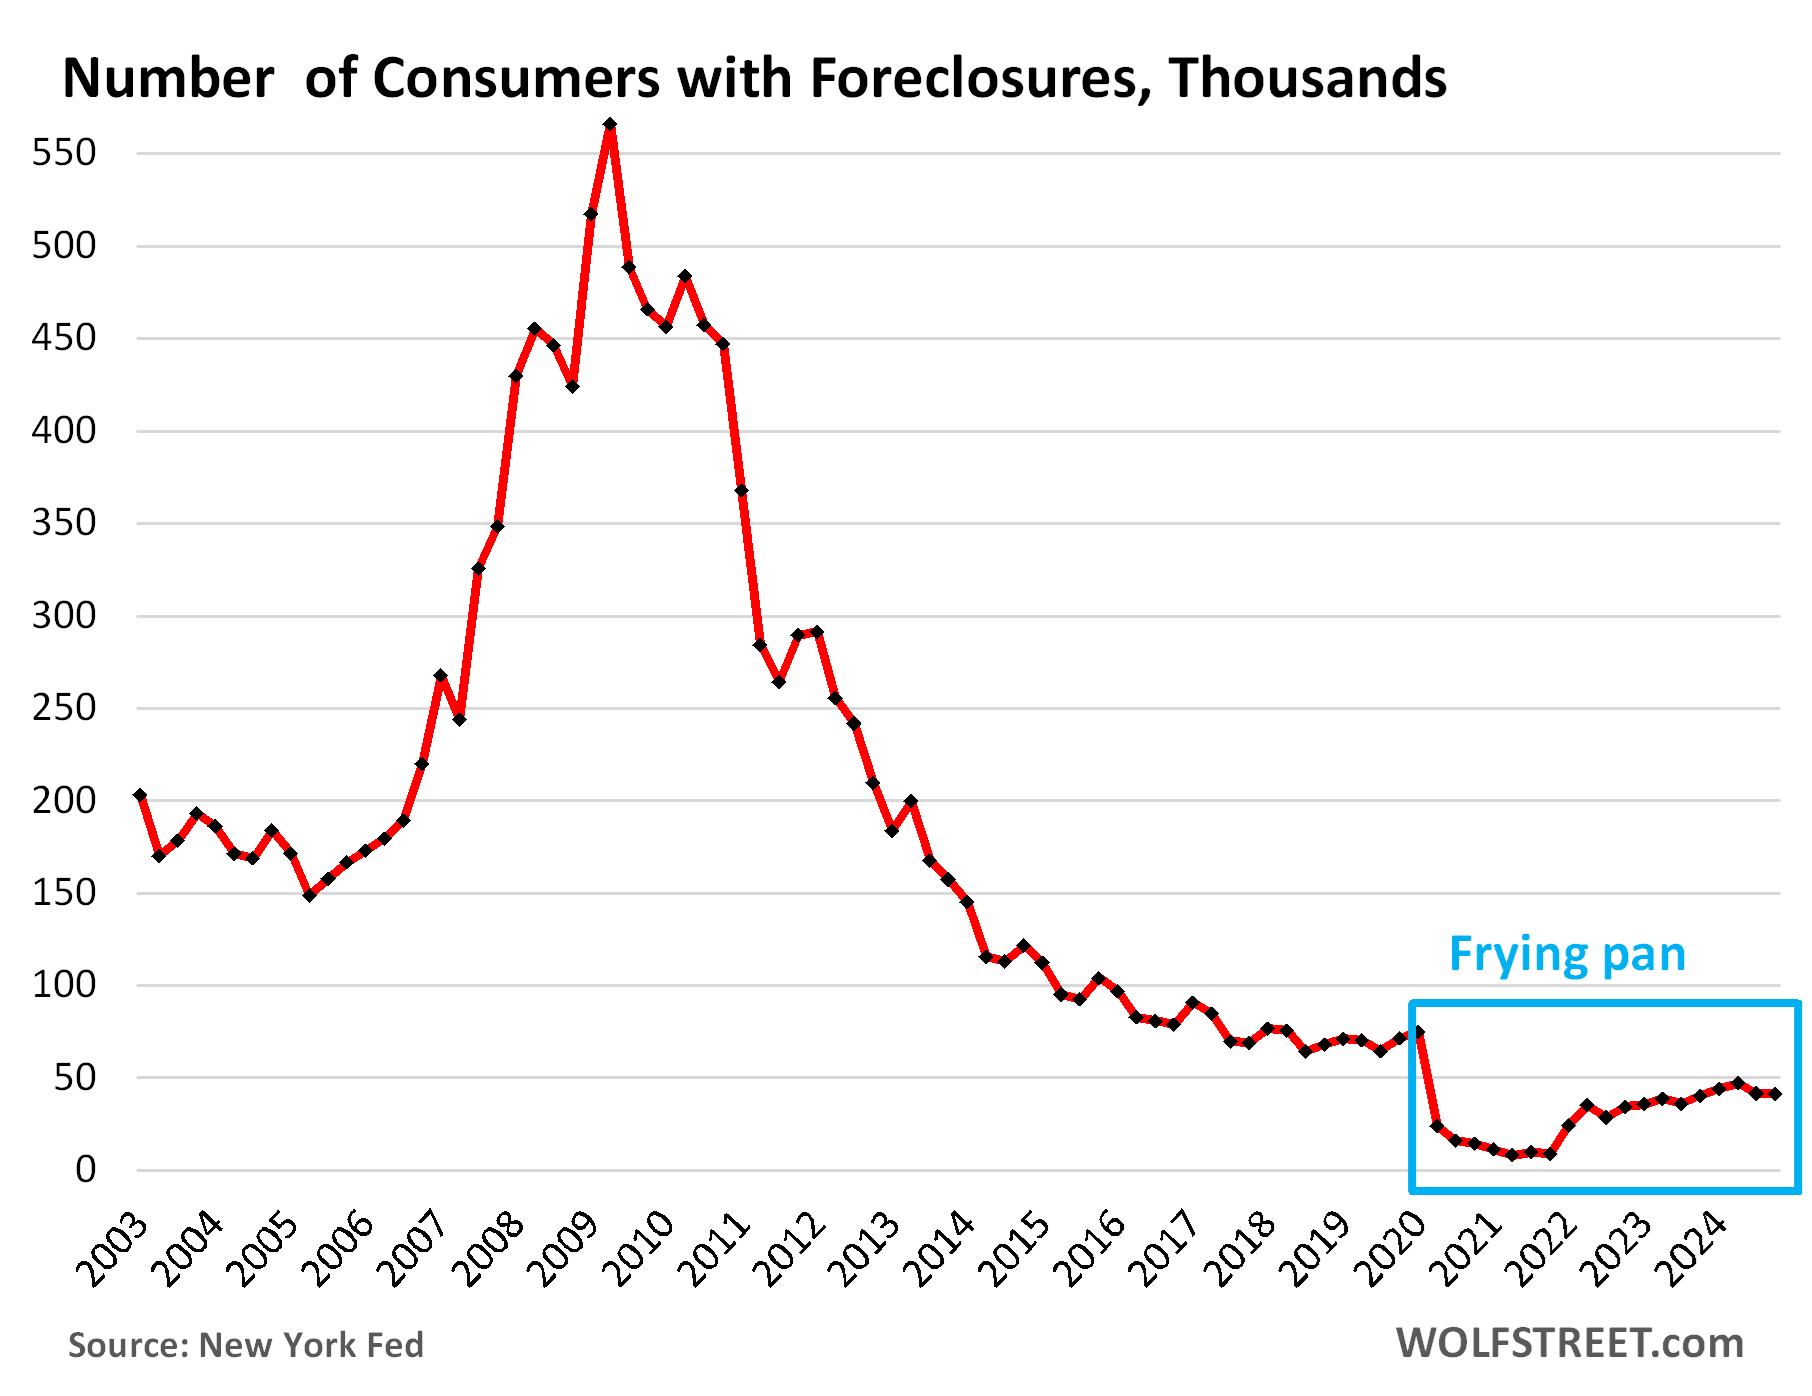
The foreclosures frying-pan pattern. The number of consumers with foreclosures in Q4 dipped to 41,220, the second months in a row of declines and at ultra-low levels, compared to 65,000 to 90,000 in the Good Times of 2018-2019.
During the Free-Money era, which included government-sponsored mortgage-forbearance programs under which foreclosures were essentially impossible, the number of foreclosures fell to near zero.
What is keeping foreclosures so low currently is that, after years of ballooning home prices, most strung-out homeowners can sell their home for more than they owe on it, pay off the mortgage, and walk away with some cash, and their credit intact.
It’s only when home prices spiral down for years that foreclosures can become a problem, if it coincides with big job losses.
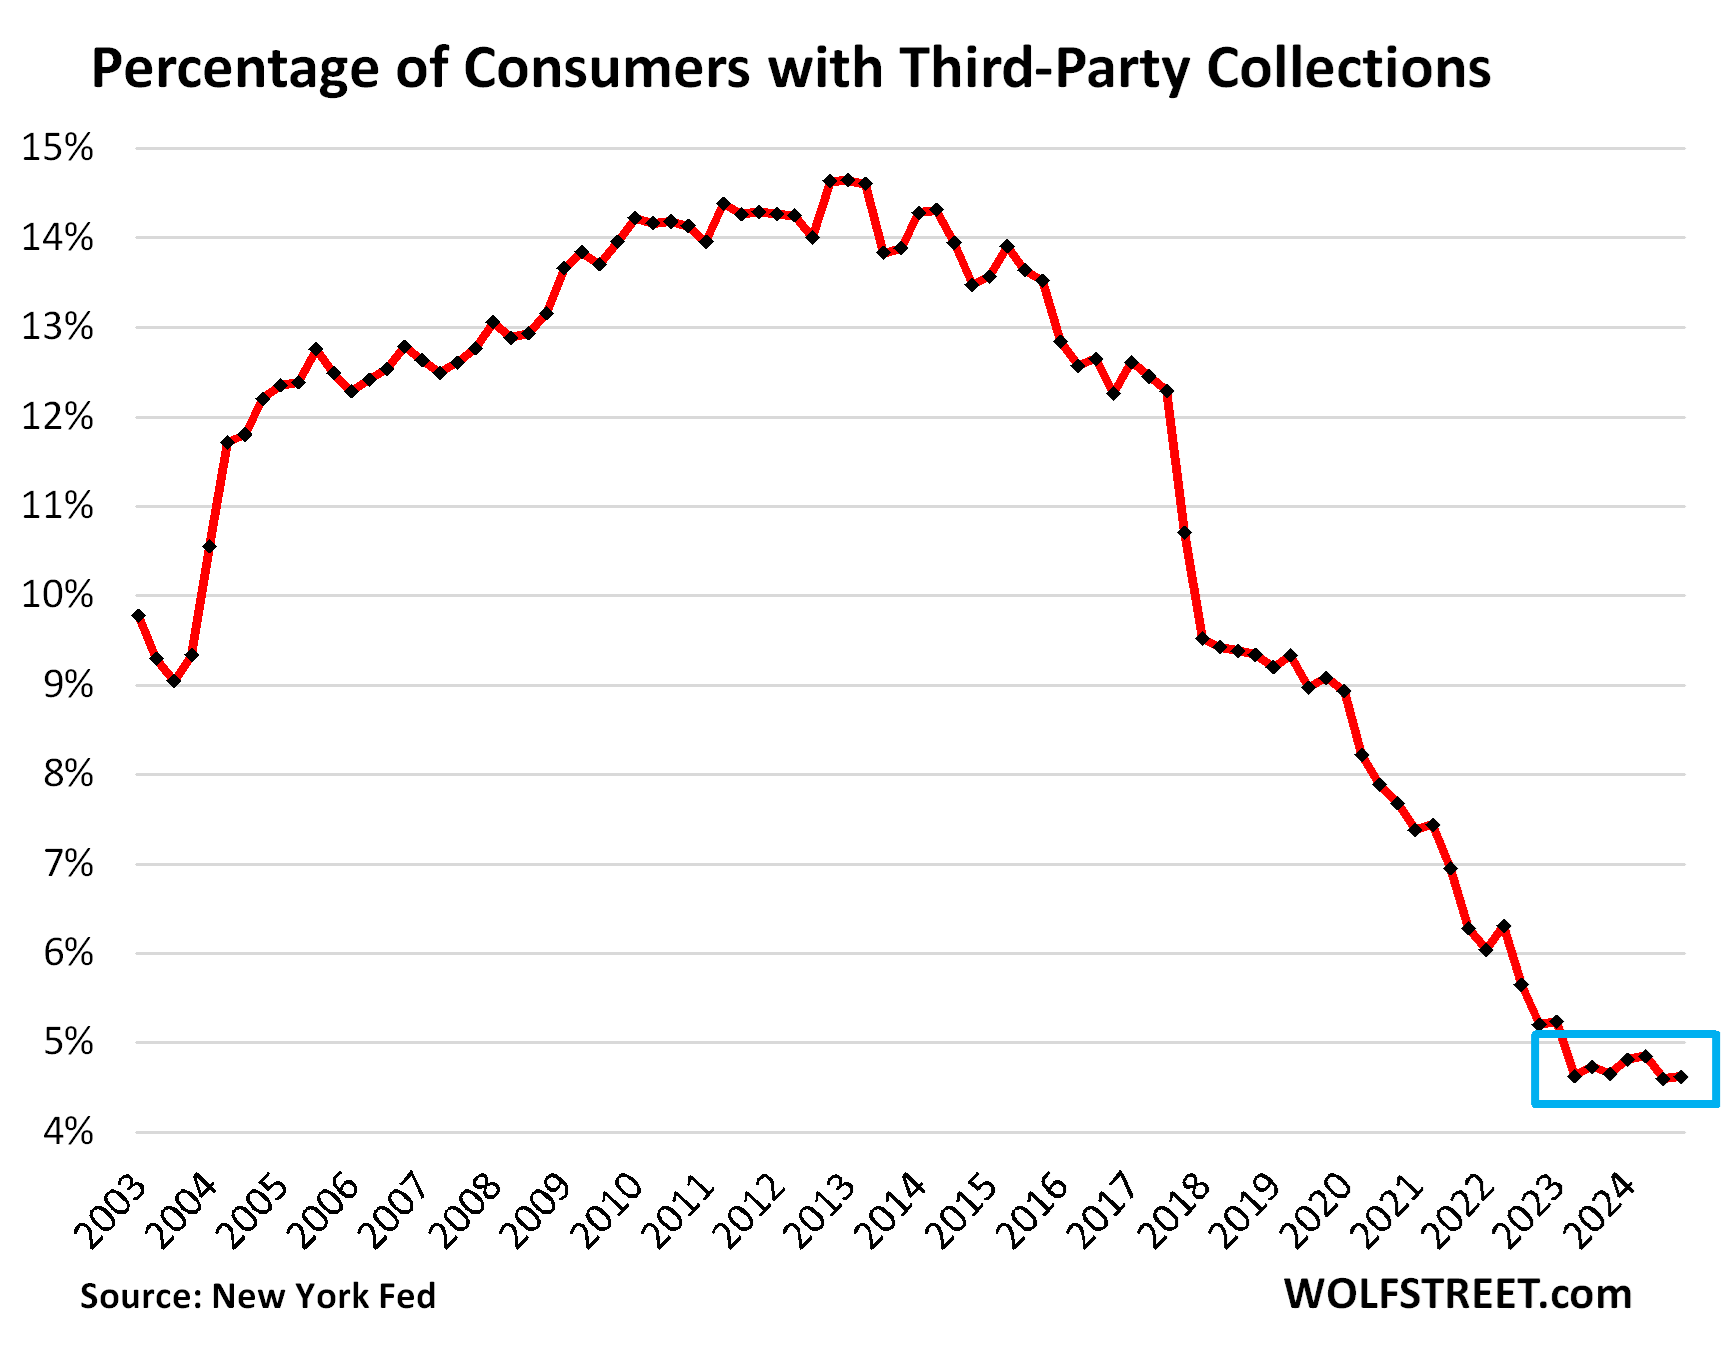
Third-party collections still at rock bottom. A third-party collection entry is made into a consumer’s credit history when the lender reports to the credit bureaus, such as Equifax, that it sold the delinquent loan (for cents on the dollar) to a collection agency. The New York Fed obtained this data on third-party collections in anonymized form through its partnership with Equifax.
The percentage of consumers with third-party collections has been at the record low level of around 4.6% for nearly two years:
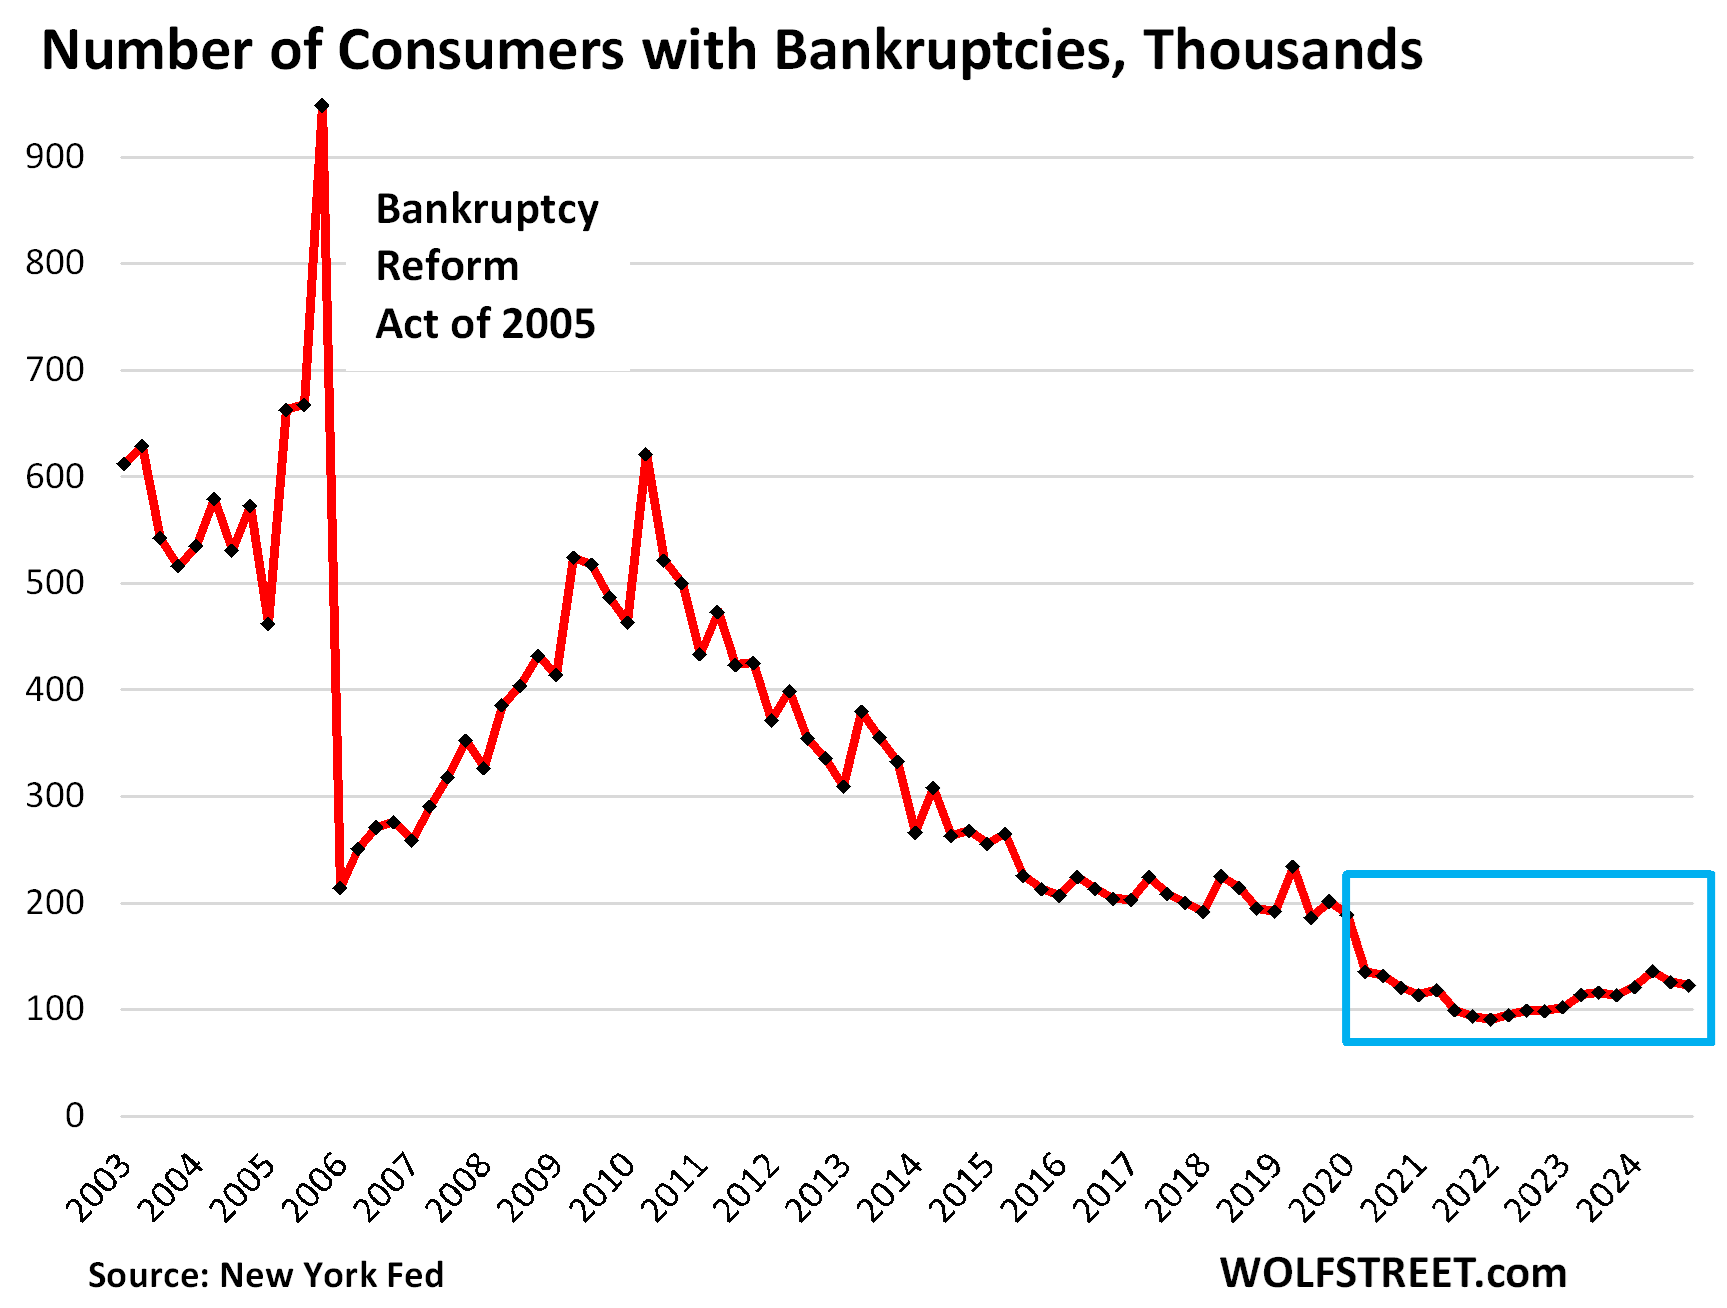
The consumer bankruptcies frying-pan pattern. The number of consumers with bankruptcy filings dipped to 122,660 in Q4, the second quarter in a row of declines, and lower than any time before Free-Money. During the Good Times before the pandemic, the number of consumers with bankruptcy filings ranged from 186,000 to 234,000, which had also been historically low.
An odd-looking frying-pan pattern with a short handle.
We’re going to get into the weeds of housing debt, credit card debt, and auto debt in separate articles over the next few days. Next one up is housing debt. So stay tuned.
Enjoy reading WOLF STREET and want to support it? You can donate. I appreciate it immensely. Click on the beer and iced-tea mug to find out how:

Would you like to be notified via email when WOLF STREET publishes a new article? Sign up here.
![]()
The post Household Debts, Debt-to-Income Ratio, Serious Delinquencies, Collections, Foreclosures, Bankruptcies: Our Drunken Sailors’ Debts in Q4 2024 appeared first on Energy News Beat.