UK government funding scheme set to boost offshore wind capacity

Energy News Beat

The UK has announced the Clean Industry Bonus (CIB), a new incentive scheme looking to increase investments in the offshore wind sector and push the country closer to its goal of decarbonising its energy system by 2030.

The scheme will provide an initial £27m ($33.5m) in funding for every gigawatt of capacity from offshore wind projects.

To qualify for the CIB, developers must commit at least £100m per gigawatt for fixed-bottom offshore wind farms and £50m per gigawatt for floating offshore wind farms.

If an application for the project exceeds the minimum investment standards it will be considered for the incentive. The CIB application window will close on April 14. Following the application window, the UK Department for Energy Security and Net Zero will assign a score to submitted CIB extra proposals.

The UK has already revealed plans to expand its current offshore wind capacity from 15GW to between 43GW and 50GW by 2030. The UK’s grid operator did say last year that the government’s target to source 95% of power from clean energy was a major but attainable challenge.

The country will hold more renewable auctions later this year, in which developers will bid for government-backed price guarantees on generated electricity. The new funding will be awarded through the contracts given in these auctions.

The post UK government funding scheme set to boost offshore wind capacity appeared first on Energy News Beat.


Rewriting Women into Maritime History initiative goes global

Energy News Beat

EuropeOperations

The Lloyd’s Register-backed Rewriting Women into Maritime History initiative to uncover and showcase the critical role of women in the maritime sector, past and present has entered a new, international phase.

Launched in the UK and Ireland in 2023, the programme uses archival material held by maritime organisations, as well as oral histories to piece together their stories, showcasing them publicly through the SHE_SEES exhibition. SHE_SEES debuted at the home of the International Maritime Organization (IMO) during London International Shipping Week 2023, and is currently on tour, with a residency at Portsmouth Historic Dockyard until August 2025.

By highlighting the expertise, experience and leadership of women, the programme helps reframe the narrative of a predominantly masculine industry and encourages more people to take up the opportunities offered by a career in the maritime sector today. Figures from the IMO show that women currently account for 29% of the overall industry workforce, and just 2% of seafarers in the crewing workforce.

Now, Rewriting Women into Maritime History and the SHE_SEES exhibition are looking to expand their impact internationally, by telling the stories of women working in the maritime sector in another nine countries around the world. These stories will be captured over the next three years, starting in 2025 with Greece, the Netherlands and India.

The contemporary component of SHE_SEES is led by portrait photographer Emilie Sandy who is encouraging more women to get involved and share their own stories via the participatory photography element, SHE_SEES HER VOICE. This will enable a broader range of women in the sector to connect and be represented, working with a photographer to empower them to share their own stories, and to shape and control their own narrative.

Dr Jo Stanley, a maritime historian specialising in gender and diversity, commented: “Women have been contributing to maritime life for centuries. Seagoing doctors and pirates, laundresses and captain’s deputies, navigation teachers and cartographers. They’ve been overlooked. But from the 1970s, they really took off. And they’re making progress fast. This project encouragingly connects past, present and future.”

Linked to the initiative, a new film – Women in Shipbuilding – has been produced in collaboration with Historic England uncovering the history of women in shipbuilding in the UK, viewable below.

The post Rewriting Women into Maritime History initiative goes global appeared first on Energy News Beat.


MOL details trial of laser to remove rust and coatings

Energy News Beat

Japan’s largest shipowner has teamed up with a top yard and tech firm Furukawa Electric to trial a laser system to remove rust and coatings from a bulk carrier. 

Mitsui OSK Lines (MOL) worked with Tsuneishi Shipbuilding to use Furukawa’s InfraLaser system when a bulk carrier went in for a regular dry dock. 

“During ship repairs, rust and coatings are removed for hull inspection and repainting. However, the current sandblasting method, which removes rust and coatings by blasting abrasive materials against the surface, scatters waste materials and removed paint as debris, necessitating recovery efforts,” MOL explained in a release. 

By replacing sandblasting with a laser blasting method that generates minimal waste, dust, and noise, MOL expects to reduce environmental impact and improve occupational health.

MOL said it aims to make the use of laser blasting more common place going forward, also touting the system’s robot, saving labour costs. 

The post MOL details trial of laser to remove rust and coatings appeared first on Energy News Beat.


Seafarer salaries and retention rates on the rise

Energy News Beat

Operations

Retaining seafarers has improved slightly over the past year, thanks in part to salary raises, the annual Crew Managers’ Survey by Danica Crewing Specialists has revealed.

In its survey of in-house crew managers in shipowning and shipmanagement companies, almost 90% reported that they had increased salaries in 2024. Only 7% said they had not raised crew wages over the past year. Companies were more generous too – with increases above those reported in the 2023 survey, except for junior ratings.

Retention rates are reported to have improved. The survey reveals that the fluctuation of seafarers has generally reduced, with 41% of crew managers reporting that the retention rate has improved during the past 12 months, compared to only 29% in the previous survey period. However, 23% of companies did say they felt the retention rate has worsened, although this is a decrease compared to the 36% in the 2023/24 survey.

Overall, the findings of Danica’s Crew Managers’ Survey 2024 showed a positive improvement, with fewer respondents saying the recruitment situation had worsened over 2024. However, still about a third (31%) found that the intake of new competent hands has become worse or much worse in the past 12 months, although this is down from the 46% saying the same in 2023. 

Henrik Jensen, CEO of Danica Crewing Specialists, commented: “This indicates that it is not a shortage of seafarers which concerns crew managers but rather a shortage of competent seafarers.”

The post Seafarer salaries and retention rates on the rise appeared first on Energy News Beat.


Spire Global sues Kpler

Energy News Beat

Spire Global is suing Kpler, claiming the Belgian tech firm has failed to follow through on its plans to buy Spire Maritime, an AIS data provider. 

On November 13 last year, Spire Global entered into a share purchase agreement with Kpler to sell its maritime business. Since then, however, Kpler has failed to consummate the closing, Spire Global stated in a release. 

“Buyer has cited various reasons for declining to close, which the company has rejected,” Spire Global stated, revealing that it has filed a complaint in the Delaware Court of Chancery this week in a bid to get the deal done, warning shareholders that it faces significant debt problems if the Kpler acquisition fails to go through, something that has seen Spire Global’s share price tank in recent days. 

Kpler has made several noticeable acquisitions in recent years. Back in 2021, the company acquired New York-headquartered cargo data company ClipperData and last year it bought two well-known ship tracking brands, MarineTraffic and FleetMon.

The post Spire Global sues Kpler appeared first on Energy News Beat.


How the IMO’s Carbon Intensity Indicator could half shipping’s climate emissions

Energy News Beat

Ahead of a big green meeting at the International Maritime Organization next week, John Maggs from the Clean Shipping Coalition writes on how getting a global fuel standard and levy over the line will set us up for the future.

The international shipping sector provides an outsized and growing contribution to the climate crisis. Slower, more efficient ships can help slash climate emissions, but this will not happen without ambitious regulation.

Fortunately, the International Maritime Organization’s (IMO) current revision of the rules around its Carbon Intensity Indicator, a metric for measuring and regulating ships’ carbon emissions provides such an opportunity. Governments are consulting and reviewing evidence on barriers to efficiency and potential solutions, with a final decision on improving the indicator due by January 1 2026. 

If properly designed, these new rules could address almost half of shipping’s climate impacts and deliver massive ocean health co-benefits. But the outcome is far from certain.

The scope of the problem

The vast majority of internationally traded goods travel by ship, and these massive ships burn a lot of fuel. As a result, the shipping industry generates around three per cent of all climate emissions globally—a contribution equivalent to that of the whole economy of a country like Germany or Japan. 

Ships also undermine ocean health. I am not just talking about the environmental harm caused by oil spills when a tanker runs aground or sinks. As we have seen recently in the Black Sea this remains a very serious problem, but ships are also responsible for a myriad of other routine yet damaging operational practices—some legal, some not—that threaten ocean wildlife: oil and chemical discharges, toxic paint coatings, underwater noise pollution, sewage and grey water discharges, and the dumping of plastics, to name just a few.

Human health is also threatened, with an estimated 250,000 deaths and millions of childhood asthma cases annually caused by toxic air pollution from fossil-fuel powered shipping.

In all these areas, regulation has failed to keep up with the growth of the industry. Sporadic and weak measures mean the problem keeps getting worse.

Turning the page?

The Carbon Intensity Indicator revision provides the IMO with an important opportunity to address both the climate and ocean health impacts of global shipping and turn the tide on some of these problems.

By far the most effective way to reduce ship climate impacts is to slow ships down. A ten per cent speed reduction can lower the emissions of an individual ship’s journey by almost 20%. Even though this will mean, in some cases, using additional ships, there are still large net emission reduction benefits. What’s more, slowing ships down can happen immediately—we don’t need new technology just to take our foot off the gas pedal. 

We must also look at wind power. In a case of “back to the future,” new high-tech sails can dramatically reduce fuel burn (and thus emissions) on existing ships, and can go even further when new ships are designed from scratch to use wind as their primary means of propulsion. No other transport mode can harness wind power directly in this way – it is shipping’s climate crisis superpower. 

Most underwater noise pollution is caused by ship propellers, compromising the ability of whales and other marine life to forage and reproduce. Using sails and slowing ships down has a dramatic effect on noise levels, and slower ships are also less likely to strike and kill whales and other marine wildlife. 

Any action that reduces the amount of fuel burned not only reduces climate emissions, but also cuts emissions of everything connected to burning fuel, including the particulates that are harmful to human health. The oily sludge that ship fuels generate, which sadly still often ends up being discharged illegally at sea, is also reduced. 

Reducing fuel burn also decreases the volume of toxic waste produced by the exhaust gas cleaning systems, known as scrubbers, that shipowners are installing to avoid using cleaner fuels. This shocking new waste stream is largely unregulated and dwarfs other shipping pollution in terms of volume.

An outsider looking in could easily assume that ship owners would operate their vessels more efficiently purely out of self-interest and a desire to minimise costs, but there are a number of factors working against this.

For instance, there’s industry’s “split incentive” – whereby the entity responsible for the technical efficiency of a ship and its equipment isn’t always the one paying for the fuel. 

Inefficient ship operation is also often written into long-established conventions and contractual arrangements—the most famous one being the instruction in charter agreements to travel at “utmost dispatch” (quickly) and then wait at the destination if you get there too early. Slowing down and arriving on time would make more sense, and have a massive impact on climate emissions, but would also be a breach of the agreement.

And in a booming market when few ships are without work, an individual owner acting from a business perspective might prefer to speed up and squeeze in an extra trip. Unfortunately, this is the worst approach from a climate, environment and ocean health point of view.

It is rare that a single measure or regulation holds the potential to have such wide-ranging positive impacts on the climate and environmental footprint of an industry. The revision of the IMO’s Carbon Intensity Indicator truly holds the possibility to set the shipping industry on a much more sustainable course. 

Next week’s IMO meeting, which is set to discuss the shipping sector’s impact on the global climate (Intersessional Working Group on Reduction of Greenhouse Gas Emissions from Ships – ISWG-GHG 18) must agree on an ambitious set of new climate measures, including a global zero- and near-zero GHG fuel standard, along with a levy on ship emissions to drive emission reductions and ensure a just climate transition for international shipping. 

However, to keep the cost of the shipping energy transition down and see to it that emission cuts happen quickly enough to meet the IMO GHG strategy’s 2030 and 2040 goals, these measures must be aligned with an ambitious, transparent and enforceable energy efficiency measure. To build a more ocean-friendly shipping industry, governments must close their ears to “special pleading” from industry and make sure both the fuel standard and levy align with the concurrent IMO’s Carbon Intensity Indicator revision, ahead of April’s Intersessional Working Group on Air Pollution and Energy Efficiency.

The post How the IMO’s Carbon Intensity Indicator could half shipping’s climate emissions appeared first on Energy News Beat.


Household Debts, Debt-to-Income Ratio, Serious Delinquencies, Collections, Foreclosures, Bankruptcies: Our Drunken Sailors’ Debts in Q4 2024

Energy News BeatPrice

By Wolf Richter for WOLF STREET.

The summary could go something like this in terms of the past three years: More workers (employment +7.79 million, or +5.0%, BLS data), earning more money (average hourly earnings +13.4%), boosted total disposable income (+20%, BEA data). And over these three years, these workers added to their debts but at a slower pace (+13.8%) than their income grew (+20%). So the overall burden of their debts in terms of their income declined even further. This is not to say that subprime – a small subset that is always in trouble, which is why it’s called “subprime” – isn’t, as always, in trouble.

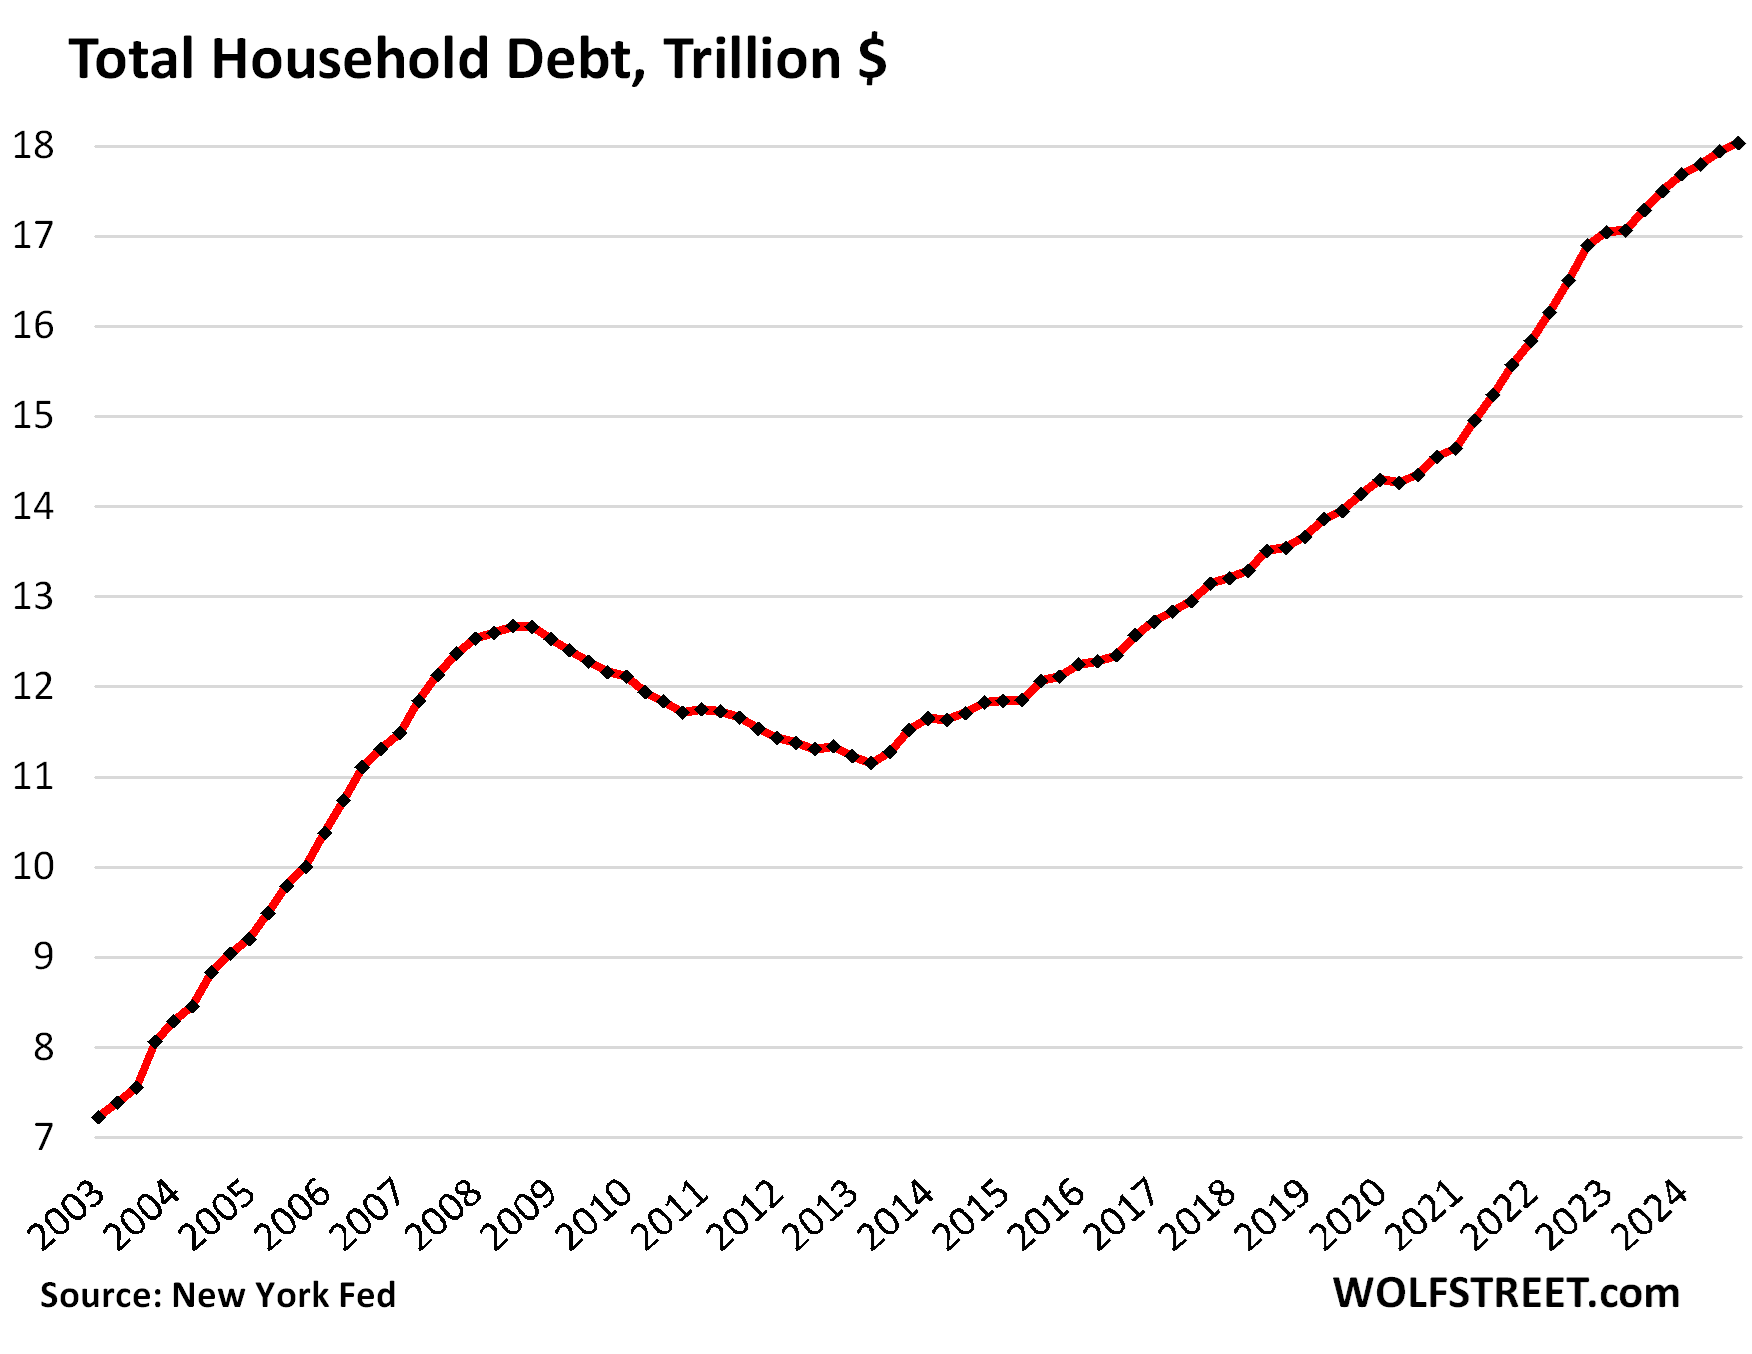
Total household debt outstanding inched up by $93 billion in Q4, or by 0.5%, from Q3, to $18.0 trillion, according to the Household Debt and Credit Report from the New York Fed today. Year-over-year, total household debt grew by 3.0%:
Each category of household debt – mortgages, HELOCs, auto loans, credit cards, other revolving credit (including BNPL), and student loans – increased in Q4, some of it barely. We’ll get into the weeds of each category in separate articles over the next few days. Today, we look at the overall debt, its burden, delinquencies, collections, foreclosures, and bankruptcies.

The burden of household debt: Debt-to-income ratio.

To view the overall burden of debt on households, while accounting for more workers and higher incomes, we use the debt-to-disposable-income ratio.

Disposable income, released by the Bureau of Economic Analysis, is household income from all sources except capital gains, minus payroll taxes: So income from after-tax wages, plus income from interest, dividends, rentals, farm income, small business income, transfer payments from the government, etc. This is essentially the cash that consumers have available to spend on housing, food, toys, debt payments, etc. And what they don’t spend, they save.

  • From Q3 to Q4, disposable income +1.3%, total debts +0.5%.
  • Year-over-year, disposable income +5.1%, total debts +3.0%.

So quarter-over-quarter and year-over-year, disposable income rose at a faster pace than household debts, and the burden of the debt on households declined further. We wish that were true for the federal government’s finances.

The resulting debt-to-income ratio of 82.0% in Q4 was the lowest ratio in the data going back to 2003, except for a few quarters during the free-money-stimulus era that had briefly inflated disposable income beyond recognition.

So the aggregate balance sheet of consumers is in good shape. The heavily leveraged economic entities in the US are the federal government and businesses, not consumers. This balance-sheet strength of consumers — 65% own their own homes, over 60% hold equities, and their debt burden is relatively low — explains in part why consumer spending has been so strong, despite the higher interest rates.
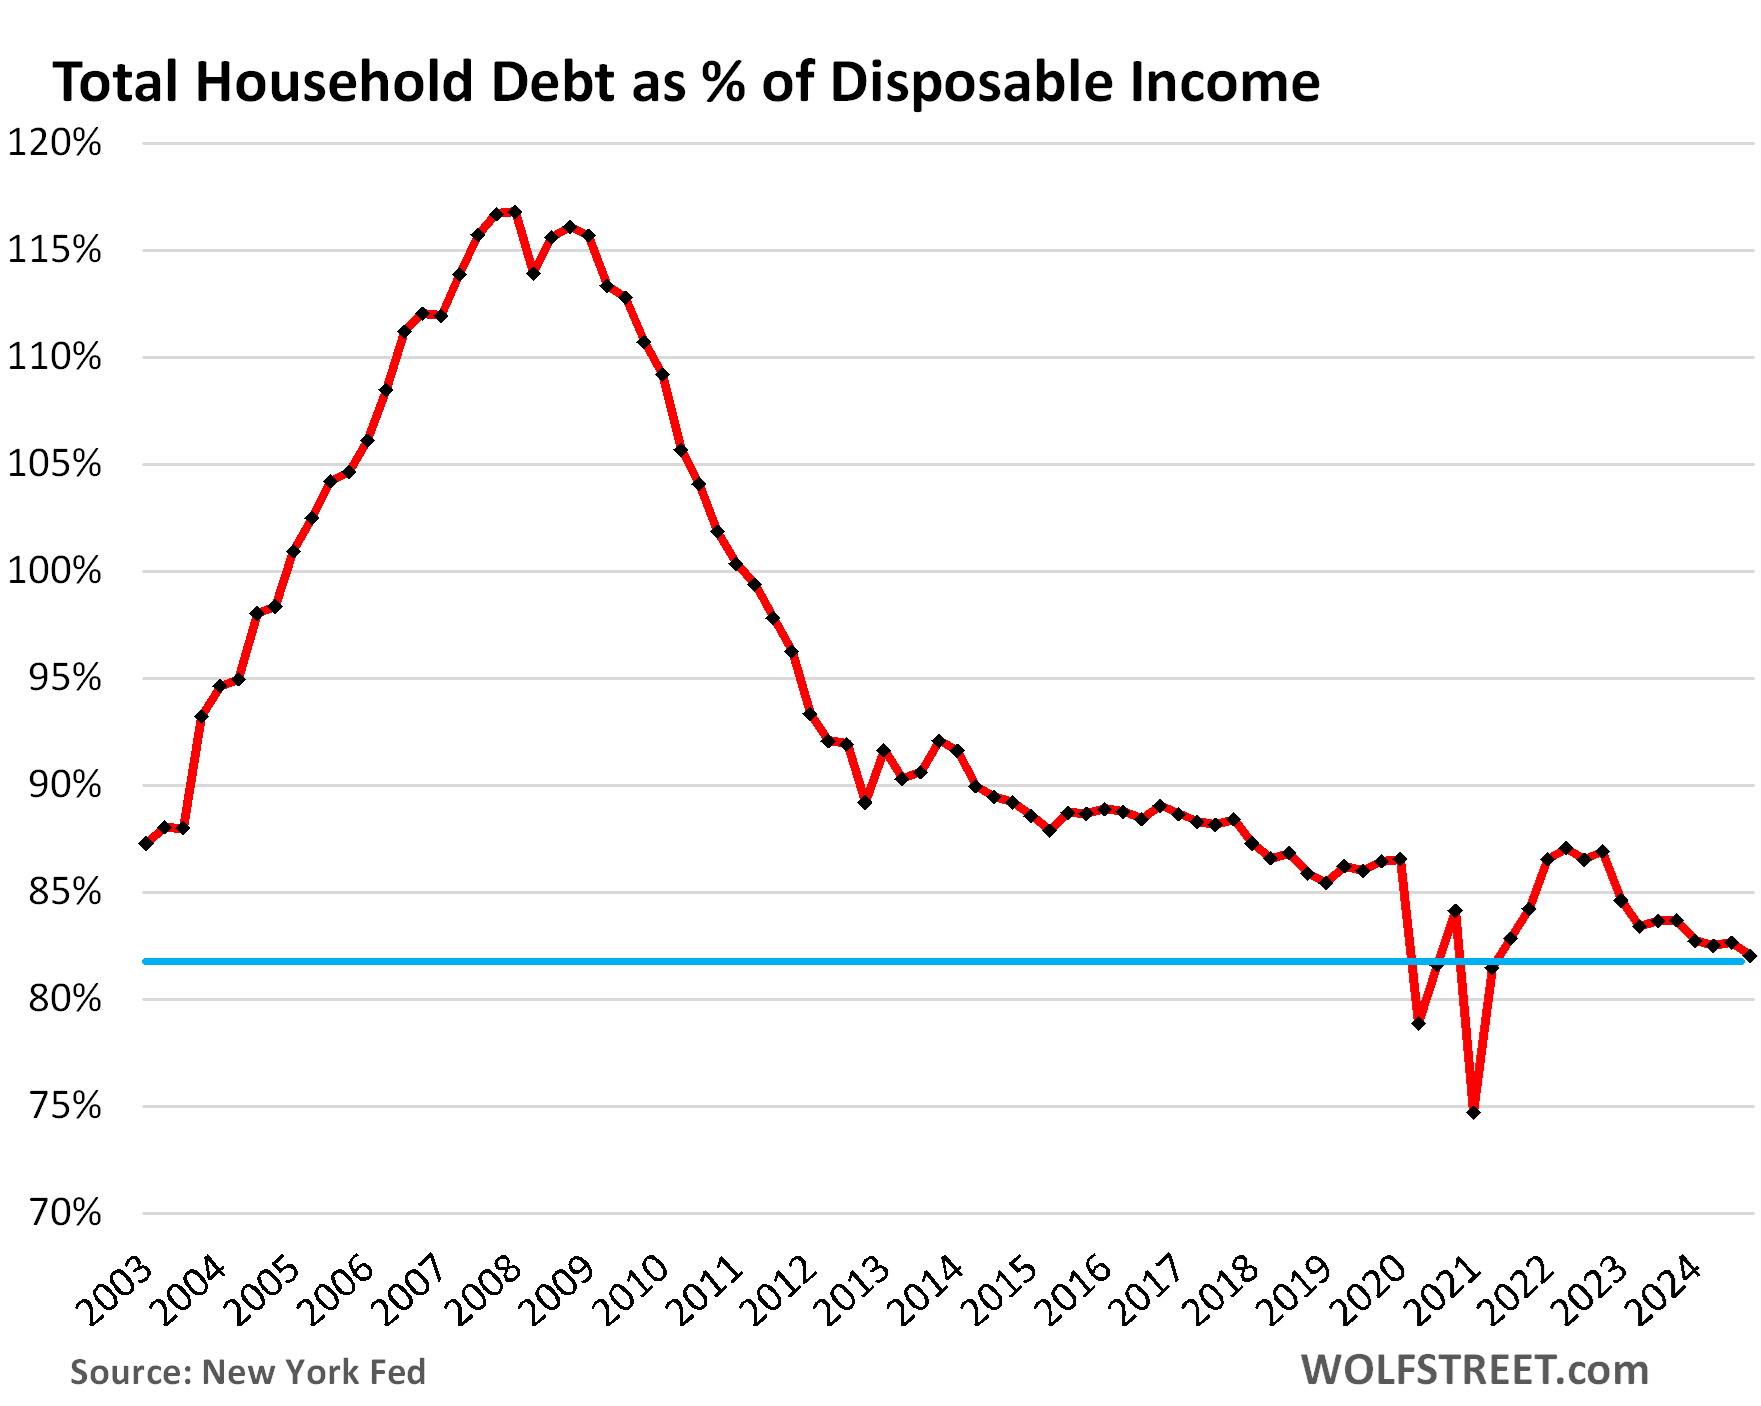
This wasn’t always so. In the early 2000s, households piled on huge debts in relationship to their incomes, and their debt-to-disposable-income ratio spiked in five years from 88% in 2003 to 117% in 2007. That this wasn’t going to work out should have been clear. And it didn’t work out, and it contributed to blowing up the financial system that had provided this debt.

But our Drunken Sailors, as we lovingly and facetiously have come to call them, have learned a lesson and have become a sober bunch, most of them, not all.

Free-Money is over.

Subprime means bad credit, not low income. A small subset of our Drunken Sailors has subprime credit scores because they’ve been behind with their payments, have defaulted on their debts and other obligations, etc. But low-income people cannot borrow at all or only very little. It’s the people with higher incomes that have access to lots of credit that get into it over their heads and fall behind. People with good incomes early on in their careers fall into this trap easily, and eventually get out of it again.

Subprime isn’t a permanent condition, but a phase that consumers move into and out of: Some people get into trouble, and fall behind on their payments, and their credit scores drop to subprime, while others are curing their credit problems and are working their way out of a subprime credit rating. It’s in constant flux.

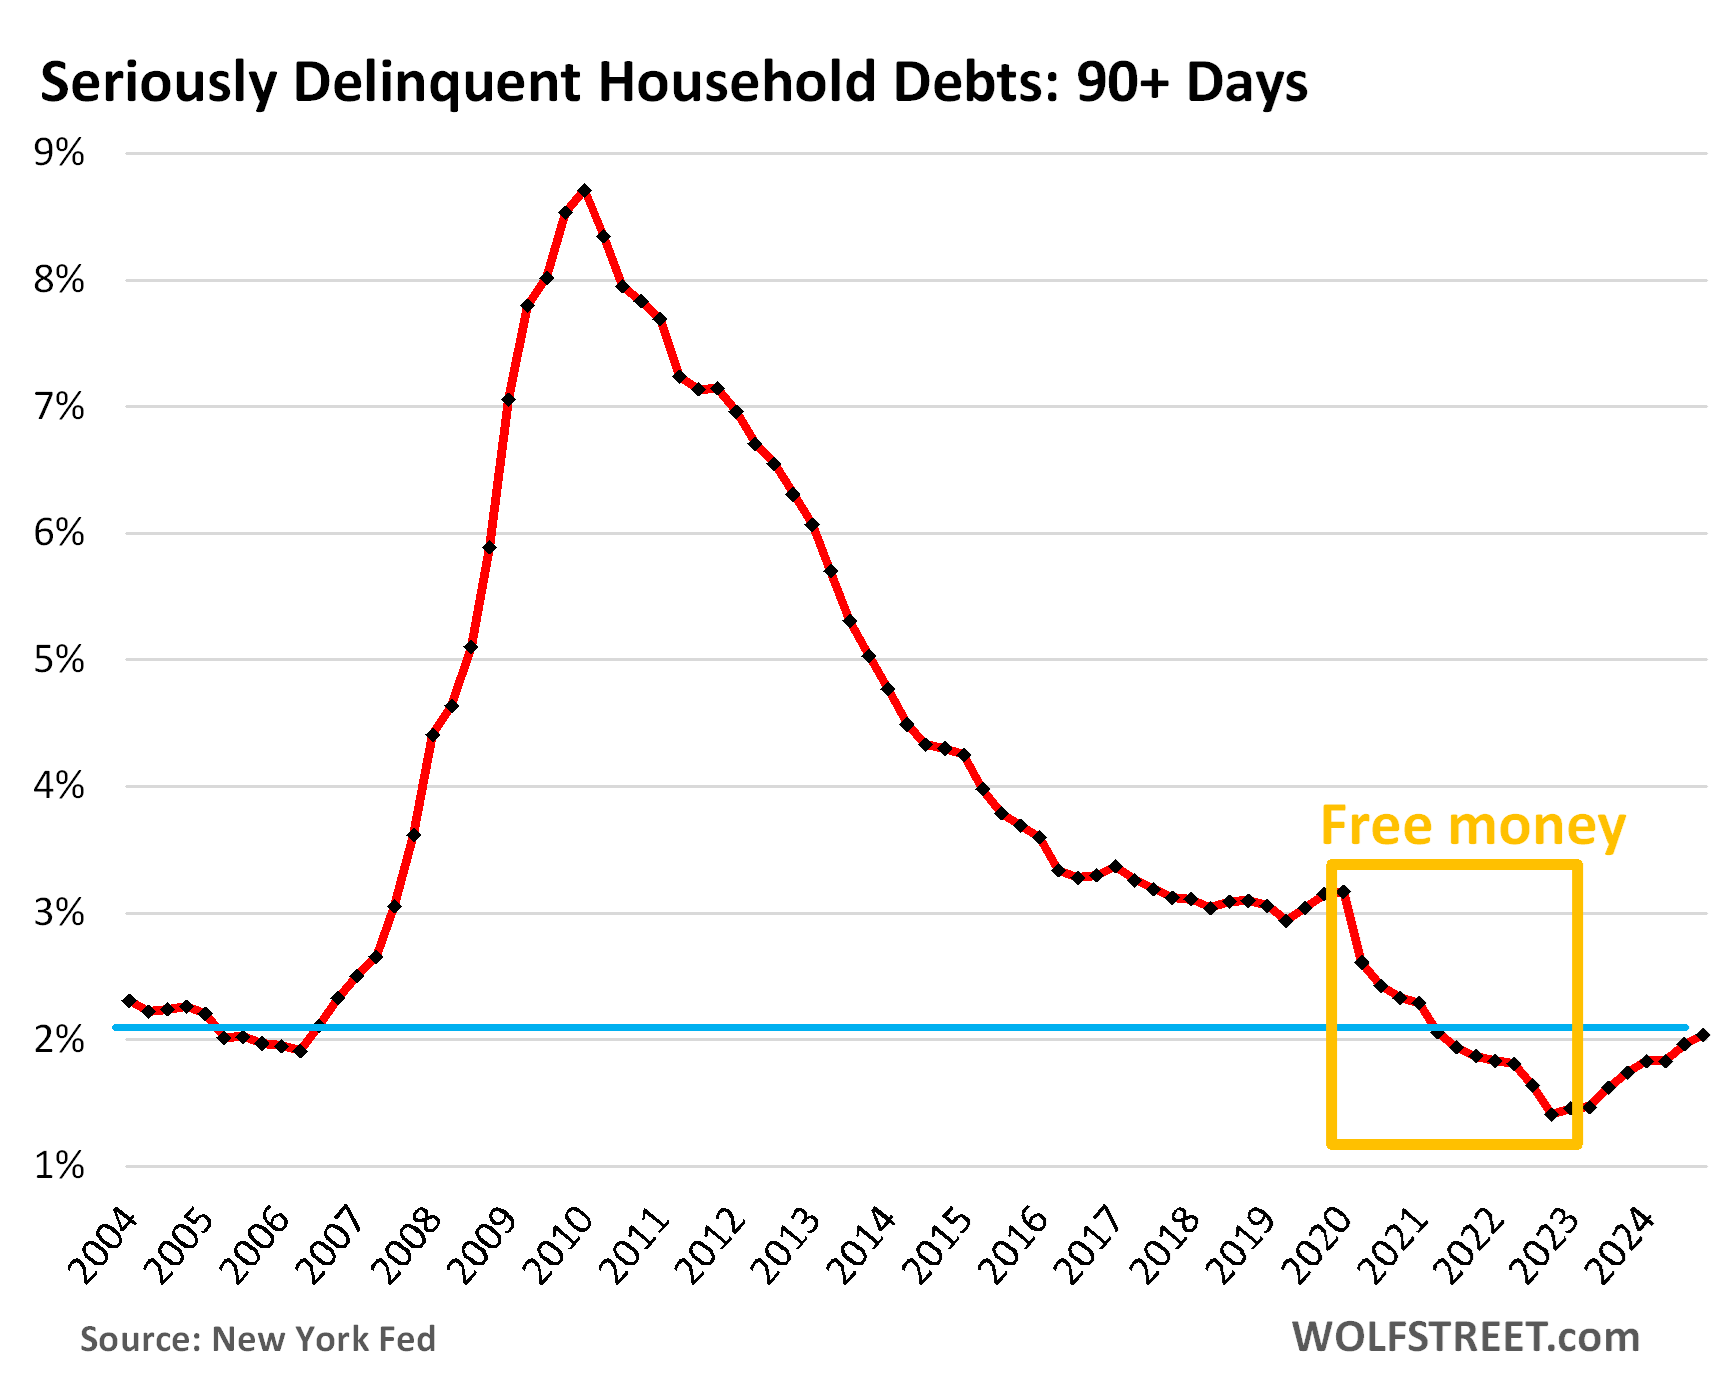
Serious delinquencies after Free-Money: Household debts that were 90 days or more delinquent by the end of Q4 inched up to 2.0%. Beyond the Free-Money era (gold box), we have to look back nearly 20 years to see a similarly low rate.

In the Good Times of 2018-2019, before Free-Money, the serious delinquency rate was about 3%.
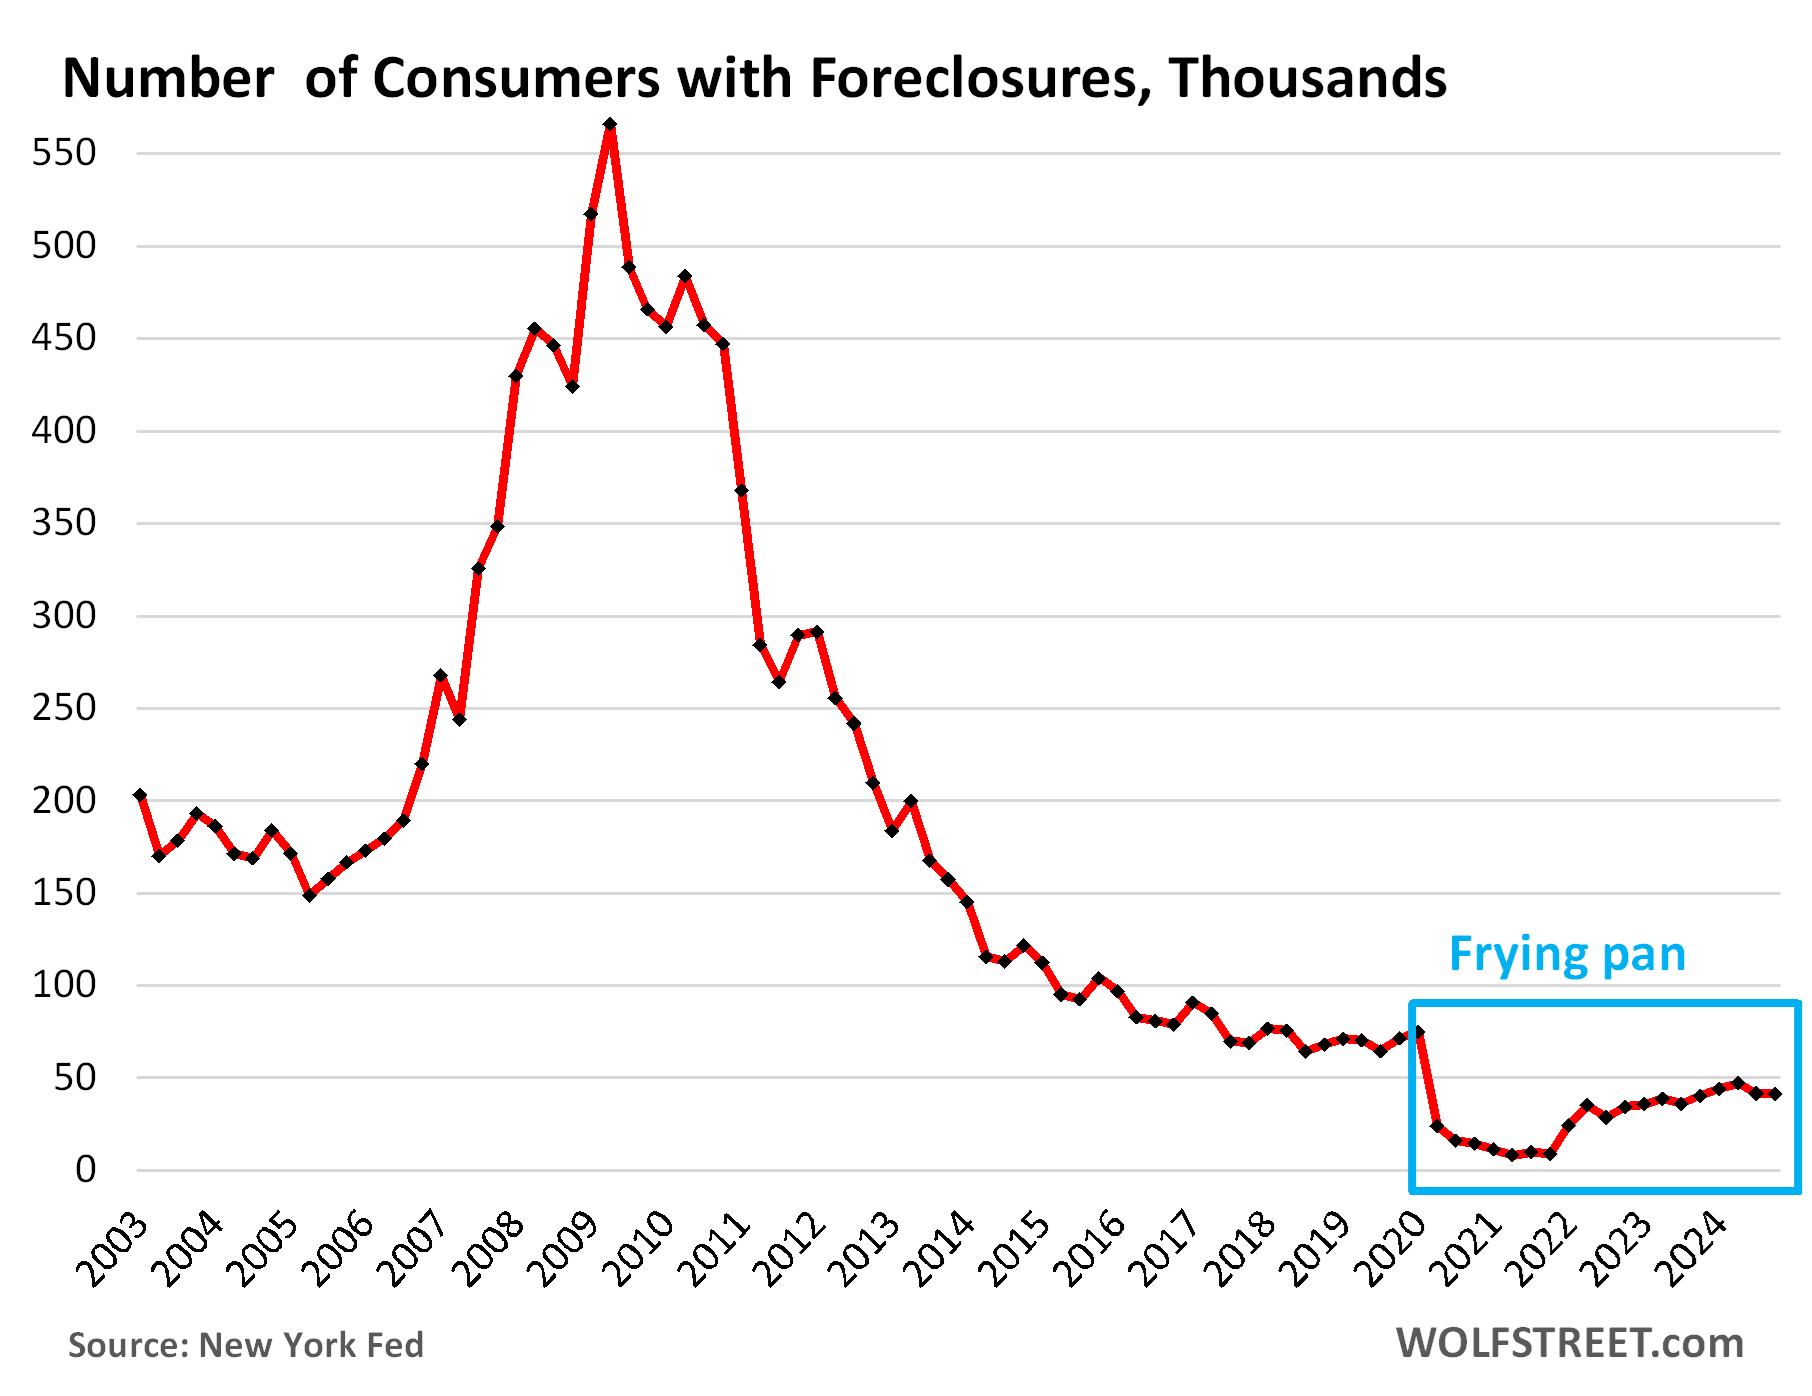
The foreclosures frying-pan pattern. The number of consumers with foreclosures in Q4 dipped to 41,220, the second months in a row of declines and at ultra-low levels, compared to 65,000 to 90,000 in the Good Times of 2018-2019.

During the Free-Money era, which included government-sponsored mortgage-forbearance programs under which foreclosures were essentially impossible, the number of foreclosures fell to near zero.

What is keeping foreclosures so low currently is that, after years of ballooning home prices, most strung-out homeowners can sell their home for more than they owe on it, pay off the mortgage, and walk away with some cash, and their credit intact.

It’s only when home prices spiral down for years that foreclosures can become a problem, if it coincides with big job losses.
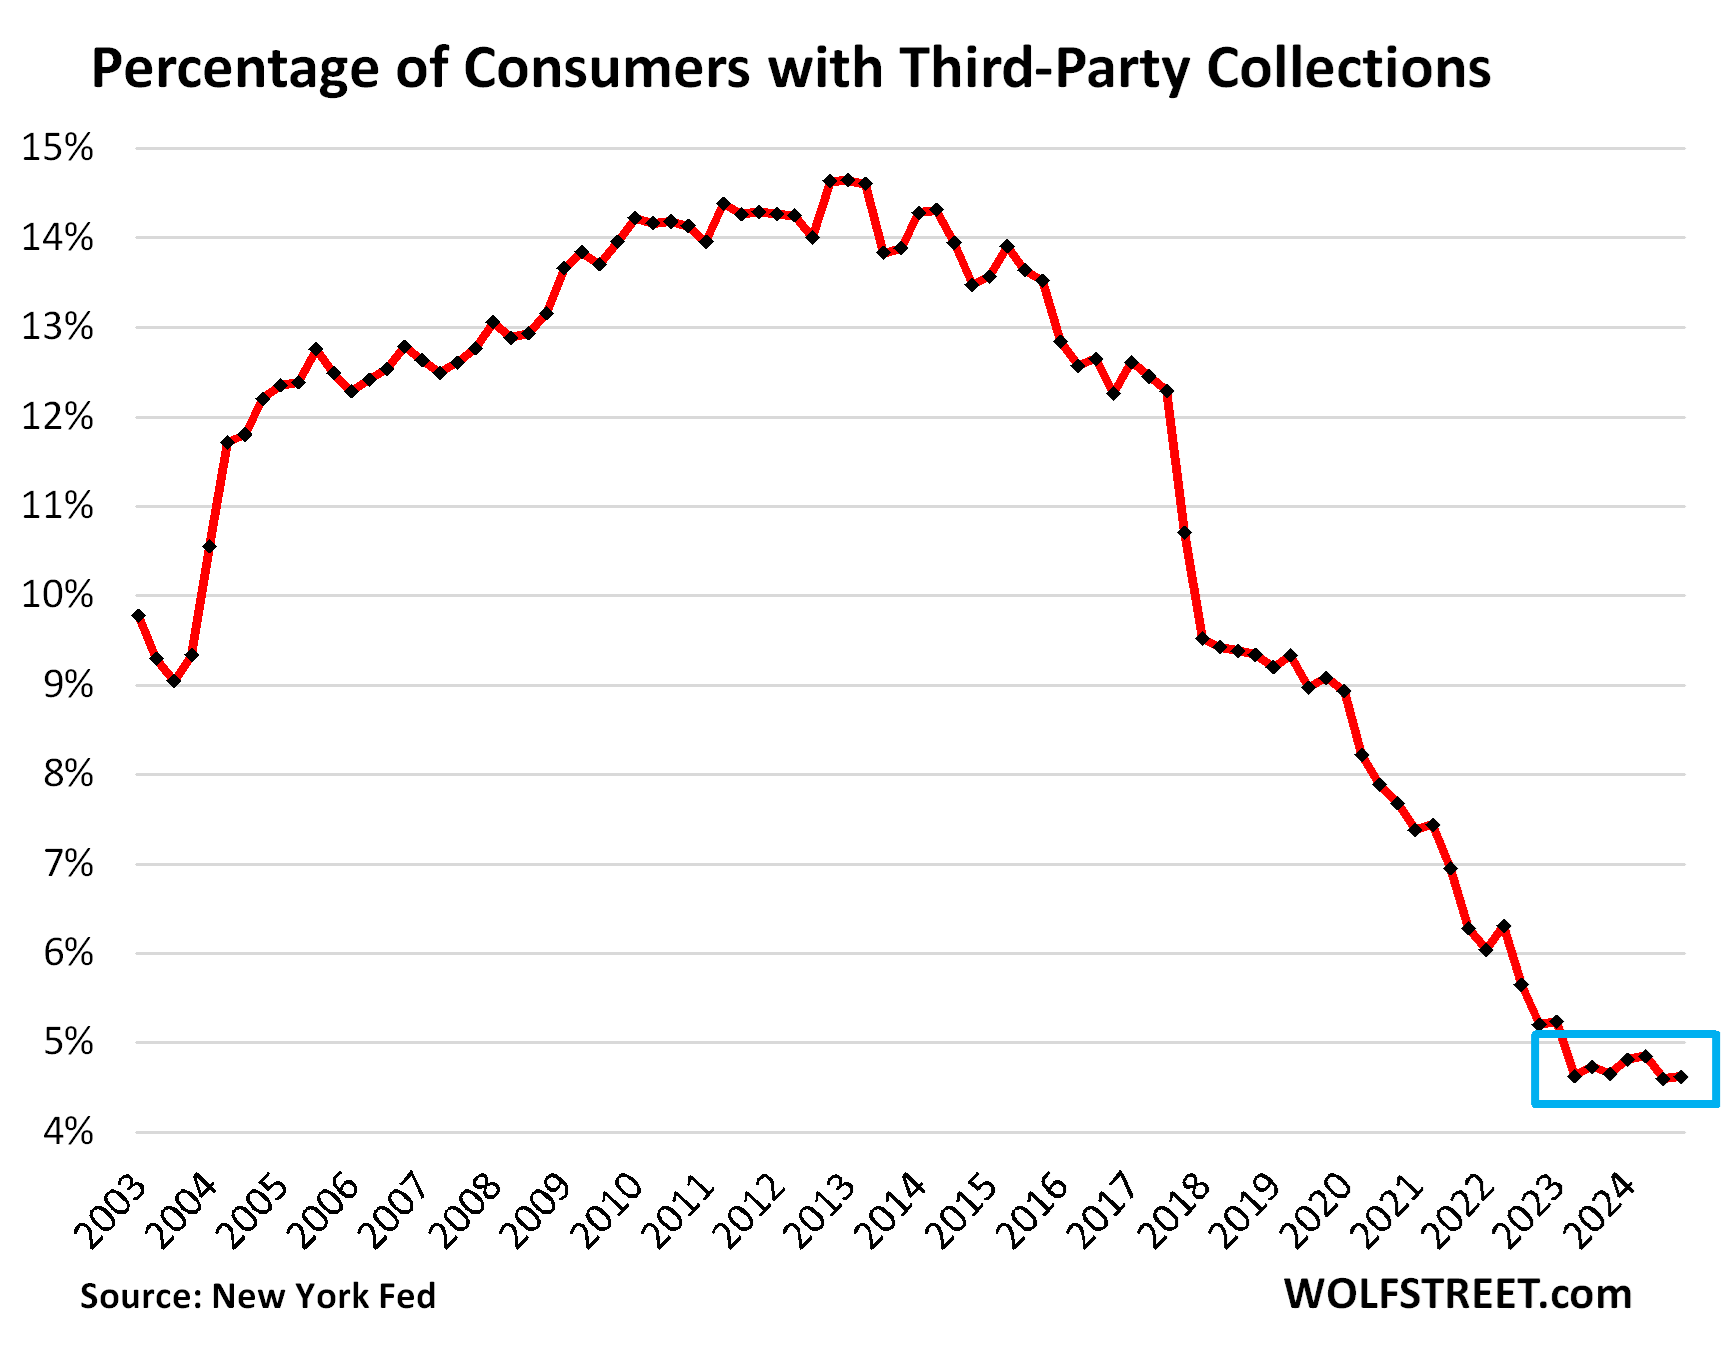
Third-party collections still at rock bottom. A third-party collection entry is made into a consumer’s credit history when the lender reports to the credit bureaus, such as Equifax, that it sold the delinquent loan (for cents on the dollar) to a collection agency.  The New York Fed obtained this data on third-party collections in anonymized form through its partnership with Equifax.

The percentage of consumers with third-party collections has been at the record low level of around 4.6% for nearly two years:
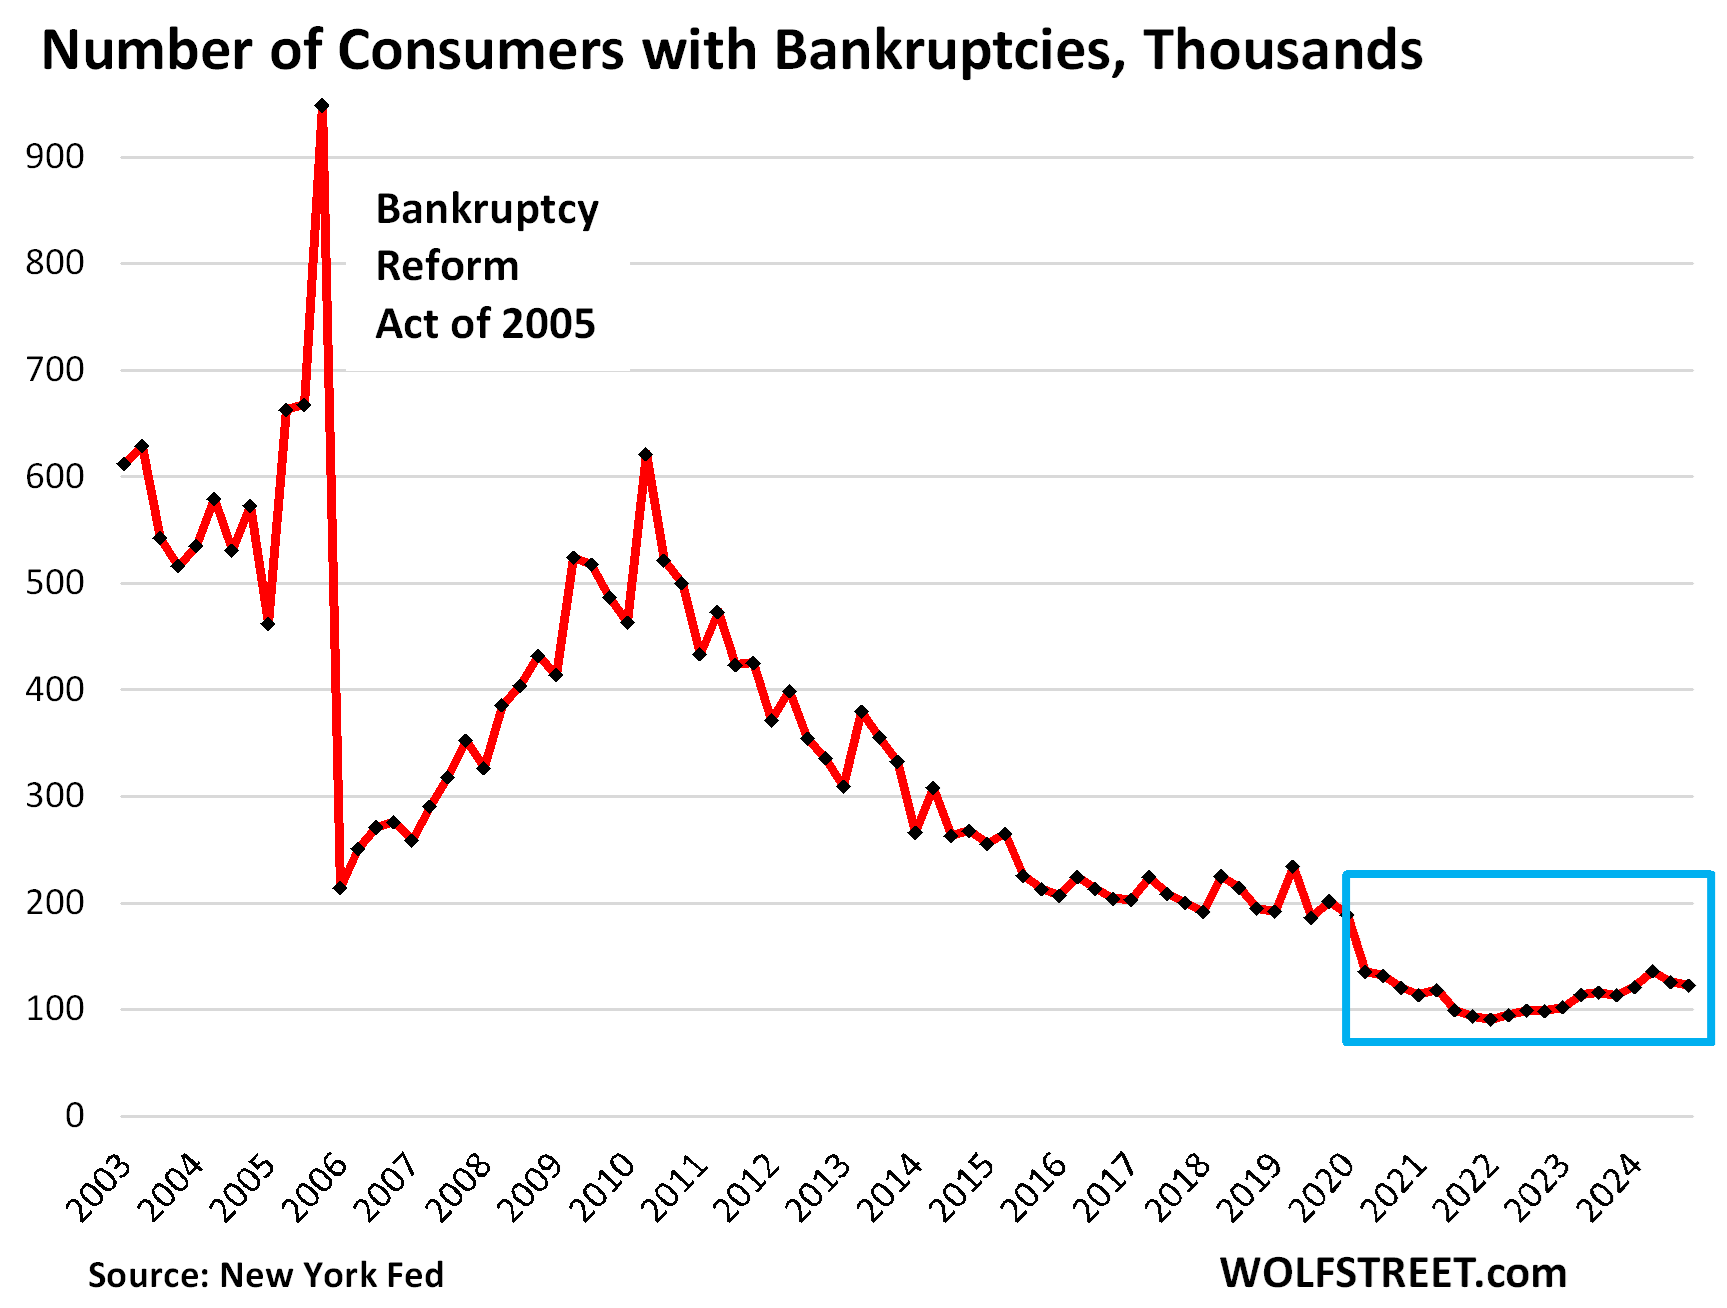
The consumer bankruptcies frying-pan pattern. The number of consumers with bankruptcy filings dipped to 122,660 in Q4, the second quarter in a row of declines, and lower than any time before Free-Money. During the Good Times before the pandemic, the number of consumers with bankruptcy filings ranged from 186,000 to 234,000, which had also been historically low.

An odd-looking frying-pan pattern with a short handle.
We’re going to get into the weeds of housing debt, credit card debt, and auto debt in separate articles over the next few days. Next one up is housing debt. So stay tuned.

Enjoy reading WOLF STREET and want to support it? You can donate. I appreciate it immensely. Click on the beer and iced-tea mug to find out how:

Would you like to be notified via email when WOLF STREET publishes a new article? Sign up here.

The post Household Debts, Debt-to-Income Ratio, Serious Delinquencies, Collections, Foreclosures, Bankruptcies: Our Drunken Sailors’ Debts in Q4 2024 appeared first on Energy News Beat.


Trump’s plan for Ukraine would cost EU $3 trillion – Bloomberg

Energy News Beat

Assisting Kiev’s war effort without US support will be a blow to the bloc’s budget, Bloomberg economists have warned

The EU is facing extra costs of $3.1 trillion over the next decade if it wants to support Ukraine while member states build up their own militaries in the absence of US assistance, Bloomberg economists have warned.

The report follows recent warnings from Washington regarding funding cuts for Kiev. President Donald Trump has also warned that the US could cut NATO spending unless European members agree to boost their own contributions from 2% to 5% of GDP.

At a meeting with his NATO counterparts in Brussels on Wednesday, US Defense Secretary Pete Hegseth reiterated these warnings, saying European members must shoulder the burden of providing “the overwhelming share of future lethal and nonlethal aid to Ukraine” and “take ownership of conventional security on the continent.” He noted that the US will no longer be “primarily focused on the security of Europe” and will instead work on securing its own borders.

Following Hegseth’s speech, Bloomberg economists attempted to calculate how much European countries would have to spend on supporting Ukraine through potential peace talks with Russia and reconstruction, as well as revamping their own militaries.

They estimated that rebuilding Ukraine’s military could cost around $175 billion over the next decade, depending on its state and territorial realities when a settlement with Russia is reached. Another $30 billion would be required for a 40,000-strong peacekeeping force over the same period, they said, in line with reports that a potential peace deal may include deploying peacekeepers to the area. Around $230 billion more will be needed for reconstructing buildings and infrastructure in Ukraine damaged during the conflict, they estimated.

However, according to Bloomberg, the bulk of the money would be needed to improve the military capabilities of EU member states, including building up artillery stockpiles, improving air-defenses, strengthening the bloc’s eastern borders, and ramping up the European defense industry.

Despite Trump’s calls, discussions among European NATO members indicate that they find the 5% of GDP defense spending goal unrealistic, and plan to boost the aggregate defense budget toward around 3.5% of GDP. This would cost the five largest European NATO members an additional $2.7 trillion over the next decade, economists estimated.

The news outlet noted that it would be a challenge for EU states to mobilize resources on this scale, and would likely force European governments to restructure their budgets and agree to joint debt issuance. The publication warns that the bloc’s health, education, and welfare sectors would likely suffer from the burden the most.


The post Trump’s plan for Ukraine would cost EU $3 trillion – Bloomberg appeared first on Energy News Beat.


PPI Inflation Accelerates to +3.5% yoy, Worst in 2 Years, Driven by Services amid Massive Up-Revision of Services Inflation

Energy News BeatPrice

By Wolf Richter for WOLF STREET.

As has been the case for many months, today’s Producer Price Index for January included big up-revisions of the prior month, driven by a whopper up-revision for services which account for two-thirds of the overall PPI. On top of these upwardly revised December figures, the PPI rose further in January.

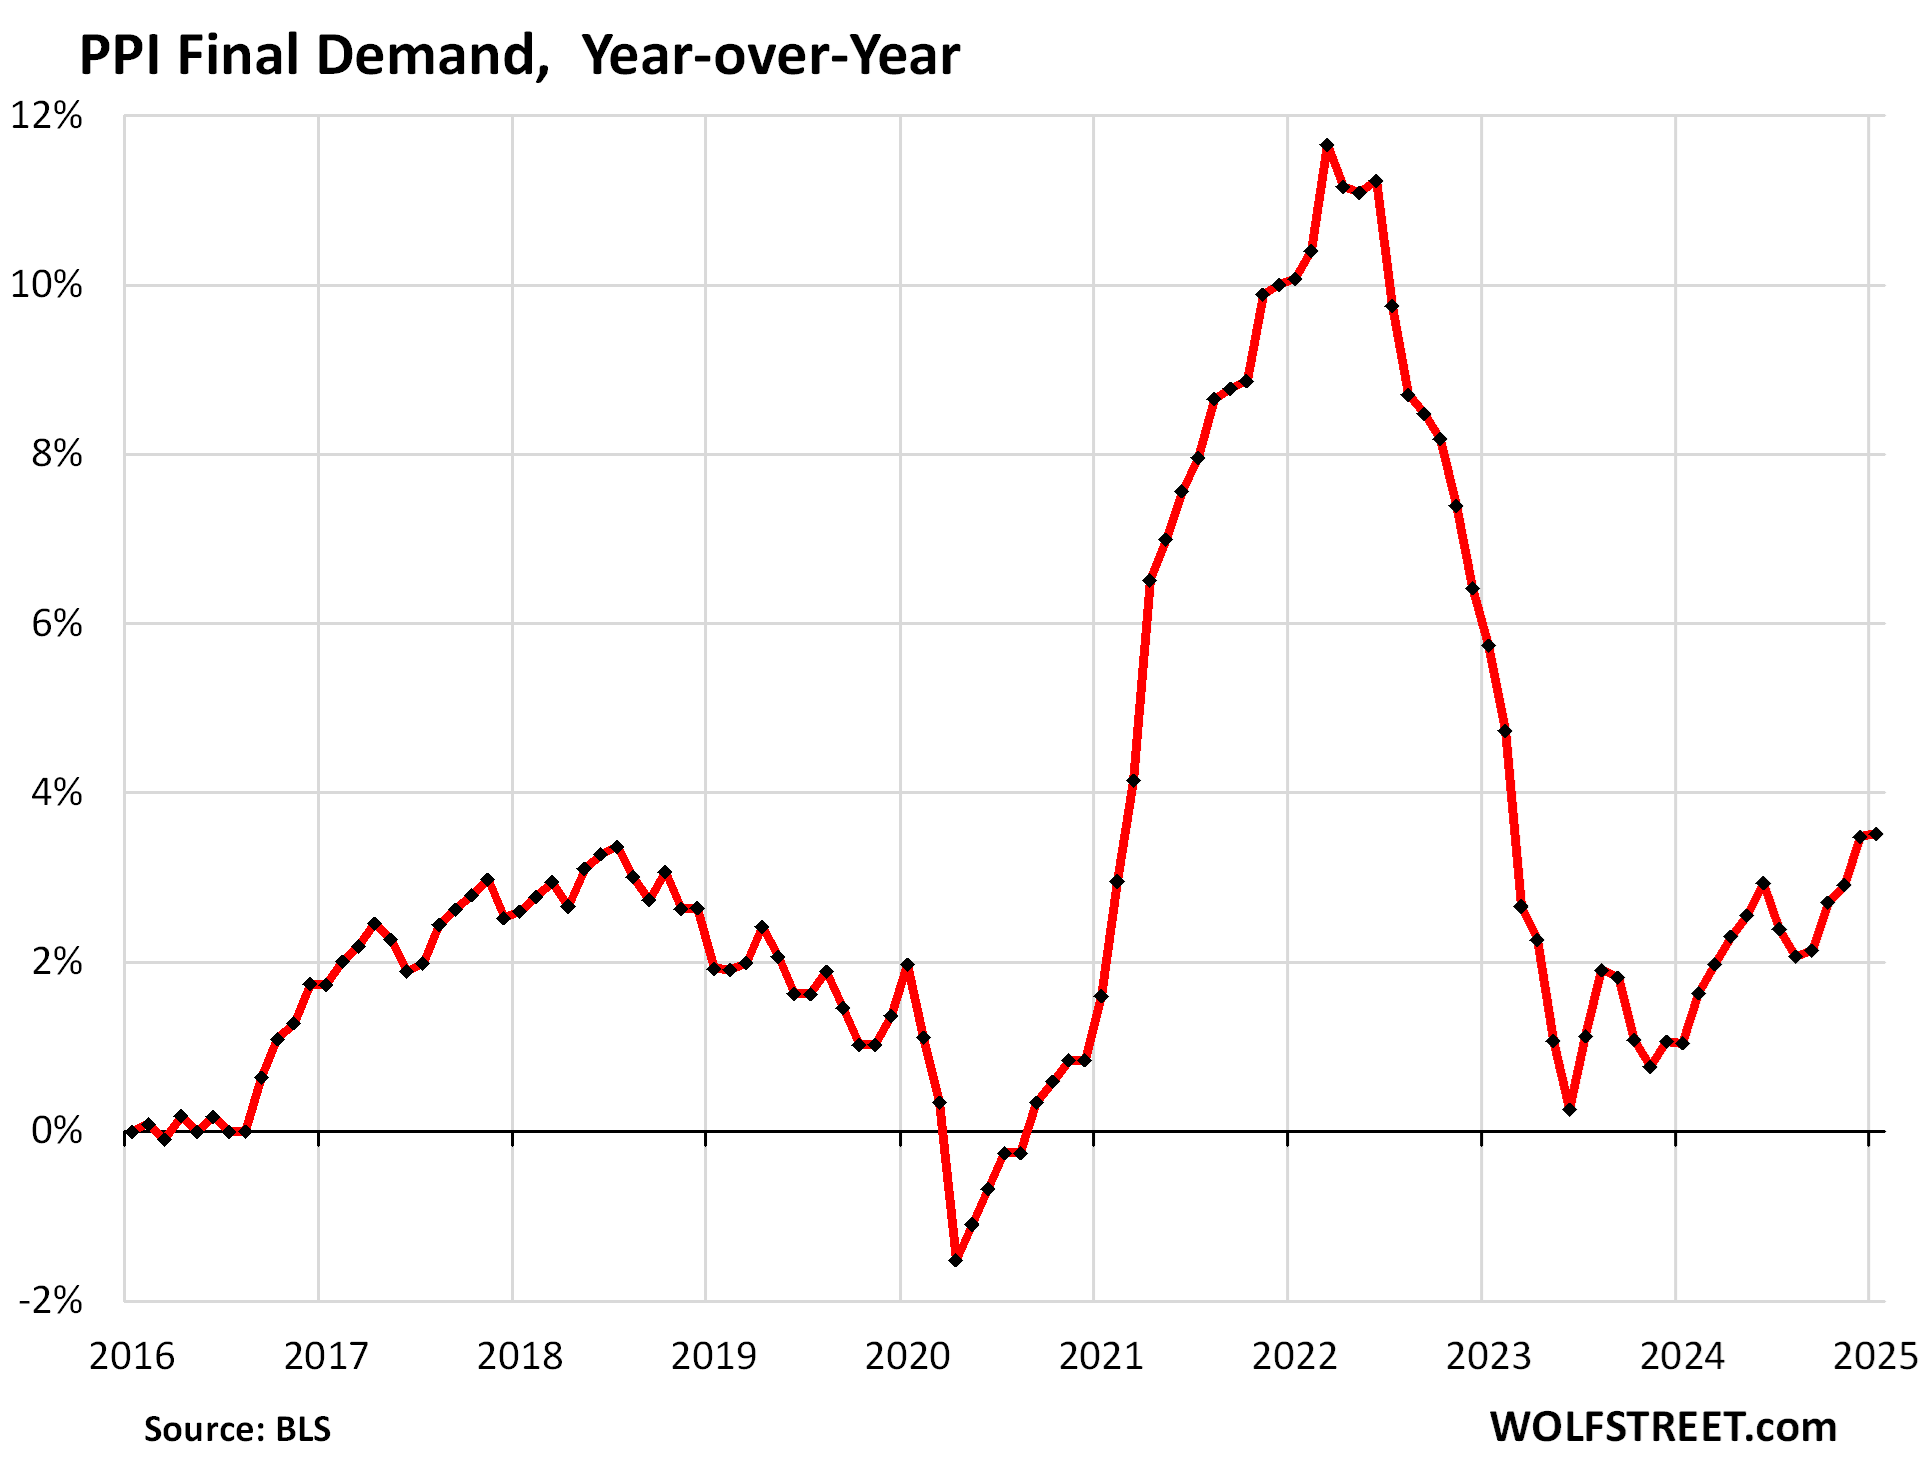
In January, the overall PPI accelerated to an increase of 3.51% year-over-year, the worst increase since February 2023, following a persistent zigzag line higher from the low point of near 0% in June 2023, driven largely by the services PPI.

And December was revised up to an increase of 3.48%, from 3.31% as reported a month ago. This up-revision was powered by a massive up-revision in services.

The PPI tracks inflation in goods and services that companies buy and whose higher costs they ultimately try to pass on to their customers.

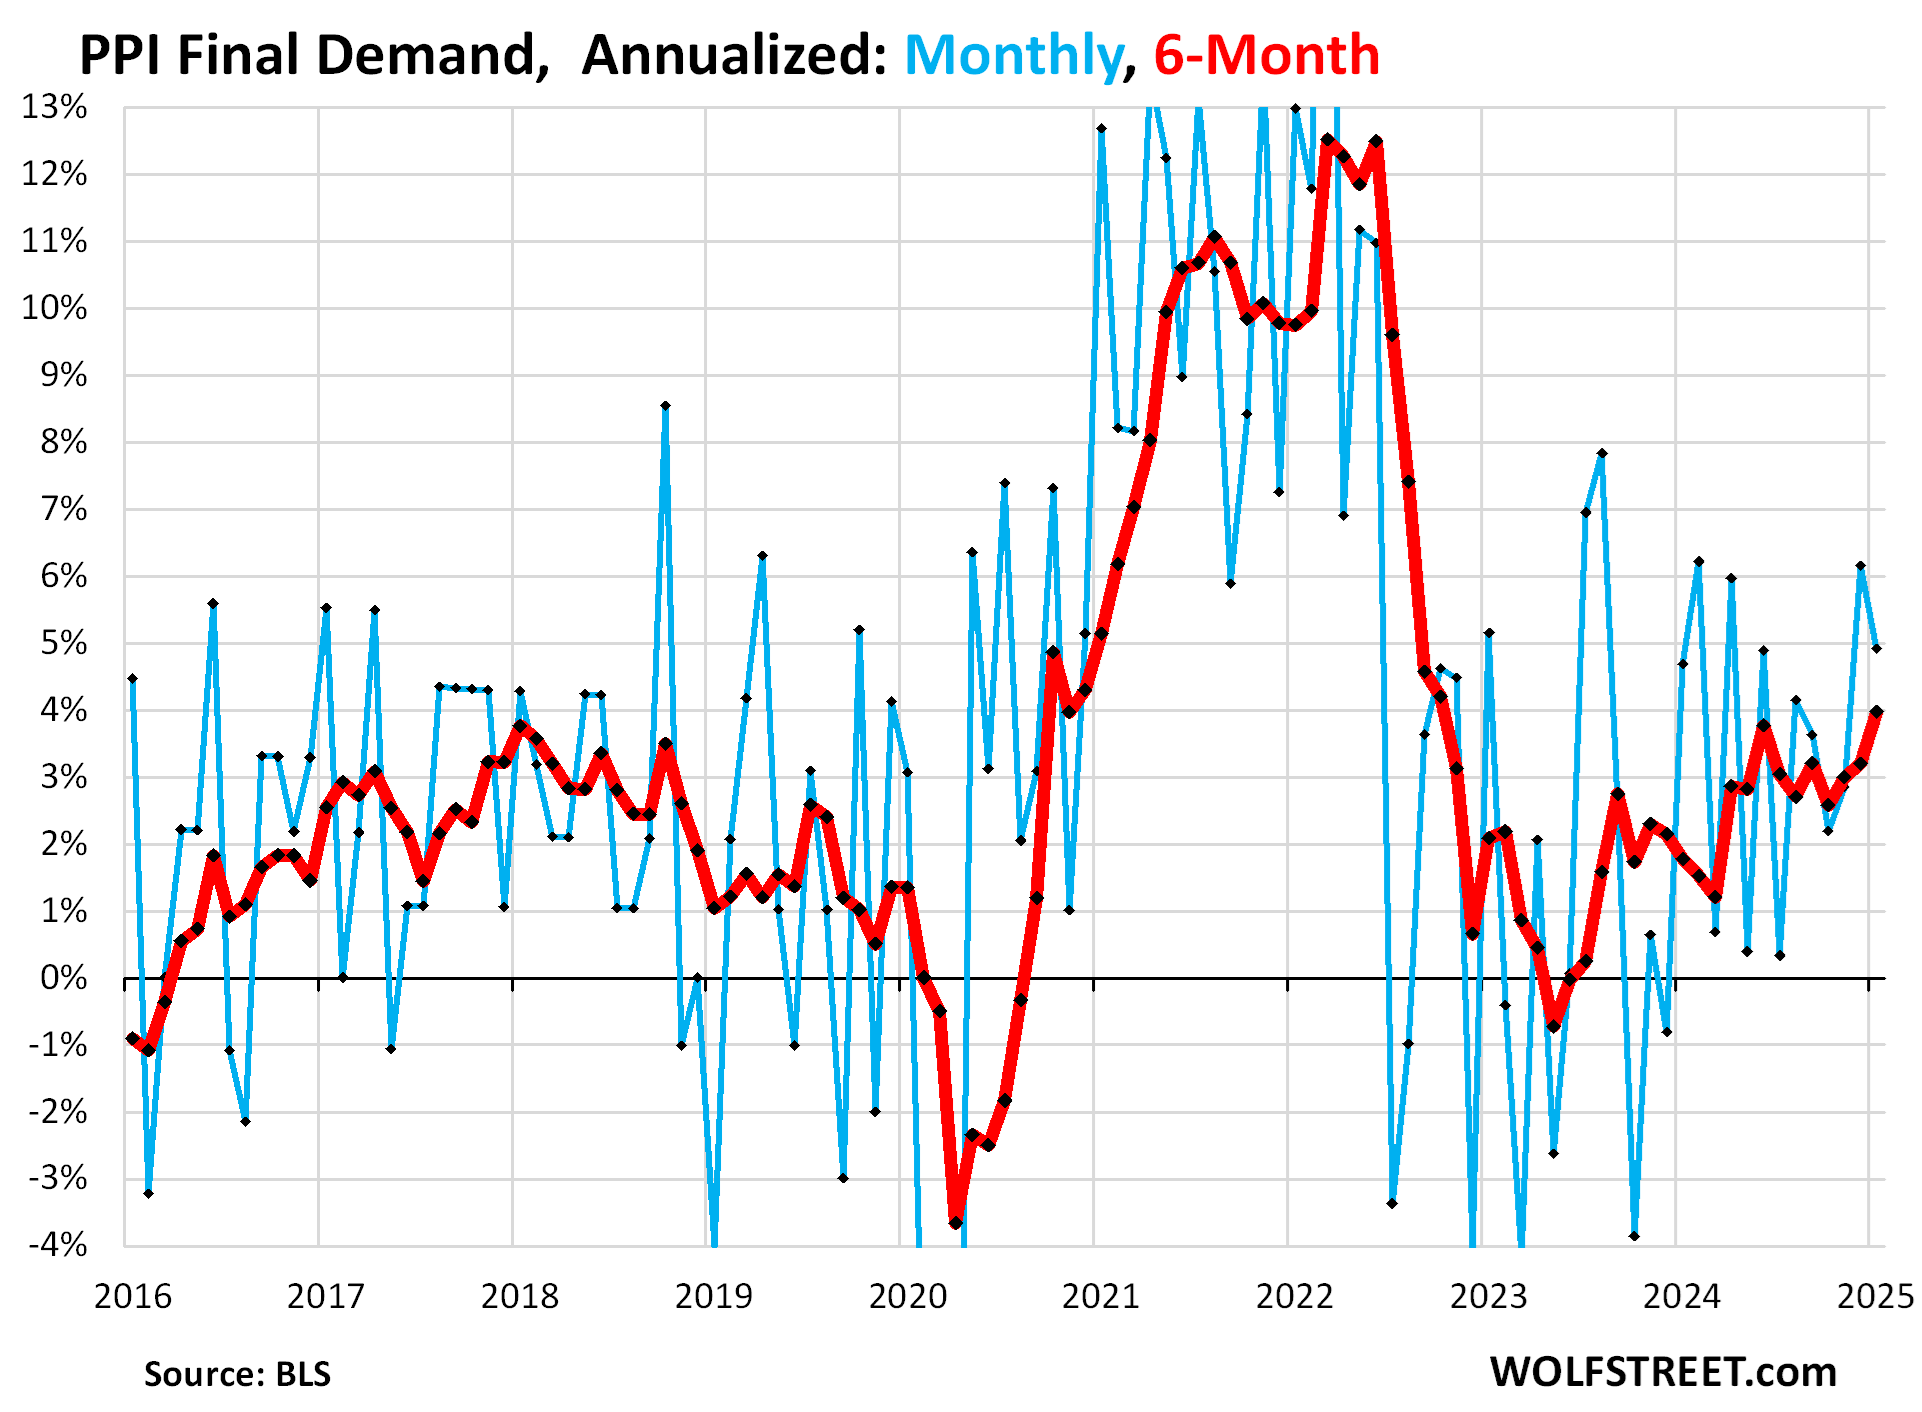
On a month-to-month basis, the PPI for final demand jumped by 0.40% (4.9% annualized) in January from December, seasonally adjusted.

And December’s increase was revised up to +0.50% (+6.2% annualized) from the previously reported +0.22% (+2.7% annualized). The up-revision more than doubled the increase! This was driven by the whopper up-revision of the Services PPI.

The up-revision for December plus January’s increase caused the 6-month PPI to surge to +4.0% annualized, the worst increase since October 2022 (red).

The plunge in energy prices from mid-2022 through September 2024 had cooled the overall PPI increases into the pre-pandemic range, and papered over the inflationary forces in services. But since October, energy prices stopped dropping and flipped to increases. In January, energy prices jumped by 1.7% from December, which wiped out the remainder of the year-over-year drop, and the index was unchanged year-over-year.

Food prices jumped by 1.1% in January from December and by 5.5% year-over-year. The avian flu’s impact on egg production had some impact here.

Without food, energy, and eggs: “Core” PPI, which excludes food and energy, was revised up massively for December.

The month-to-month increase for December had originally been reported as +0.04% (0.5% annualized). Today it was revised up by 36 basis points to an increase of +0.40% (4.9% annualized). All seasonally adjusted.

On top of the up-revised December rates came January’s increase of 0.28% (3.4% annualized), which accelerated the 6-month PPI to 3.8% annualized, the worst since September.

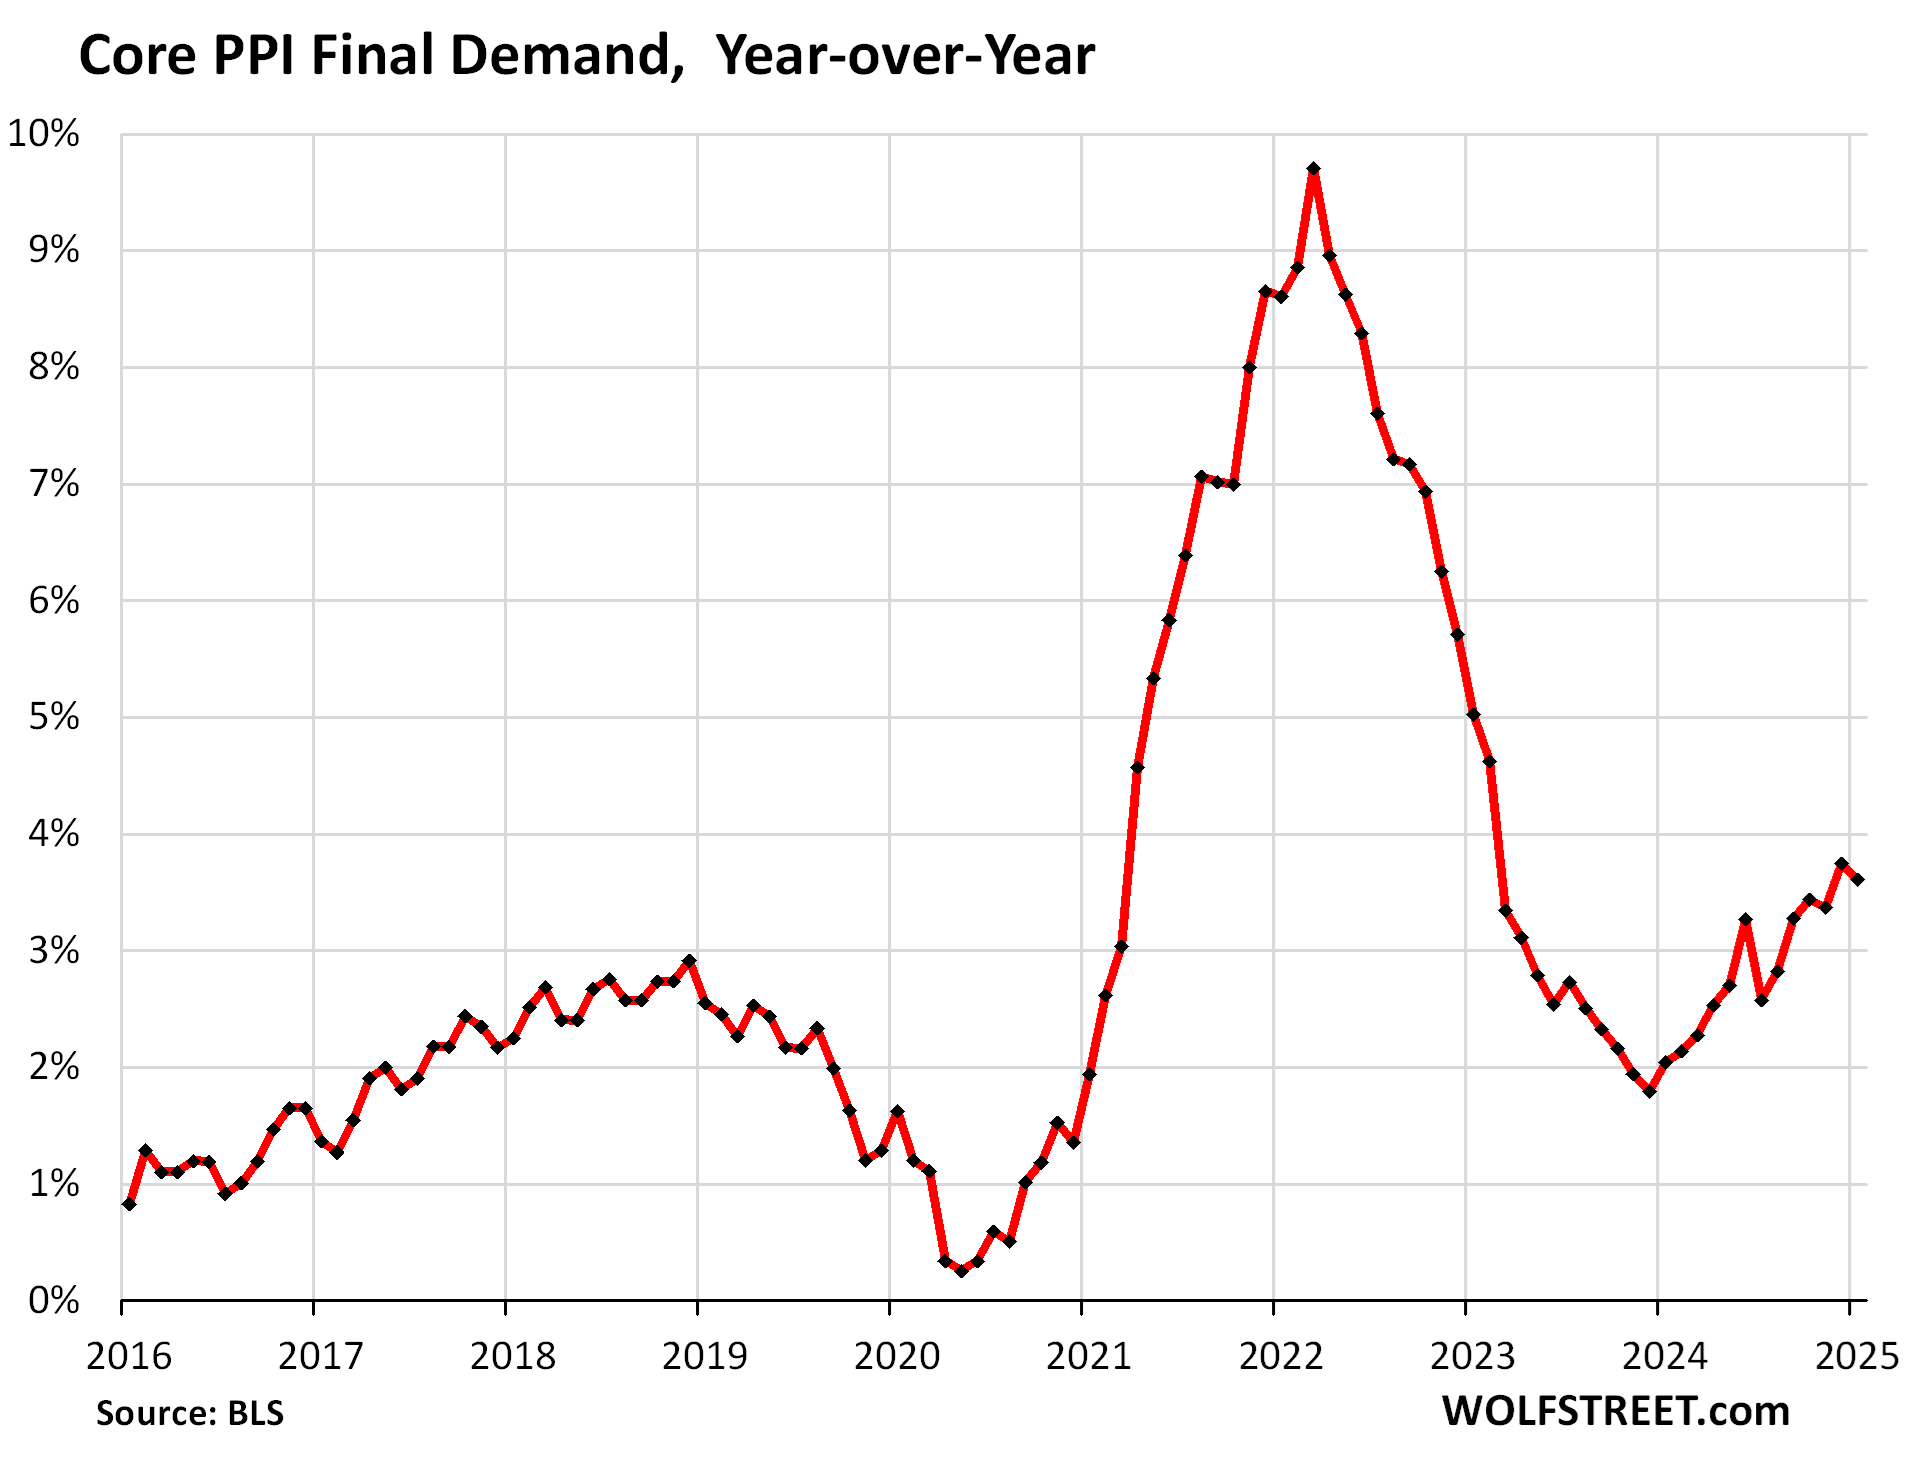
Year-over-year, core PPI for December was revised up by 20 basis points, from the previously reported +3.55% to today’s December figure of +3.75%.

Year-over-year data are not seasonally adjusted since they cover 12 months and wash out any seasonal effects. Not seasonally adjusted, the January core PPI jumped by 0.49% (not annualized). But the January 2023 increase of +0.63% fell out of the 12-month window. So year-over-year in January 2025, the index rose by 3.61%, a notch slower than the upwardly revised increase of 3.75% in December (originally reported at 3.55%).

The services PPI, which accounts for two-thirds of the overall PPI but excludes energy services, had the whopper 47-basis-point up-revision for December, from the originally reported month-to-month increase of 0.04% (not annualized), so from nearly no change, to +0.51% as revised today.

On top of this upwardly revised 0.51% surge in December (+6.2% annualized), the services PPI rose another 0.32% in January (3.9% annualized).

This pushed the six-month services PPI to +4.5% annualized, the worst since September.

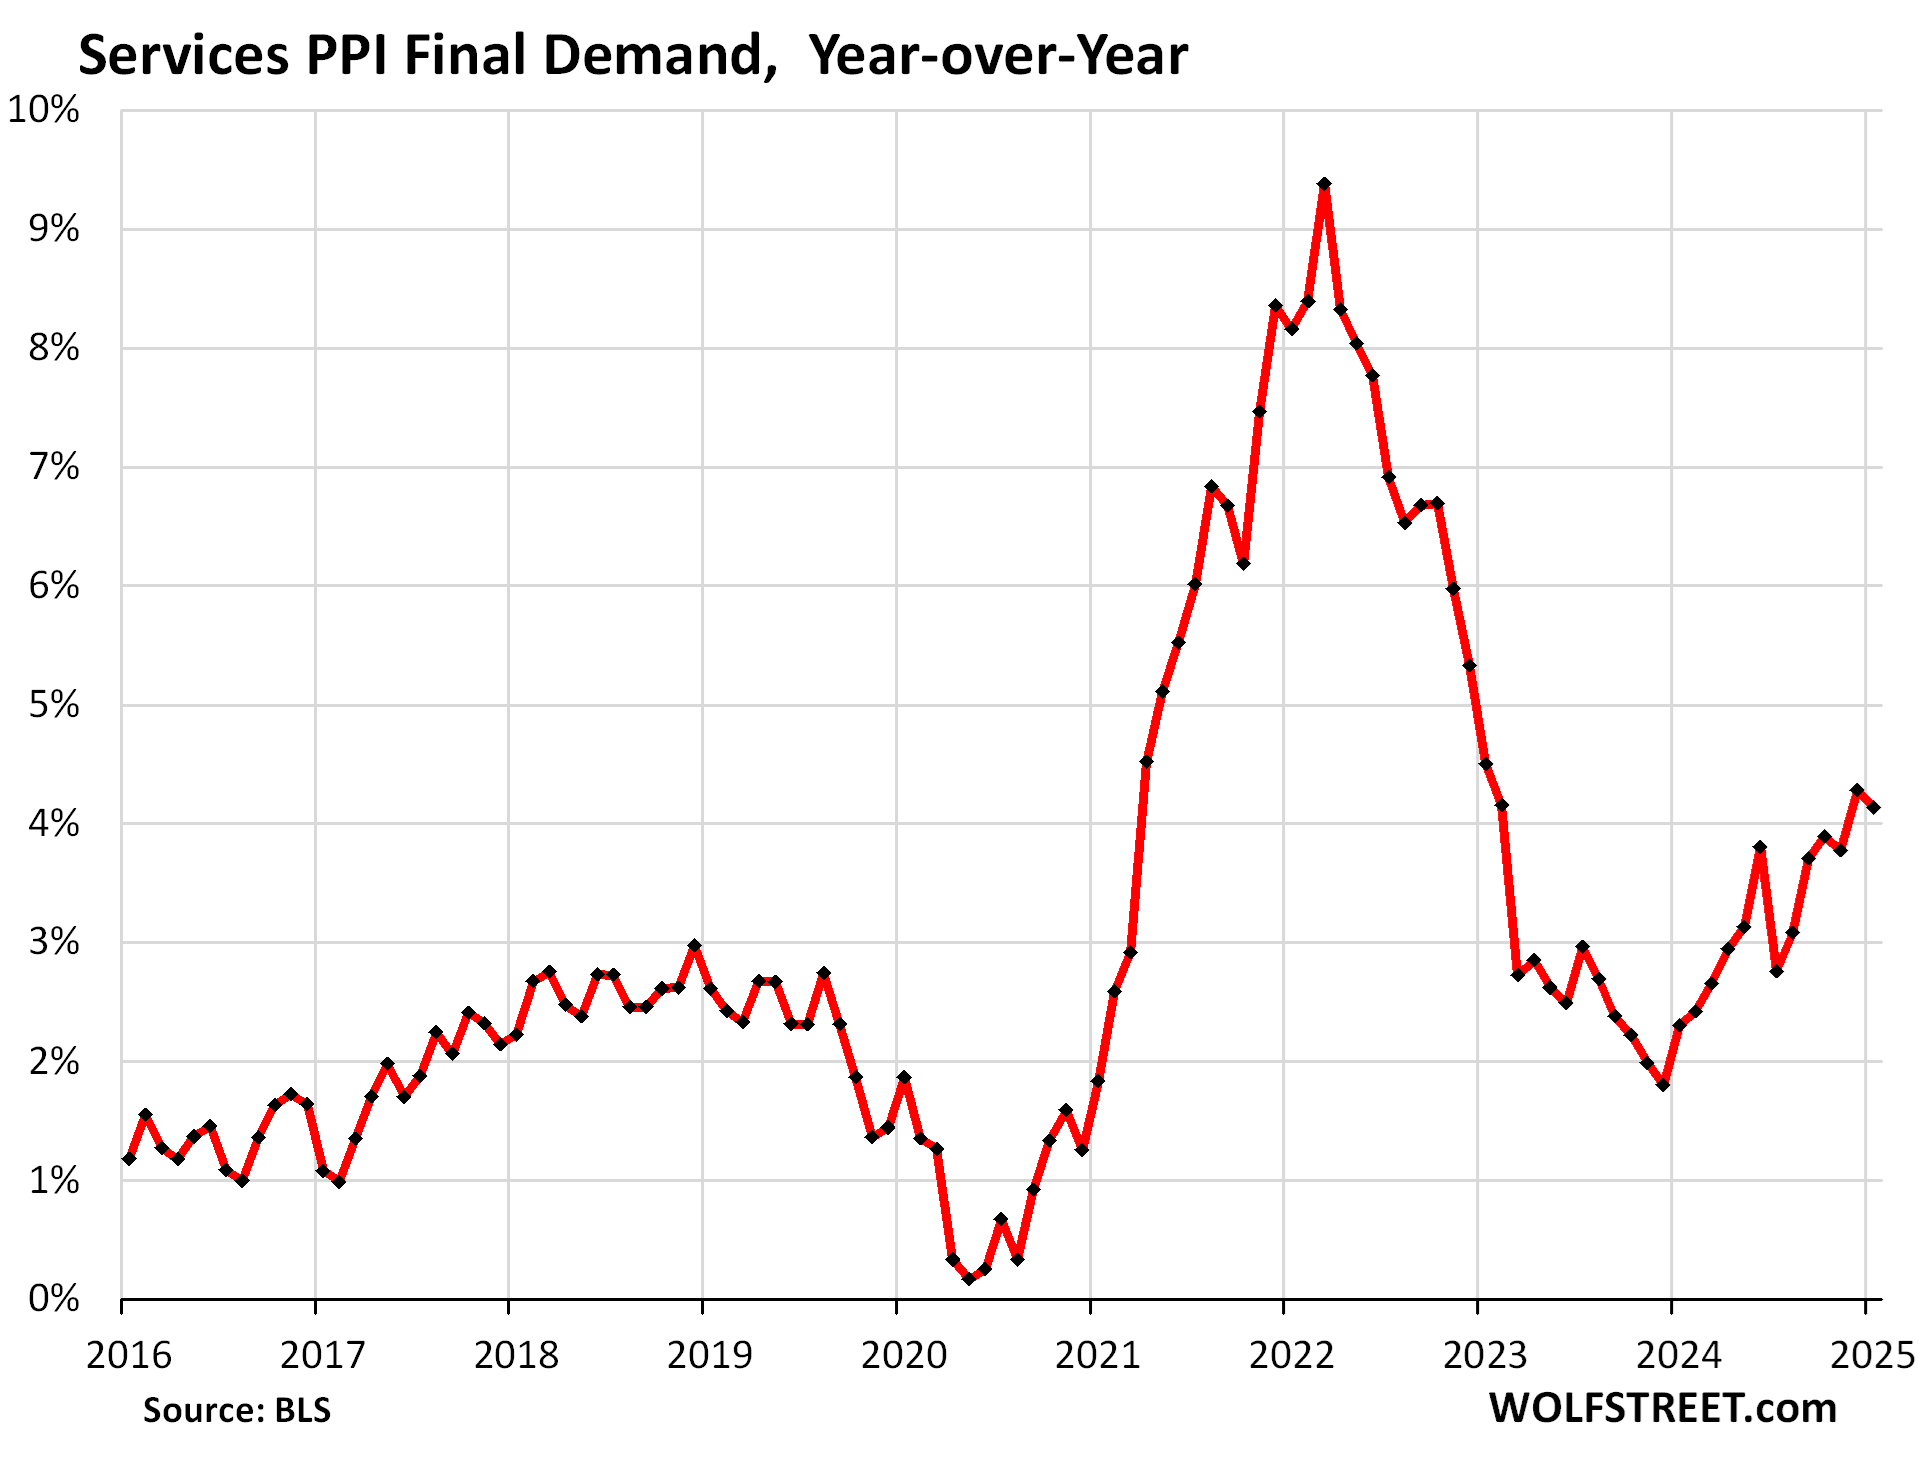
The year-over-year December increase was revised up by 25 basis points, to +4.28%, from the previously reported +4.03%.

With the January 2023 reading of +0.71% (not seasonally adjusted) dropping out of the 12-month window, and the January 2025 reading of +0.54% (not seasonally adjusted) moving into the 12-month window, the year-over-year increase in January cooled a hair to +4.14% from December’s up-revised 4.28% (originally reported as 4.03%).

These up-revisions have the effect that the entire zigzag line keeps shifting higher:

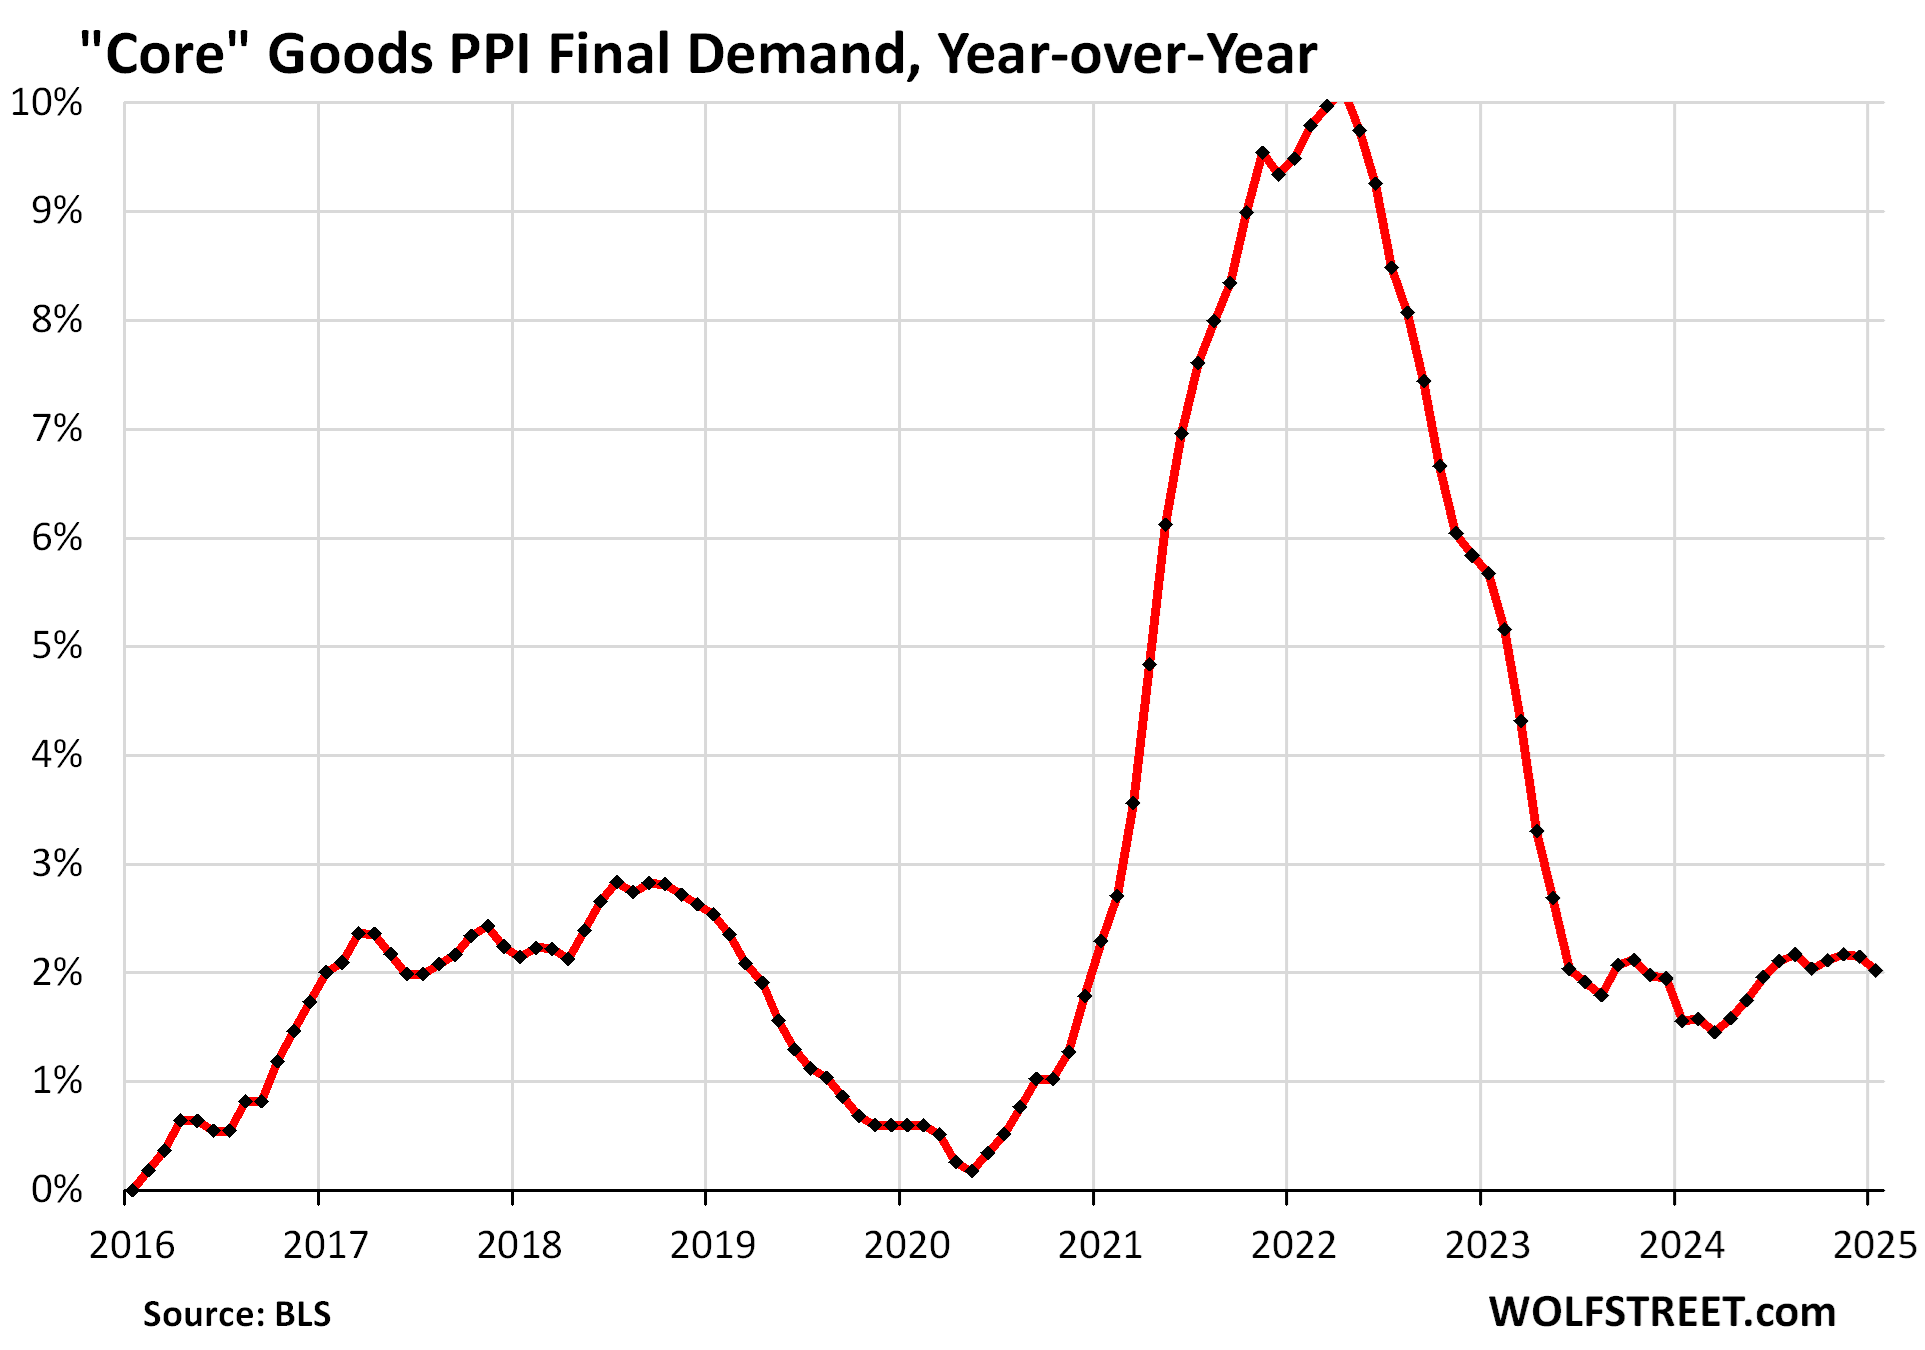
The “core goods” PPI was only minimally revised up. In January, it rose by 0.13% (+.5% annualized) from December.

Year-over-year, it rose by 2.0%, in the same 2%-plus range of increases for the seventh month in a row. The goods sector is not where inflation is a big issue at the moment. The issue with inflation is in services.

The PPI for “core goods” covers goods that companies buy but excludes food and energy products.

With these underlying trends, as shown by the PPI, it’s no surprise that consumer price inflation, as tracked by CPI, continues to accelerate, and that there too, inflation is festering in services, and in January it was non-housing services where inflation accelerated sharply.

Enjoy reading WOLF STREET and want to support it? You can donate. I appreciate it immensely. Click on the beer and iced-tea mug to find out how:

Would you like to be notified via email when WOLF STREET publishes a new article? Sign up here.

The post PPI Inflation Accelerates to +3.5% yoy, Worst in 2 Years, Driven by Services amid Massive Up-Revision of Services Inflation appeared first on Energy News Beat.


China’s Coal Power Construction Is at a Decade-High Despite Renewables Boom

Energy News BeatCoal Power Construction

Despite soaring solar and wind power installations, China launched construction of as many as 94.5 gigawatts (GW) of new coal power projects in 2024, the highest level since 2015, new research showed on Thursday.

China also approved 66.7 GW of new coal-fired power capacity in 2024, as approvals picked up in the second half after a slower start to the year, found the report by the Centre for Research on Energy and Clean Air (CREA) and Global Energy Monitor (GEM).

Apart from the new coal power construction starts, China last year resumed construction of 3.3 GW of suspended projects.

All these approvals and construction start to signal that “a substantial number of new plants will come online in the next 2-3 years, further solidifying coal’s role in the power system,” the report says.

China added 356 GW of wind and solar capacity in 2024 alone – 4.5 times the EU’s additions and nearly equivalent to the total installed wind and solar capacity in the U.S. by the end of the year, according to the research.

“This record-breaking expansion highlights China’s leadership in renewables, yet instead of replacing coal, clean energy is being layered on top of an entrenched reliance on fossil fuels,” CREA said.

Despite a pledge to phase down coal by the end of the decade, China continues to be committed to coal power, which overshadows clean energy progress and exposes fundamental challenges in China’s energy transition, the authors of the report wrote.

Globally, China is the leader in renewable energy capacity installations, but it is also a leader in coal-fired power and continues to be the key driver of record-high global coal demand.

The persistent growth in Chinese coal demand, including for power generation, goes to show that coal remains the baseload of China’s power system to back up the surge in renewables and will stay such for years to come as power demand jumps with the increasing electrification of homes and transport.

By Tsvetana Paraskova for Oilprice.com

We give you energy news and help invest in energy projects too, click here to learn more

Crude Oil, LNG, Jet Fuel price quote

ENB Top News 
ENB
Energy Dashboard
ENB Podcast
ENB Substack

The post China’s Coal Power Construction Is at a Decade-High Despite Renewables Boom appeared first on Energy News Beat.