Daily Energy Standup Episode #300 – Wind Farm Challenges, Global Warming Solutions, and Oil & Gas Finance Market Analysis

Energy News Beat

Daily Standup Top Stories

Wind Farms Are Overstating Their Output — And Consumers Are Paying For It

Dozens of British wind farms run by some of Europe’s largest energy companies have routinely overestimated how much power they’ll produce, adding millions of pounds a year to consumers’ electricity bills, according to market records […]

Climate Scientists Want An Umbrella The Size Of Argentina To Block Out The Sun

A team of climate scientists want to launch enormous umbrellas into space to reduce the Earth’s exposure to the sun and fight climate change, The New York Times reported Friday. The underlying idea is that […]

Can Germany meet its ambitious wind energy targets?

German Chancellor Olaf Scholz seems optimistic that his governing coalition — comprising his center-left Social Democrats, the Greens and neoliberal Free Democrats — will push ahead with the country’s energy transition. He remains optimistic despite Germany’s budget problems, despite growing […]

Orsted’s strategic shake-up has investors worried

Wind firm Orsted will present its new strategy on Wednesday Company faces dilemma of cutting targets or raising capital Cutting dividend, asset sales could restore confidence -analysts COPENHAGEN, Feb 2 (Reuters) – Orsted (ORSTED.CO), opens new […]

GOLDSTEIN: Trudeau government doesn’t know how much its carbon tax reduces emissions

Given that Prime Minister Justin Trudeau’s carbon tax is costing the average Canadian household hundreds of dollars annually when factoring in its negative impact on the economy, how much is it lowering Canada’s greenhouse gas […]

Chevron Reports Fourth Quarter 2023 Results

Reported earnings of $2.3 billion; adjusted earnings of $6.5 billion   Record $26.3 billion cash returned to shareholders in 2023   Record annual worldwide and U.S. production   Announced an 8 percent increase in quarterly […]

Chevron Reports Fourth Quarter 2023 Results

Reported earnings of $2.3 billion; adjusted earnings of $6.5 billion   Record $26.3 billion cash returned to shareholders in 2023   Record annual worldwide and U.S. production   Announced an 8 percent increase in quarterly […]

ENB #182 “Something Big is About to Happen” – Tucker Carlson. But what is he missing? The connection to the distruction of the grid.

Tucker Carlson just released “Something Big Is About to Happen” and discussed the border as a migration and invasion. Dr. Bret Weinstine is Tucker’s quest, and he covers his visit to the Darien Gap and […]

Highlights of the Podcast

00:00 – Intro
01:33 – Wind Farms Are Overstating Their Output — And Consumers Are Paying For It
04:45 – Climate Scientists Want An Umbrella The Size Of Argentina To Block Out The Sun
07:59 – Can Germany meet its ambitious wind energy targets?
11:31 – Orsted’s strategic shake-up has investors worried
15:13 – GOLDSTEIN: Trudeau government doesn’t know how much its carbon tax reduces emissions
19:06 – Markets Update
24:06 – Chevron Reports Fourth Quarter 2023 Results
31:59 – ENB #182 “Something Big is About to Happen” – Tucker Carlson. But what is he missing? The connection to the distruction of the grid.
30:38 – ExxonMobil Announces 2023 Results
35:10 – Outro


Follow Stuart On LinkedIn and Twitter

Follow Michael On LinkedIn and Twitter

ENB Top News

ENB

Energy Dashboard

ENB Podcast

ENB Substack

– Get in Contact With The Show –

Video Transcription edited for grammar. We disavow any errors unless they make us look better or smarter.

Michael Tanner: [00:00:13] What’s going on, everybody? Welcome in to the Monday, February 5th, 2024 edition of the Daily Energy News Beat stand up. Here are today’s top headlines. Wind farms are overstating their output and consumers are paying for it. Next up, this one scary folks. Climate scientists want an umbrella the size of Argentina to block out the sun. Man, I hope this is a parody. Next up, can Germany meet its ambitious wind energy targets? Well, then move on to Orsted. Their strategic shake up has investors worried. We’ll then finish up with an opinion piece by Lauri Goldstein out of Toronto. Trudeau government doesn’t know how much its carbon tax reduces emissions. Stool. Then toss it over to me. I will quickly cover what happened in the oil against gas finance markets on Friday. We did see oil post really a first losing week. You know, considering a lot of the gains that we made over the past week, we did see rig counts coming at then we did see Chevron and Exxon earnings drops. We’ll do a little compare contrast. And then finally we’ll finish up with actually a little bit of a dive into in an interview you just did with with the one and only Michael Yon. You can check all that out on Twitter. As always though, I’m Michael Tanner, joined by the premier of the show, Stuart Turley. Let’s get it going. Where do you want to start? [00:01:30][76.9]

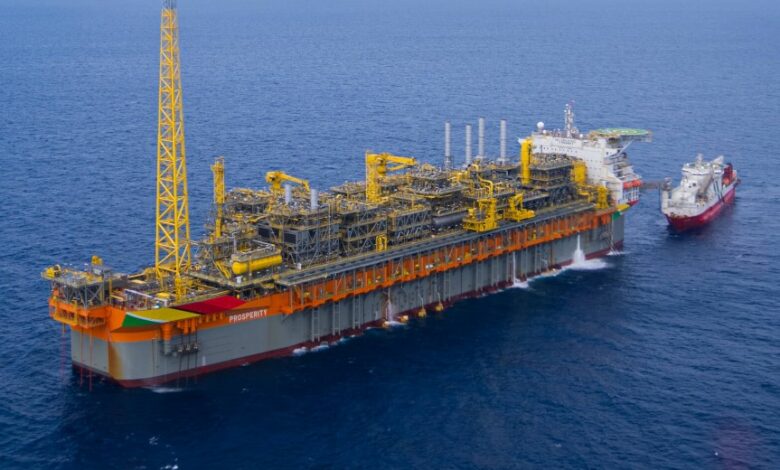
Stuart Turley: [00:01:31] Hey, let’s start with our buddies over there with the wind farms. Wind farms are overstating their output and consumers are paying for it. Hey, Mr. Producer, if you could pull in that picture there, it looks like it’s a wind farm. That’s actually kind of like doing the backstroke, you know? I mean. [00:01:48][16.7]

Michael Tanner: [00:01:48] Manic version of wind. [00:01:49][1.2]

Stuart Turley: [00:01:50] Farms. Yeah, it’s a Titanic. So, yeah. You know, if you, Michael, if you can’t make it work, lie about it. I think this is actually what they’re trying to do. Here is where it is. Bloomberg News analyzed 30 million records from 2018 from June to June. 2023. They said, of the 121 wind farms, 40 overstated their output by 10% or more on average. And 27 of those overestimated those by 20%. Wow. [00:02:26][36.0]

Michael Tanner: [00:02:27] That’s some predictions gone wrong. [00:02:29][1.3]

Stuart Turley: [00:02:29] Oh, retro. I mean, that is absolutely, spoken. Fred Olsen said statements that the firms were to take compliance with market regulations very seriously. Right, right. The average error should close to zero. They should be under. They should be right on the money. This is what’s happening folks. If graft and greed it gets into energy. This is where it shows up. [00:02:58][29.0]

Michael Tanner: [00:02:59] Well, you know I come from the oil and gas finance side of things. So I’m very familiar with how things can look great in a spreadsheet, but in reality not be not have that effect. I mean, anybody can sit down, open up Microsoft Excel and Pencil whip themselves a good investment scheme or pencil whip the model to make it seem like, oh, this is a great investment versus this is a bad one. If I just carry the four move where CapEx is coming out, oh, all of a sudden there’s free cash flow. And in reality you have to understand the business. And that’s what’s funny. I mean, a lot of this stuff that we’re going to talk about specifically in today’s show goes, goes to show you that people aren’t actually modeling the, or are just now becoming aware, and understanding that their models that they built around these, around a lot of this renewables energy goes back to what Warren Buffett said 4 or 5 years ago. Well, if it wasn’t for the wind tax credit, we wouldn’t be building them. Well, I mean that, you know, it’s helping. Exactly. Oh, in a $10 million tax credit, it’s going to make most stuff look profitable, especially when your your investment threshold is only somewhere between like eight and 14%. I mean, that’s not necessarily a big hurdle rate. I think the funny part is, is, you know, I came out and I’ll take an L on this one. Do I came up out about a month ago and said, hey, if there’s anything that I’m seeing from my vantage point, from the renewable side that’s holding up its wind, it’s offshore wind, that’s clearly not the case. We’re about to see or stand. I don’t want to tip it off too much, but we’re seeing a few things we will see. Ever since I said that, it was also like, oh, well, now here’s these 12 articles showing us that it they it’s actually could be holding up worse. So I got to take an early l on that one. [00:04:38][99.3]

Stuart Turley: [00:04:39] No, but it’s pretty funny. So let’s go to the next one here, dude. And, climate scientist. I interviewed a cool guy. It’s we’re going to, release it here in a little while. He’s a data scientist in the data scientists, are finding that they have been misrepresenting the numbers in climate, warming and and global warming. Stay tuned for that one. But here’s another one. Climate scientists warn an umbrella. The size of our Argentina. The block, the sun I have to give Tammy name is a shout out for this. She sent this over and it is. Who? Doctor Yoram Rosen, a physics professor at the Asher Space Research Institute at Technical Israel Technical Institute of Technology, is leading the team of scientists. We can show the world, look, there’s a working solution in case it’s to increase it to the necessary. Duh. [00:05:41][61.8]

Michael Tanner: [00:05:41] So let’s be clear here. So what exactly do they want to do here. So the underlying idea is that they’re going to take these huge you know they call them parcels. But they’re basically things that are somewhat transparent that can be positioned somewhere in space to attempt to marginally reduce the intensity of the sunlight, therefore, quote unquote, mitigating the threat of global warming. But here’s, here’s, here’s here’s what you got to realize in order to block out enough radiation, a single sunshade, the single sunshade would need to be approximately the size of Argentina. Really, it’s 1,000,000mi² weight 2.5 million tons. So that size. And so they’re attempting to see if this idea could work on a 100 foot square. And it may only the hunt. The 100 square foot prototype is going to cost between 10 to $20 million. I mean, I’d like to get on that bill of materials. When where can I put in a bid for that? [00:06:36][54.6]

Stuart Turley: [00:06:37] What this is, is a continuation of the climate scheme. Well, transfer is all that. Is there going to be getting handouts and that’s all. That’s all that that is when you take a look at being able to put that out in space. Guess where this episode was? This was an episode out of The Simpsons and it is now real. [00:06:59][22.4]

Michael Tanner: [00:07:00] It’s it’s absolutely insane how much they are going for it. But, you know, they’re estimating that a full size product would cost trillions of dollars. And it’s I mean, what’s hilarious is, is this is what we’re spending our time. Yeah. This is what we’re spending with the limited intelligence that the human species has left. I mean, it’s it’s small. The limited amount we’ve got left, we’re spending it on. We need to build something to block. I mean, this is literally this is stuff that, like you said, it’s out of The Simpsons. It’s something I’d expect to see the Babylon be right about. But now, now all of a sudden it’s it’s real and we’re fighting. And if you’re in Israel, your hard earned tax dollars are going towards it. [00:07:44][43.4]

Stuart Turley: [00:07:44] Oh, I think it’s just this big. I’d rather feed. I would rather put the trillions. Let’s get all the energy, low cost energy to Africa and let’s elevate several billion people out of poverty. That’s where I would rather go. All right, let’s go to the next one. Germany. Can Germany meet its ambitious wind energy targets? This one’s pretty tough, Michael. They’re doubling and tripling down on stupid. Not only did they kill their last two nuclear reactors in the past six months, if we managed to achieve what we set out to do. This is a quote. German chancellor, old slouch seems optimistic about governing his coalition. He says if we manage to achieve what we set out to do, I am confident we will then break with 200 years of industrial tradition and prosperity built on coal, gas and oil, said Schultz, speaking in in Potsdam. [00:08:42][57.9]

Michael Tanner: [00:08:43] Is that Sergeant Schultz? I think he’s heroes. [00:08:46][2.8]

Stuart Turley: [00:08:46] It’s his great grandson. I think it’s I see nothing there. Boom. [00:08:51][4.8]

Michael Tanner: [00:08:52] But not seeing anything? [00:08:53][1.0]

Stuart Turley: [00:08:54] No, but money in my pocket. Currently around 30% in Germany. Electrician electricity is generated by burning coal and gas. Wind turbines, meanwhile, generate almost half the country’s power. But their price is the highest in the world and they lost more GDP than just about anywhere else. So far, some 1500 turbines, 300m, nearly thousand feet tall, have been installed out at sea. Now they’re trying to increase it. [00:09:28][34.4]

Michael Tanner: [00:09:29] Well, and and this this article also points out something that, that someone like, if you’re going to go all in on wind energy, fine. You’re going to have to do it. You’re going to have to do it offshore because there’s just so many limited locations. The issue is not and this is where a lot of where my my analysis went wrong. The issue is not in this article brings it up, not the actual production of the wind energy. Sure, if you can throw up a wind farm and theoretically spin it 24 seven, you might be able to squeak out a 5 to 8%. You know, I I don’t know what the numbers. I’m just throwing out a slim margin, something that’s barely beating inflation. The problem is getting that offshore. The grid from where it’s. [00:10:06][37.6]

Stuart Turley: [00:10:07] Produced to. [00:10:08][1.0]

Michael Tanner: [00:10:08] Onshore is absolutely. Terrible. [00:10:10][2.4]

Stuart Turley: [00:10:11] Exactly. [00:10:11][0.0]

Michael Tanner: [00:10:13] And then this article says that, you know, in Germany specifically, they estimate that an area the size of 270 soccer fields need to be made. And I don’t know what the square mileage on this is. Probably two three square miles will soon have to be made in German, bought in order to support the wind farms offshore that are already there. So it’s we’ve got them. We just can’t turn them on because we don’t know where to connect them to. [00:10:36][23.6]

Stuart Turley: [00:10:37] Exactly. And, when you sit back and take a look at the money, he says that money is not going to be there. Let’s take Texas. Texas had to spend $3.4 billion to get from the West Texas wind farms, the transmission lines coming in. So just because you think that a windmill is going to be, $100,000, but then you try to nobody’s also in the U.S. or in Germany is saying, what about these things when these get decommissioned in ten years? Who’s going to get it? You know, the reclamation out of it. [00:11:13][36.3]

Michael Tanner: [00:11:14] Well, speaking of that, we’ve now got some. I’m teeing up this next article for you. This article actually puts a number on the life. You weren’t too far off. [00:11:23][9.3]

Stuart Turley: [00:11:24] Okay, sir. [00:11:24][0.4]

Michael Tanner: [00:11:24] Minus two years on the plus side. But you weren’t bad. What’s this next? [00:11:28][3.6]

Stuart Turley: [00:11:29] I’m always a. Let’s go to the next one here. Orsted strategic shakeup has its investors worried either. Michael, if you’re going downhill, you either just speed up and keep going downhill, or you try to hit your brakes and slow down. They don’t know what they can do right in here. The wind farm horse that will present its new strategy on Wednesday. It faces a serious cutting edge targets, either cutting dividends or asset sales, or how are they going to price themselves out? So, Michael, let’s go through some of these numbers here and see here the numbers. The 50 gigawatt target has to be removed in the market knows it. This is a quote from their financial markets guy, the Bank of America analysis said recommending Orsted shares by arguing the company can avoid the need for new capital by selling half of its U.S. businesses, reducing capital expenditures by 20%, and cutting dividends by a quarter. Either they’re going to have to keep hitting it and really producing it and then keep going, but they’re going to lose more money. So do you want to go, this is like the worst Ponzi scheme I’ve ever seen. Keep getting new money so that you can sink it into killing whales and then try to do this. So if they cut the losses, they cut their expenses. They’re not going to be a very good investor. Yeah. [00:13:05][96.1]

Michael Tanner: [00:13:05] So they’ve got their earnings coming up on Wednesday. It’s part of the reason they leaked this. You know if if you get bad news you might as well leak it prior to the announcement so that when you hear it you’ve already settled. And what they did say and they passed this along they’re now seeing and the wind farms, they’re divesting in gas. Guess what they’re selling a man. Well, years. Why? Because the maintenance is coming up. So you were, as I mentioned, you were close to you were plus minus two years. You were close. [00:13:33][27.8]

Stuart Turley: [00:13:34] No, it’s eight years. And the the 12 years is when you buy the extra four years of time with the tax incentives and subsidies that are on there. So the eight years is actually the only amount of time those things can actually work. I can guarantee if you took a look at some of those fields, they didn’t weren’t operating for the first couple years while they were trying to spin them up and get cable now. [00:14:01][27.0]

Michael Tanner: [00:14:02] So and and remember, why is there this big shift in strategy will remember, you know, in November, or, you know, over the last two years they’ve set this pretty insane target of 50GW of renewable capacity, most of that offshore wind, by the end of the decade. Now. Right. You’ve got a portfolio manager. I’m trying to find his name here or whoever this person is. But regardless, the quote is the 50 gigawatt target has to be removed and the market knows it. But they also need to cut their financial goals so deep that it hurts. That’s the quote. An investor wants to see them hurt. That’s when an investor says that that means things drastically need to change, because that’s going to cause it. Their stock price is going to take a hit, not like their stock price with his announcement is going to go up per se. It may it may not continue to fall. It may level out the falling because they they understand that people are coming out, but this isn’t going to hurt it regardless of whether or not they’re leaking it now. [00:14:58][55.9]

Stuart Turley: [00:14:59] Oh, absolutely. They, they need to invest 69 billion. They hit that. [00:15:03][4.4]

Michael Tanner: [00:15:04] I, I well I yeah I got no you got no help over here, guys. Sorry. [00:15:08][3.8]

Stuart Turley: [00:15:09] No, it’s out of my. Credit card limit. Let’s go to the next one. Laura Goldstein put this one out. When Trudeau’s government doesn’t know how much its carbon tax reduces emissions. You have to buy some serious entertainment on Monday to read this one. Our producer. This is absolutely a hoot. You take a look at this guy. He’s got the Ukrainian flag. That he’s in solidarity with his Canada’s minister of Environment and climate Change, Stephen. Go bear. So this. [00:15:43][34.0]

Michael Tanner: [00:15:43] Is, this is John Kerry’s counterpart. Sure. He’s brilliant. Sure. [00:15:47][3.7]

Stuart Turley: [00:15:47] He’s pretty. Is. He looks like he, has got the brain power of a potato bud, but we’ll just leave that alone for now. They don’t know. And I let me read you some of this in here. He boasted. Trudeau’s radical environment minister admits the government does not measure how many emissions are reduced by their costly carbon tax. Why? Because the carbon tax is not an iron environmental plan. It’s a tax plan. [00:16:13][26.2]

Michael Tanner: [00:16:14] Well, this is the quote. So this this comes from the John Kerry of Canada. Okay. Just to put that in perspective, if this is the quote, the government does not measure the annual amount of emissions that are directly reduced by the federal carbon pricing, retroactively attributing specific GHG reductions to a specific action, such as carbon pricing, a discrete regulation, or a discrete regulation, or in in specific incentive is difficult given the multiple interacting factors that influence emissions, including carbon pricing, taxes and fundings, program, investor premise, and consumer demand. And that came out via the National Inventory report. This is what the the people who are supposed to be overseeing and understanding at the minute level, how their policies are affecting the economy. I mean, he’s literally the minister of Environmental and Climate change. I mean, that’s I mean, talk about waste, the environment minister. Oh, absolutely. I just threw up in my mouth a little bit. But but but they they don’t even know it’s it’s it’s actually insane. [00:17:17][63.0]

Stuart Turley: [00:17:18] All it is, is a wealth transfer again. [00:17:20][1.9]

Michael Tanner: [00:17:20] It’s it’s like the government or any government coming out and saying, oh, well, we don’t actually know how much money we’ve sent overseas to help support this war. Oh, wait, that’s the United States. Considering we send an extra 6 billion to Ukraine. Remember the accounting error that that’ll be next in for Canada. They’re going to take a playbook out of us and say, oh, well, it was an accounting error plus or -6 billion. [00:17:42][21.2]

Stuart Turley: [00:17:42] Well, that’s almost like the accounting error in the, Pentagon. They lost $2 trillion. And then the following Monday was 911. And then the Pentagon was blown up where their records were. Go figure that out. [00:17:56][13.2]

Michael Tanner: [00:17:56] So here we go. The the the estimate net cost for people living in provinces under the federal carbon tax regime. Okay. So right here you basically got it starts at $65 per ton of emissions. And then the set. And then it’s going to then increase to 170 come 2030. But what’s crazy is if you adjust that for living standards, you’re talking it could be $700 in Alberta, $2,700 in Ontario. Or excuse me, for hunt, excuse me at 710. And Alberta right now could go up to 2720 30. Ontario’s 478 could go up to 1800. Saskatchewan for ten could go all the way up to 17,000 or $1700. Manitoba three. I mean, basically everything’s about to triple come 2030, but they don’t even they don’t even know how much it’s help. [00:18:45][49.4]

Stuart Turley: [00:18:46] It doesn’t help any. All it does is pass the buck around and then it again. It’s another tax in is a direct in, impacting of inflation and destroying the lower and middle class. [00:18:59][13.1]

Michael Tanner: [00:19:00] Yeah. I mean, you said it best. [00:19:02][1.6]

Stuart Turley: [00:19:03] Oh, yeah. You gotta love today, though. It was fun. [00:19:05][2.3]

Michael Tanner: [00:19:06] No. Absolutely. Well, before we move over to finance, guys will quickly pay the bills here. As always, the news and analysis, that you’ve been here is brought to you by the world’s greatest website, energy news. Become the best place for all your energy and oil and gas news. Stu and the team do an outstanding job of making sure that website stays up to speed with everything you need to be need to know to be the tip of the spear when it comes to the energy and the oil and gas business. You can also email the show questions at Energy News b.com. You can check us out. Dashboard dot energy newsbeat.com. That is our data news combo product. Really pushing that hard. here in V1 are in Q1 Q2. So really exciting stuff come around the corner. You can email us, and check out the description below for all the timestamps, all the links to the articles that we just heard. And again, you can get in contact with the show there. You can follow Stuani on LinkedIn, everything in that description below. But let’s quickly move over now to a to what happened in the markets. I mean, I mean Friday, we mean this week in oil was kind of a bloodbath stew. But but we’ll start with the overall market. They actually finish strong on Monday. S&P 500 up a full percentage point. Pushing all time highs. They’re 49,000 or 4958 for that S&P. Nasdaq actually up 1.7%. We got a lot of earnings dropping both in tech and and non-tech energy’s got a lot to cover. Chevron and Exxon earnings. But most oil and gas earnings come later in February. You’re seeing the beginning of February. We get a lot of tech a lot of banking. So that’s mainly why we’re seeing the Nasdaq one a little bit. US ten year yields up 3.6 percentage points. Dollar index stays basically flat 0.0% increase. We did see Bitcoin stay fairly flat. Still $42,800. Crude oil took about a 2.1% hit on Friday. Down $1.54 7228. That’s down about $5 more. Was trading just on Thursday sitting or excuse me on on on Monday or excuse me February 1st. That would have been Tuesday or Wednesday. It was trading midday overnight. Absolutely insane. Did you see the absolute just just falling out of the table again? We were we were sitting there on Tuesday, a little above 7650 currently as the market closed, 7241. The market will open here, in about an hour and a half here as we sit about 415 as we record the Central Standard Time here on, February the 4th. So, Brant, what’s interesting is Brant was only down 70, or about a percent or a little less than a percent, about a half percentage point 78, 34. You know, I think really we saw part of the reason the market was big on Friday, mainly the overall markets, not the oil and gas, sector continues. We did see some strong jobs numbers. Now or you know, mainly there was we added a lot more jobs in Friday or on Friday coming out of the US, which is funny because that means that we may not then cut rates, because if we’re adding jobs and have been raising rates, why would we cut rates when the job of the fed is to support on him is to maintain employment versus inflation? So if we’re raising rates and theoretically jobs are coming back, we can debate whether or not we actually believe that or not. But if jobs are staying strong, well, there’s no point to cut rates, which is going to hurt overall markets, specifically the US dollar. And then again, the oil and gas, you know, there’s some easing tensions going on in the Middle East despite us or you know or that’s what they say. Again, if you if you read Reuters, you know we did see rig counts drop by two. And it’s just very interesting. I had a lunch about a week, week and a half ago. And we were just we were talking about how, you know, this is the exact same macroeconomic factors that we had about a year ago. Take away the, you know, take away, obviously what’s going on in the Middle East. We are sitting about $70 a year ago, and we had 140 more rigs at the same oil price this year. What does that tell you? Why just tells you from a macro perspective, people are extremely pessimistic, whether or not they’ll tell you or not, they’re pessimistic about where or who are or where oil prices are going. Now they may. And those are the people that matter. These are the people making the drilling schedules. These are the people expanding the CapEx. They’re not too optimistic that prices are just going to run, despite a lot of bloviating by talking heads like stew. And I you know, we’ll tell you oil going to go to 120. The guys buying the rigs are a little bit hesitant or we’d see that or you’d see rig count higher than last year. If you thought again, if you thought prices were going to go up and that’s your thesis, you should be buying as much rig time as you can right now because it’s going to go it’s going to just increase as prices go above 90. So it’s a little bit of like, you know, hey, prices are going to go up, but we’re not really actually going to invest that way. So it’s very interesting. You know, Canada, we saw two rigs come up internationally. We saw a bump of ten. But what I think the big thing we saw on Friday specifically was Exxon, Chevron dropping their earnings. We’ll start with Chevron, you know, pretty good earnings for Chevron. They, they pop three percentage points, up on this news mainly due to the fact that they had any, really big, non upstream growth in their chemicals business. So, I mean, when we look at the earnings between Chevron, Exxon and those super majors relative to, you know, some of the other ENP shale companies that are publicly we look at, you have to remember that there is a whole nother business or business unit that goes into Chevron. And with Exxon, there’s there’s multiple Chevron specific they’ve got a large refining business, and that’s about 30, 35% of their net income, specifically comes from their, refinery business. So that’s a lot of what you’re seeing reflected in these numbers here, obviously. Yes. Upstream did lead the way, with about 6.4 billion and in fourth quarter adjusted earnings, that came down to, about 2.3 billion in terms of a net number. So we, you know, you got a net adjusted earnings. You know, just, the these are the link energy news be.com. They’ll have all the numbers here, but we’ll quickly run through the highlights. This is specifically reported, reported by Chevron. So as remember guys, there was about $1.8 billion of U.S. upstream impairment charges that they took. That 1.8 billion specifically comes from California and their, and their assets around Bakersfield. They also have a $1.9 billion decommissioning obligation from some previously sold assets in the Gulf of Mexico. So that’s your big difference between your six point, four net earnings and then all at then what you came out to be or excuse me adjusted earnings at 6.4 billion. Then your actual reported earnings of 2.3 billion. That’s due to a couple impairment charges that we just, went over right there. Some quick highlights from again, they did, sell some assets in Gulf of Mexico and took some impairment charges in California. You know, they set annual records for for net oil equivalent. They went ahead and closed their acquisition of PDC energy, which is a Colorado company. That’s mainly due to they were that’s mainly the reason why they were up 4% year over year. Added a bunch of reserves, again, mainly from that PDP or PDC acquisition. CapEx is interesting, still up 32% year over year, primarily due to most to to to an increase of about 500 million of capital invested, specifically in PDC assets. A lot of that is in Colorado, and it’s an interesting part. You know, why is someone like Chevron able to acquire PDC while they have the ability to handle the regulatory environment that’s going on there right now, and they you got to invest a lot of money in there. We know a lot about that. They also eliminated about $4 billion of debt. And they’ve actually gone ahead and reduce their debt, write net debt ratio and retired all of the debt that was assumed via the PDC acquisition. Part of the reason, though, we saw the stock price, increase specifically in this go round, is that they decided to go ahead and and release a dividend. That dividend brought the record amount of cash returned to shareholders in 2023, 26.3 billion, again that split between dividends, and share repurchases, which sat at $14.9 billion, 33%. Absolutely insane. I mean, you know, we can talk the merits of share buybacks all we want, you know, but again, hear them coming out, we you know, we should talk about this. A few years ago nobody was saying they were doing share buybacks. They were just they were keeping it quiet. They’re coming out and saying this 8% dividend quarterly dividend increase. It’s coming around. So again, that’s a lot of what we’re seeing in this, in this bump. But but all around Chevron really, really solid earnings. You know, the other thing that they finished the year with was that agreement to buy has it’s going to really diversify them both in the United States gets them into onshore specifically gets them into North Dakota in the back end with has being very active there. And then they consolidate, their, their Guyana infrastructure and their Guyana position. Remember is primary non partner there. with Chevron. Go ahead and and snatching that up specifically kind of just goes ahead and dime kind of locks a lot of that stuff in place. You know the other 400 pound gorilla in the room. You know if you if you thought the earnings for for Chevron were big Exxon, they’ve even got a bigger chemicals business. They’ve got a bigger refining business. They’ve got a bigger shipping business. You know, they also have more. Yeah. Got more gas stations that they that they’re leasing their name out to. So they generated earnings of 36.1 billion. Now that’s in 2023. So just to give you an idea it’s in fourth quarter is 7.7 net earnings. specifically you know they go ahead and and I mean it was an okay it was an okay earnings report. Then they actually dropped about a half a percentage point, mainly off the fact, that they went ahead, and didn’t decide to increase their dividend. They went ahead and just, kept it the same. They did they did, announce a, that they were going to go ahead and buy back a little bit more of their stock. Looks like trying to find the number here. I think it was in the $10 billion range. Excuse me, 17.4 billion of share, buybacks. Absolutely incredible. Again, you know, that’s what the I mean, you know, if you if you’re going to own a super major, you better hope they’re giving you a dividend or else there’s no reason to invest in that. You know, a lot of cash flow $13.7 billion. You know, they you know they had $2.3 billion of asset impairments. But they also what’s interesting is because they have they they’re such an international business, they, you know, with the dollar relative to the rest of the world’s currency, they actually saw an impairment mainly on that currency arbitrage, because they try to get a lot of that stuff back into the United States. The other interesting that they did was start, drilling their first lithium well, which is over there in southwest Arkansas. Apparently, supplies have a bunch of lithium deposits. We will see if they went ahead and took off. And in the fourth quarter took off the table. As you guys know, Pioneer Natural Resources, that was in October of 2023. You know, we’ll see if that closes. I mean we’ll see if it closes. It should. Close in 2024. I’ve heard some, you know, interesting regulatory news on that. I don’t know if you have any if you’ve heard anything new, but I’ve heard that pioneer acquisition, it may not be good or not that it’s not going to be good, but that the the FTC is really looking into it. And oh yeah, they’ve been oddly quiet. We haven’t heard anything about it recently. [00:30:26][680.4]

Stuart Turley: [00:30:27] I think it’s about to get political. I think that they’re going to start monkeying around with it. So buckle up. [00:30:33][6.0]

Michael Tanner: [00:30:33] Yeah, absolutely. And I think it’s it’s you know, again, Exxon also has a big position in Guyana. They go ahead and not not you know they were the other company that that would have made sense for Hess. I think, you know, I love reading the the merger agreements. Once the merger is official, you have to release kind of a merger agreement where they actually walk through the timeline of the M&A process. And there’s always company A, B, number C is the company they bought. And and D and there’s always these things. My guess is you know depending on how many companies they name my guess is is has is going to be one of them. Because if you’re Exxon and didn’t look at Hess specifically to see that you could tie up again some of that Guyana stuff where growth is really going to now come off shore. I think, you know, a lot of people have come to the conclusion that, yes, there’s a lot of stuff to do on shore specifically, but that real huge growth from an a production standpoint, it’s really going to come off shore if you’re these larger companies. So absolutely incredible. You know, you got to remember these guys, Exxon’s a lot bigger. They’ve got, you know, you’ve got a net, they got an upstream business they call an energy. They have an energy products business. Chemical products business, they call it specialty products. And, and and that kind of rounds out their business unit. So a lot, much, a lot more going on. But you know, good earnings for them, I wouldn’t say, you know, Chevron seem to have come out on top, or at least the analysts liked it better. We saw their stock rise tremendously. But both continuing to truck on. That’s really all I’ve got to do. I want to hit on something real quick here. You just released actually today as we record this on Sunday. A really an episode that’s kind of going viral with Michael on the overview that. Well, where can people watch that? [00:32:13][99.4]

Stuart Turley: [00:32:14] I released it on, X, actually, and I did not put it on YouTube. And it’s, I think at about 50,000 views. And that’s just within a few hours. So you sit back and go, that’s a two hour episode. Michael Yon is a war correspondent. He and I were talking about the energy on the grid in the crisis at the border. What does that have to do with each other? And it’s actually pretty frightening when you consider that, the article that just came out, Michael, that we also talked about last week, was the FBI head of the FBI saying that the Chinese have the capability remotely controlling and taking the grid down. So you and all these things in there that Mayorkas, our secretary, event as, Homeland Security, Michael Yon saw him at the Chinese camp. Another article comes through and ours goes off like you wouldn’t believe. People are hungry for that kind of information. [00:33:14][60.6]

Michael Tanner: [00:33:15] No, it’s got over, you know, 25,000 views, and it’s only been up for a couple hours. So we’ll highly recommend checking Stu out, on Twitter. Great. Follow. I mean, follow me. Hurry. I, I will say you follow me on your behalf. Sometimes I gotta, I gotta not look at his Twitter because it’s so it’s so scary because Stu’s really at the tip of the spear, making sure that you’re staying is, again, up to speed. But it can be a little scary. You you you know more than you’d care to know. Sometimes we wish we could just wipe your brain clean and get a fresh slate, because you got so much rattling around up there. [00:33:46][30.8]

Stuart Turley: [00:33:47] Yeah, the only thing about that, Michael, is so many people who reached out to me from around the world to talk, about things. So I have some great resources. And, my wife is always hear me saying, I wish I didn’t know what I know. [00:34:00][13.2]

Michael Tanner: [00:34:02] I say the same thing sometimes. I wish I didn’t know any of this stuff, but we got to. Before we go, guys, next week, February 7th through ninth, we’re going to be at N.A. really excited about that. We’re going to be coming to you, live Wednesday. I’m not live, but we’re going to have podcast that we’re doing there, Wednesday and Thursday. If you’re there, come check us out. Booth. And Friday, come check us out. Booth 1957. Say, you heard you heard about this through the podcast, and Stu will give you some. Stu will give you a hug. So actually, you may not want to say that I just lie and say you walked by. I wouldn’t want to touch me either, but come check us out. It’s going to be really fun. We got myself, Stu, Artie Trevino. Who’s running? Paco’s operating. We love them. David Blackmon, probably one of the better energy influencers out there right now, specifically talking about all things the grid. We’re gonna have lots of other companies. We got lots of interviews going on. It’s going to be fun, guys. Really excited. And just come check us out again. That’s February 7th through the night. So it’s that Wednesday, Thursday, Friday. If you’re walking the floor Thursday or Friday morning check us out. Booth 1950. Seven. It’s going to be fun. [00:35:09][67.7]

Stuart Turley: [00:35:10] It’s going to be a great time. Thank you Mike. [00:35:11][1.2]

Michael Tanner: [00:35:12] Absolutely. So with that guys we’re going to let you get out of here. Start your Monday. Hopefully it’s only a couple meetings you got to attend. Don’t stab your pencil through your head. Wait to do that till you after you listen to Michael Yawn episode two. At least you can be informed. But then we’ll, read for those of you make it through Monday. We’ll see you Tuesday, and we’ll, we’ll make it happen. So appreciate it, guys. We’ll see you tomorrow. [00:35:12][0.0][2061.7]

– Get in Contact With The Show –

The post Daily Energy Standup Episode #300 – Wind Farm Challenges, Global Warming Solutions, and Oil & Gas Finance Market Analysis appeared first on Energy News Beat.


How the Housing Market Split in Two, Doubts about the Taming of Inflation, and What’s Going on with New &; Used Vehicles

Energy News Beat

Wolf Richter on “This Week in Money,” at HoweStreet.com, recorded on February 1:

Enjoy reading WOLF STREET and want to support it? You can donate. I appreciate it immensely. Click on the beer and iced-tea mug to find out how:

Would you like to be notified via email when WOLF STREET publishes a new article? Sign up here.

The post How the Housing Market Split in Two, Doubts about the Taming of Inflation, and What’s Going on with New &; Used Vehicles appeared first on Energy News Beat.


Chevron Reports Fourth Quarter 2023 Results

Energy News Beat

Reported earnings of $2.3 billion; adjusted earnings of $6.5 billion


Record $26.3 billion cash returned to shareholders in 2023


Record annual worldwide and U.S. production


Announced an 8 percent increase in quarterly dividend to $1.63/share

SAN RAMON, Calif., Feb. 02 /BusinessWire/ — Chevron Corporation (NYSE:CVX) reported earnings of $2.3 billion ($1.22 per share – diluted) for fourth quarter 2023, compared with $6.4 billion ($3.33 per share – diluted) in fourth quarter 2022. Included in the current quarter were $1.8 billion of U.S. upstream impairment charges and $1.9 billion of decommissioning obligations from previously sold assets in the U.S. Gulf of Mexico. Foreign currency effects decreased earnings by $479 million. Adjusted earnings of $6.5 billion ($3.45 per share – diluted) in fourth quarter 2023 compared to adjusted earnings of $7.9 billion ($4.09 per share – diluted) in fourth quarter 2022. See Attachment 4 for a reconciliation of adjusted earnings.


Earnings & Cash Flow Summary

Unit

4Q 2023

3Q 2023

4Q 2022

2023

2022

Total Earnings / (Loss)

$ MM

$

2,259

$

6,526

$

6,353

$

21,369

$

35,465

Upstream

$ MM

$

1,586

$

5,755

$

5,485

$

17,438

$

30,284

Downstream

$ MM

$

1,147

$

1,683

$

1,771

$

6,137

$

8,155

All Other

$ MM

$

(474

)

$

(912

)

$

(903

)

$

(2,206

)

$

(2,974

)

Earnings Per Share – Diluted

$/Share

$

1.22

$

3.48

$

3.33

$

11.36

$

18.28

Adjusted Earnings (1)

$ MM

$

6,453

$

5,721

$

7,850

$

24,693

$

36,542

Adjusted Earnings Per Share – Diluted (1)

$/Share

$

3.45

$

3.05

$

4.09

$

13.13

$

18.83

Cash Flow From Operations (CFFO)

$ B

$

12.4

$

9.7

$

12.5

$

35.6

$

49.6

CFFO Excluding Working Capital (1)

$ B

$

11.4

$

8.9

$

11.5

$

38.8

$

47.5

(1) See non-GAAP reconciliation in attachments

“In 2023, we returned more cash to shareholders and produced more oil and natural gas than any year in the company’s history,” said Mike Wirth, Chevron’s chairman and chief executive officer. Cash returned to shareholders totaled over $26 billion for the year, 18 percent higher than last year’s record total, and annual worldwide net oil-equivalent production increased to over 3.1 million barrels of oil-equivalent per day, led by 14 percent growth in the United States.

“We also strengthened our portfolio with traditional and new energy acquisitions to help meet the growing demand for affordable, reliable, and ever-cleaner energy,” Wirth concluded. In 2023, the company completed several acquisitions, including PDC Energy, Inc. and a majority stake in ACES Delta, LLC, and signed an agreement to acquire Hess Corporation.

Financial and Business Highlights

Unit

4Q 2023

3Q 2023

4Q 2022

2023

2022

Return on Capital Employed (ROCE)

%

5.1

%

14.5

%

14.2

%

11.9

%

20.3

%

Capital Expenditures (Capex)

$ B

$

4.4

$

4.7

$

3.8

$

15.8

$

12.0

Affiliate Capex

$ B

$

0.9

$

0.8

$

1.0

$

3.5

$

3.4

Free Cash Flow (1)

$ B

$

8.1

$

5.0

$

8.7

$

19.8

$

37.6

Free Cash Flow ex. working capital (1)

$ B

$

7.1

$

4.2

$

7.7

$

23.0

$

35.5

Debt Ratio (end of period)

%

11.5

%

11.1

%

12.8

%

11.5

%

12.8

%

Net Debt Ratio (1) (end of period)

%

7.3

%

8.1

%

3.3

%

7.3

%

3.3

%

Net Oil-Equivalent Production

MBOED

3,392

3,146

3,011

3,120

2,999

(1) See non-GAAP reconciliation in attachments

2023 Financial Highlights

Reported earnings declined compared to last year primarily due to lower upstream realizations, losses from decommissioning obligations for previously sold assets in the U.S. Gulf of Mexico, higher U.S. upstream impairment charges mainly in California and lower margins on refined product sales.
Worldwide and U.S. net oil-equivalent production set annual records. Worldwide production was up 4 percent from a year ago primarily due to the acquisition of PDC Energy, Inc. (PDC) and growth in the Permian Basin, which was up 10 percent over 2022.
Added approximately 980 million barrels of net oil-equivalent proved reserves in 2023, which are subject to final reviews, that equate to 86 percent of net oil equivalent production for the year. The largest net additions were from acquisitions in the United States, and extensions and discoveries in the Permian Basin. The largest net reductions were from revisions in the Permian Basin, east Texas and California.
Capex in 2023 was up 32 percent from last year primarily due to higher investments in the United States, including about $450 million invested in PDC assets post-acquisition and approximately $650 million of inorganic spend, mainly due to the acquisition of a majority stake in ACES Delta, LLC. Capex excludes the acquisition cost of PDC.
Cash flow from operations was lower than a year ago mainly due to lower commodity prices and lower margins on refined product sales. Over the past three years, the company has generated over $110 billion in cash flow from operations and nearly $80 billion of free cash flow.
Eliminated over $4 billion of debt, including all debt assumed in the PDC acquisition, resulting in a net debt ratio of 7.3 percent.
The company returned a record $26.3 billion of cash to shareholders during 2023, including dividends of $11.3 billion (3 percent higher than 2022) and share repurchases of $14.9 billion (32 percent higher than last year).
The company’s Board of Directors declared an 8 percent increase in the quarterly dividend to one dollar and sixty-three cents ($1.63) per share, payable March 11, 2024, to all holders of common stock as shown on the transfer records of the corporation at the close of business on February 16, 2024.

2023 Business Highlights

Completed the acquisition of PDC, enhancing the company’s strong presence in the DJ and Permian Basins in the United States.
Completed the acquisition of a majority stake in ACES Delta, LLC, which is developing a green hydrogen production and storage hub in Utah.
Achieved first oil at the Mad Dog 2 project in the Gulf of Mexico.
Achieved first natural gas production from the Gorgon Stage 2 development in Australia.
Achieved mechanical completion on the Future Growth Project at the company’s 50 percent-owned affiliate, Tengizchevroil.
Converted the diesel hydrotreater at the El Segundo, California refinery to process either 100 percent renewable or traditional feedstocks.
Reached final investment decision to construct a third gathering pipeline that is expected to increase natural gas production capacity at the Leviathan reservoir, offshore Israel.
Expanded the Bayou Bend carbon capture and sequestration hub on the U.S. Gulf Coast through an acquisition of nearly 100,000 acres.
Received approvals to extend Block 0 concession in Angola through 2050.
Received approval to extend licenses with PetroBoscan, S.A. and PetroIndependiente, S.A. in Venezuela through 2041.
Acquired 73 exploration blocks in the Gulf of Mexico (GOM) lease sale 259 and submitted winning bids on 28 blocks in GOM lease sale 261, subject to final government approval.
Announced a definitive agreement to acquire Hess Corporation, which is expected to strengthen Chevron’s long-term performance by adding world-class assets and people.

Segment Highlights

Upstream

U.S. Upstream

Unit

4Q 2023

3Q 2023

4Q 2022

2023

2022

Earnings / (Loss)

$ MM

$

(1,347

)

$

2,074

$

2,618

$

4,148

$

12,621

Net Oil-Equivalent Production

MBOED

1,598

1,407

1,192

1,349

1,181

Liquids Production

MBD

1,164

1,028

895

997

888

Natural Gas Production

MMCFD

2,604

2,275

1,789

2,112

1,758

Liquids Realization

$/BBL

$

58.69

$

62.42

$

66.00

$

59.19

$

76.71

Natural Gas Realization

$/MCF

$

1.62

$

1.39

$

4.94

$

1.67

$

5.55

U.S. upstream reported a loss in the fourth quarter 2023. The results were lower than the year-ago period primarily due to charges associated with decommissioning obligations for previously sold assets in the U.S. Gulf of Mexico, higher impairment charges mainly from assets in California, and lower realizations. These items were partially offset by higher sales volumes, including from production post-closing of the PDC acquisition.
U.S. net oil-equivalent production was up 34 percent from fourth quarter 2022 and set a new quarterly record, primarily due to the acquisition of PDC, which added 266,000 oil-equivalent barrels per day during the quarter, and higher production in the Permian Basin.

International Upstream

Unit

4Q 2023

3Q 2023

4Q 2022

2023

2022

Earnings / (Loss) (1)

$ MM

$

2,933

$

3,681

$

2,867

$

13,290

$

17,663

Net Oil-Equivalent Production

MBOED

1,794

1,739

1,819

1,771

1,818

Liquids Production

MBD

851

803

852

833

831

Natural Gas Production

MMCFD

5,661

5,616

5,799

5,632

5,919

Liquids Realization

$/BBL

$

74.54

$

75.64

$

77.67

$

71.70

$

90.71

Natural Gas Realization

$/MCF

$

7.31

$

6.96

$

10.35

$

7.69

$

9.75

(1) Includes foreign currency effects

$ MM

$

(162

)

$

584

$

(83

)

$

376

$

816

International upstream earnings in the fourth quarter 2023 were higher than a year ago primarily due to the absence of fourth quarter 2022 write-off and impairment charges, and lower operating expenses, partially offset by lower realizations.
Net oil-equivalent production during the quarter was down 25,000 barrels per day from a year earlier primarily due to normal field declines.

Downstream

U.S. Downstream

Unit

4Q 2023

3Q 2023

4Q 2022

2023

2022

Earnings / (Loss)

$ MM

$

470

$

1,376

$

1,180

$

3,904

$

5,394

Refinery Crude Oil Inputs

MBD

923

961

888

934

866

Refined Product Sales

MBD

1,298

1,303

1,236

1,287

1,228

U.S. downstream earnings in fourth quarter 2023 were lower compared to last year primarily due to lower margins on refined product sales.
Refinery crude oil inputs during the quarter increased 4 percent from the year-ago period as the company processed more crude oil in place of other feedstocks.
Refined product sales in fourth quarter 2023 were up 5 percent from the year-ago period, primarily due to higher demand for jet fuel.

International Downstream

Unit

4Q 2023

3Q 2023

4Q 2022

2023

2022

Earnings / (Loss) (1)

$ MM

$

677

$

307

$

591

$

2,233

$

2,761

Refinery Crude Oil Inputs

MBD

629

625

653

626

639

Refined Product Sales

MBD

1,437

1,431

1,441

1,445

1,386

(1) Includes foreign currency effects

$ MM

$

(58

)

$

24

$

(112

)

$

(12

)

$

235

International downstream earnings during the quarter were higher compared to a year ago primarily due to lower unfavorable foreign currency effects.
Refinery crude oil inputs in fourth quarter 2023 decreased 4 percent from the year-ago period as refinery runs decreased due to planned shutdowns.
Refined product sales during the quarter were flat compared to fourth quarter last year.

All Other

All Other

Unit

4Q 2023

3Q 2023

4Q 2022

2023

2022

Net charges (1)

$ MM

$

(474

)

$

(912

)

$

(903

)

$

(2,206

)

$

(2,974

)

(1) Includes foreign currency effects

$ MM

$

(259

)

$

(323

)

$

(210

)

$

(588

)

$

(382

)

All Other consists of worldwide cash management and debt financing activities, corporate administrative functions, insurance operations, real estate activities and technology companies.
Net charges in fourth quarter 2023 decreased compared to a year ago primarily due to lower employee benefit costs and favorable tax items.

Chevron is one of the world’s leading integrated energy companies. We believe affordable, reliable and ever-cleaner energy is essential to enabling human progress. Chevron produces crude oil and natural gas; manufactures transportation fuels, lubricants, petrochemicals and additives; and develops technologies that enhance our business and the industry. We aim to grow our oil and gas business, lower the carbon intensity of our operations and grow new lower carbon businesses in renewable fuels, hydrogen, carbon capture, offsets and other emerging technologies. More information about Chevron is available at www.chevron.com.

NOTICE

Chevron’s discussion of fourth quarter 2023 earnings with security analysts will take place on Friday, February 2, 2024, at 8:00 a.m. PT. A webcast of the meeting will be available in a listen-only mode to individual investors, media, and other interested parties on Chevron’s website at www.chevron.com under the “Investors” section. Prepared remarks for today’s call, additional financial and operating information and other complementary materials will be available prior to the call at approximately 3:30 a.m. PT and located under “Events and Presentations” in the “Investors” section on the Chevron website.

As used in this news release, the term “Chevron” and such terms as “the company,” “the corporation,” “our,” “we,” “us” and “its” may refer to Chevron Corporation, one or more of its consolidated subsidiaries, or to all of them taken as a whole. All of these terms are used for convenience only and are not intended as a precise description of any of the separate companies, each of which manages its own affairs.

Please visit Chevron’s website and Investor Relations page at www.chevron.com and www.chevron.com/investors, LinkedIn: www.linkedin.com/company/chevron, Twitter: @Chevron, Facebook: www.facebook.com/chevron, and Instagram: www.instagram.com/chevron, where Chevron often discloses important information about the company, its business, and its results of operations.

Non-GAAP Financial Measures – This news release includes adjusted earnings/(loss), which reflect earnings or losses excluding significant non-operational items including impairment charges, write-offs, decommissioning obligations from previously sold assets, severance costs, gains on asset sales, unusual tax items, effects of pension settlements and curtailments, foreign currency effects and other special items. We believe it is useful for investors to consider this measure in comparing the underlying performance of our business across periods. The presentation of this additional information is not meant to be considered in isolation or as a substitute for net income (loss) as prepared in accordance with U.S. GAAP. A reconciliation to net income (loss) attributable to Chevron Corporation is shown in Attachment 4.

This news release also includes cash flow from operations excluding working capital, free cash flow and free cash flow excluding working capital. Cash flow from operations excluding working capital is defined as net cash provided by operating activities less net changes in operating working capital, and represents cash generated by operating activities excluding the timing impacts of working capital. Free cash flow is defined as net cash provided by operating activities less capital expenditures and generally represents the cash available to creditors and investors after investing in the business. Free cash flow excluding working capital is defined as net cash provided by operating activities excluding working capital less capital expenditures and generally represents the cash available to creditors and investors after investing in the business excluding the timing impacts of working capital. The company believes these measures are useful to monitor the financial health of the company and its performance over time. Reconciliations of cash flow from operations excluding working capital, free cash flow and free cash flow excluding working capital are shown in Attachment 3.

This news release also includes net debt ratio. Net debt ratio is defined as total debt less cash and cash equivalents and marketable securities as a percentage of total debt less cash and cash equivalents and marketable securities, plus Chevron Corporation stockholders’ equity, which indicates the company’s leverage, net of its cash balances. The company believes this measure is useful to monitor the strength of the company’s balance sheet. A reconciliation of net debt ratio is shown in Attachment 2.

CAUTIONARY STATEMENTS RELEVANT TO FORWARD-LOOKING INFORMATION FOR THE PURPOSE OF “SAFE HARBOR” PROVISIONS OF THE PRIVATE SECURITIES LITIGATION REFORM ACT OF 1995

This news release contains forward-looking statements relating to Chevron’s operations and energy transition plans that are based on management’s current expectations, estimates and projections about the petroleum, chemicals and other energy-related industries. Words or phrases such as “anticipates,” “expects,” “intends,” “plans,” “targets,” “advances,” “commits,” “drives,” “aims,” “forecasts,” “projects,” “believes,” “approaches,” “seeks,” “schedules,” “estimates,” “positions,” “pursues,” “progress,” “may,” “can,” “could,” “should,” “will,” “budgets,” “outlook,” “trends,” “guidance,” “focus,” “on track,” “goals,” “objectives,” “strategies,” “opportunities,” “poised,” “potential,” “ambitions,” “aspires” and similar expressions are intended to identify such forward-looking statements. These statements are not guarantees of future performance and are subject to certain risks, uncertainties and other factors, many of which are beyond the company’s control and are difficult to predict. Therefore, actual outcomes and results may differ materially from what is expressed or forecasted in such forward-looking statements. The reader should not place undue reliance on these forward-looking statements, which speak only as of the date of this news release. Unless legally required, Chevron undertakes no obligation to update publicly any forward-looking statements, whether as a result of new information, future events or otherwise.

Among the important factors that could cause actual results to differ materially from those in the forward-looking statements are: changing crude oil and natural gas prices and demand for the company’s products, and production curtailments due to market conditions; crude oil production quotas or other actions that might be imposed by the Organization of Petroleum Exporting Countries and other producing countries; technological advancements; changes to government policies in the countries in which the company operates; public health crises, such as pandemics and epidemics, and any related government policies and actions; disruptions in the company’s global supply chain, including supply chain constraints and escalation of the cost of goods and services; changing economic, regulatory and political environments in the various countries in which the company operates; general domestic and international economic, market and political conditions, including the military conflict between Russia and Ukraine, the war between Israel and Hamas and the global response to these hostilities; changing refining, marketing and chemicals margins; actions of competitors or regulators; timing of exploration expenses; timing of crude oil liftings; the competitiveness of alternate-energy sources or product substitutes; development of large carbon capture and offset markets; the results of operations and financial condition of the company’s suppliers, vendors, partners and equity affiliates; the inability or failure of the company’s joint-venture partners to fund their share of operations and development activities; the potential failure to achieve expected net production from existing and future crude oil and natural gas development projects; potential delays in the development, construction or start-up of planned projects; the potential disruption or interruption of the company’s operations due to war, accidents, political events, civil unrest, severe weather, cyber threats, terrorist acts, or other natural or human causes beyond the company’s control; the potential liability for remedial actions or assessments under existing or future environmental regulations and litigation; significant operational, investment or product changes undertaken or required by existing or future environmental statutes and regulations, including international agreements and national or regional legislation and regulatory measures related to greenhouse gas emissions and climate change; the potential liability resulting from pending or future litigation; the ability to successfully integrate the operations of the company and PDC Energy, Inc. and achieve the anticipated benefits from the transaction, including the expected incremental annual free cash flow; the risk that Hess Corporation (Hess) stockholders do not approve the potential transaction, and the risk that regulatory approvals are not obtained or are obtained subject to conditions that are not anticipated by the company and Hess; potential delays in consummating the potential transaction, including as a result of regulatory proceedings; the company’s ability to integrate Hess’ operations in a successful manner and in the expected time period; the possibility that any of the anticipated benefits and projected synergies of the potential transaction will not be realized or will not be realized within the expected time period; the company’s future acquisitions or dispositions of assets or shares or the delay or failure of such transactions to close based on required closing conditions; the potential for gains and losses from asset dispositions or impairments; government mandated sales, divestitures, recapitalizations, taxes and tax audits, tariffs, sanctions, changes in fiscal terms or restrictions on scope of company operations; foreign currency movements compared with the U.S. dollar; higher inflation and related impacts; material reductions in corporate liquidity and access to debt markets; changes to the company’s capital allocation strategies; the effects of changed accounting rules under generally accepted accounting principles promulgated by rule-setting bodies; the company’s ability to identify and mitigate the risks and hazards inherent in operating in the global energy industry; and the factors set forth under the heading “Risk Factors” on pages 20 through 26 of the company’s 2022 Annual Report on Form 10-K and in subsequent filings with the U.S. Securities and Exchange Commission. Other unpredictable or unknown factors not discussed in this news release could also have material adverse effects on forward-looking statements.

Attachment 1

CHEVRON CORPORATION – FINANCIAL REVIEW

(Millions of Dollars, Except Per-Share Amounts)

(unaudited)

CONSOLIDATED STATEMENT OF INCOME

Three Months Ended
December 31,

Year Ended
December 31,

REVENUES AND OTHER INCOME

2023

2022

2023

2022

Sales and other operating revenues

$

48,933

$

54,523

$

196,913

$

235,717

Income (loss) from equity affiliates

990

1,623

5,131

8,585

Other income (loss)

(2,743

)

327

(1,095

)

1,950

Total Revenues and Other Income

47,180

56,473

200,949

246,252

COSTS AND OTHER DEDUCTIONS

Purchased crude oil and products

28,477

32,570

119,196

145,416

Operating expenses (1)

7,523

7,891

29,240

29,321

Exploration expenses

254

453

914

974

Depreciation, depletion and amortization

6,254

4,764

17,326

16,319

Taxes other than on income

1,062

864

4,220

4,032

Interest and debt expense

120

123

469

516

Total Costs and Other Deductions

43,690

46,665

171,365

196,578

Income (Loss) Before Income Tax Expense

3,490

9,808

29,584

49,674

Income tax expense (benefit)

1,247

3,430

8,173

14,066

Net Income (Loss)

2,243

6,378

21,411

35,608

Less: Net income (loss) attributable to noncontrolling interests

(16

)

25

42

143

NET INCOME (LOSS) ATTRIBUTABLE TO CHEVRON CORPORATION

$

2,259

$

6,353

$

21,369

$

35,465

(1) Includes operating expense, selling, general and administrative expense, and other components of net periodic benefit costs.

PER SHARE OF COMMON STOCK

Net Income (Loss) Attributable to Chevron Corporation

– Basic

$

1.23

$

3.34

$

11.41

$

18.36

– Diluted

$

1.22

$

3.33

$

11.36

$

18.28

Weighted Average Number of Shares Outstanding (000’s)

– Basic

1,861,474

1,910,602

1,872,737

1,931,486

– Diluted

1,868,101

1,919,731

1,880,307

1,940,277

Note: Shares outstanding (excluding 14 million associated with Chevron’s Benefit Plan Trust) were 1,851 million and 1,901 million at December 31, 2023, and December 31, 2022, respectively.

EARNINGS BY MAJOR OPERATING AREA

Three Months Ended
December 31,

Year Ended
December 31,

2023

2022

2023

2022

Upstream

United States

$

(1,347

)

$

2,618

$

4,148

$

12,621

International

2,933

2,867

13,290

17,663

Total Upstream

1,586

5,485

17,438

30,284

Downstream

United States

470

1,180

3,904

5,394

International

677

591

2,233

2,761

Total Downstream

1,147

1,771

6,137

8,155

All Other

(474

)

(903

)

(2,206

)

(2,974

)

NET INCOME (LOSS) ATTRIBUTABLE TO CHEVRON CORPORATION

$

2,259

$

6,353

$

21,369

$

35,465

Attachment 2

CHEVRON CORPORATION – FINANCIAL REVIEW

(Millions of Dollars)

(unaudited)

SELECTED BALANCE SHEET ACCOUNT DATA (Preliminary)

December 31,
2023

December 31,
2022

Cash and cash equivalents

$

8,178

$

17,678

Marketable securities

$

45

$

223

Total assets

$

261,632

$

257,709

Total debt

$

20,836

$

23,339

Total Chevron Corporation stockholders’ equity

$

160,957

$

159,282

Noncontrolling interests

$

972

$

960

SELECTED FINANCIAL RATIOS

Total debt plus total stockholders’ equity

$

181,793

$

182,621

Debt ratio (Total debt / Total debt plus stockholders’ equity)

11.5

%

12.8

%

Adjusted debt (Total debt less cash and cash equivalents and marketable securities)

$

12,613

$

5,438

Adjusted debt plus total stockholders’ equity

$

173,570

$

164,720

Net debt ratio (Adjusted debt / Adjusted debt plus total stockholders’ equity)

7.3

%

3.3

%

RETURN ON CAPITAL EMPLOYED (ROCE)

Three Months Ended
December 31,

Year Ended
December 31,

2023

2022

2023

2022

Total reported earnings

$

2,259

$

6,353

$

21,369

$

35,465

Non-controlling interest

(16

)

25

42

143

Interest expense (A/T)

111

113

432

476

ROCE earnings

2,354

6,491

21,843

36,084

Annualized ROCE earnings

9,416

25,964

21,843

36,084

Average capital employed*

184,786

183,425

183,173

177,445

ROCE

5.1

%

14.2

%

11.9

%

20.3

%

*Capital employed is the sum of Chevron Corporation stockholders’ equity, total debt and noncontrolling interest. Average capital employed is computed by averaging the sum of capital employed at the beginning and the end of the period.

Three Months Ended
December 31,

Year Ended
December 31,

CAPEX BY SEGMENT

2023

2022

2023

2022

United States

Upstream

$

2,608

$

2,183

$

9,842

$

6,847

Downstream

418

582

1,536

1,699

Other

133

128

351

310

Total United States

3,159

2,893

11,729

8,856

International

Upstream

1,094

833

3,836

2,718

Downstream

93

93

237

375

Other

15

16

27

25

Total International

1,202

942

4,100

3,118

CAPEX

$

4,361

$

3,835

$

15,829

$

11,974

AFFILIATE CAPEX (not included above):

Upstream

$

517

$

634

$

2,310

$

2,406

Downstream

333

352

1,224

960

AFFILIATE CAPEX

$

850

$

986

$

3,534

$

3,366

Attachment 3

CHEVRON CORPORATION – FINANCIAL REVIEW

(Billions of Dollars)

(unaudited)

SUMMARIZED STATEMENT OF CASH FLOWS (Preliminary)(1)

Three Months Ended
December 31,

Year Ended
December 31,

OPERATING ACTIVITIES

2023

2022

2023

2022

Net Income (Loss)

$

2.2

$

6.4

$

21.4

$

35.6

Adjustments

Depreciation, depletion and amortization

6.3

4.8

17.3

16.3

Distributions more (less) than income from equity affiliates

1.4

(0.9

)

(4.7

)

Loss (gain) on asset retirements and sales

(0.1

)

(0.1

)

(0.6

)

Net foreign currency effects

0.7

0.2

0.6

(0.4

)

Deferred income tax provision

(1.0

)

0.4

0.3

2.1

Net decrease (increase) in operating working capital

1.0

1.0

(3.2

)

2.1

Other operating activity

1.9

(0.2

)

0.2

(0.9

)

Net Cash Provided by Operating Activities

$

12.4

$

12.5

$

35.6

$

49.6

INVESTING ACTIVITIES

Acquisition of businesses, net of cash acquired

0.1

(2.9

)

Capital expenditures (Capex)

(4.4

)

(3.8

)

(15.8

)

(12.0

)

Proceeds and deposits related to asset sales and returns of investment

0.3

0.2

0.7

2.6

Other investing activity

(0.1

)

0.1

Net Cash Used for Investing Activities

$

(4.1

)

$

(3.7

)

$

(15.2

)

$

(12.1

)

FINANCING ACTIVITIES

Net change in debt

(0.3

)

(4.1

)

(8.5

)

Cash dividends – common stock

(2.8

)

(2.7

)

(11.3

)

(11.0

)

Shares issued for share-based compensation

0.3

0.3

5.8

Shares repurchased

(3.4

)

(3.8

)

(14.9

)

(11.3

)

Distributions to noncontrolling interests

(0.1

)

Net Cash Provided by (Used for) Financing Activities

$

(6.2

)

$

(6.4

)

$

(30.1

)

$

(25.0

)

EFFECT OF EXCHANGE RATE CHANGES ON CASH, CASH EQUIVALENTS AND RESTRICTED CASH

0.1

0.1

(0.1

)

(0.2

)

NET CHANGE IN CASH, CASH EQUIVALENTS AND RESTRICTED CASH

$

2.3

$

2.4

$

(9.8

)

$

12.3

RECONCILIATION OF NON-GAAP MEASURES (1)

Net Cash Provided by Operating Activities

$

12.4

$

12.5

$

35.6

$

49.6

Less: Net decrease (increase) in operating working capital

1.0

1.0

(3.2

)

2.1

Cash Flow from Operations Excluding Working Capital

$

11.4

$

11.5

$

38.8

$

47.5

Net Cash Provided by Operating Activities

$

12.4

$

12.5

$

35.6

$

49.6

Less: Capital expenditures

4.4

3.8

15.8

12.0

Free Cash Flow

$

8.1

$

8.7

$

19.8

$

37.6

Less: Net decrease (increase) in operating working capital

1.0

1.0

(3.2

)

2.1

Free Cash Flow Excluding Working Capital

$

7.1

$

7.7

$

23.0

$

35.5

(1) Totals may not match sum of parts due to presentation in billions.

Attachment 4

CHEVRON CORPORATION – FINANCIAL REVIEW

(Millions of Dollars)

(unaudited)

RECONCILIATION OF NON-GAAP MEASURES

Three Months Ended
December 31, 2023

Three Months Ended
December 31, 2022

Year Ended
December 31, 2023

Year Ended
December 31, 2022

REPORTED EARNINGS

Pre-
Tax

Income
Tax

After-
Tax

Pre-
Tax

Income
Tax

After-
Tax

Pre-
Tax

Income
Tax

After-
Tax

Pre-
Tax

Income
Tax

After-
Tax

U.S. Upstream

$

(1,347

)

$

2,618

$

4,148

$

12,621

Int’l Upstream

2,933

2,867

13,290

17,663

U.S. Downstream

470

1,180

3,904

5,394

Int’l Downstream

677

591

2,233

2,761

All Other

(474

)

(903

)

(2,206

)

(2,974

)

Net Income (Loss) Attributable to Chevron

$

2,259

$

6,353

$

21,369

$

35,465

SPECIAL ITEMS

U.S. Upstream

Write-offs & impairments

$

(2,324

)

$

559

$

(1,765

)

$

$

$

$

(2,324

)

$

559

$

(1,765

)

$

$

$

Early contract termination

(765

)

165

(600

)

Decommissioning obligations

(2,561

)

611

(1,950

)

(2,561

)

611

(1,950

)

Int’l Upstream

Asset sale gains

328

(128

)

200

Write-offs & impairments

(813

)

(262

)

(1,075

)

(813

)

(262

)

(1,075

)

Tax items

655

655

All Other

Pension settlement costs

(21

)

4

(17

)

(53

)

13

(40

)

(352

)

81

(271

)

Total Special Items

$

(4,885

)

$

1,170

$

(3,715

)

$

(834

)

$

(258

)

$

(1,092

)

$

(4,938

)

$

1,838

$

(3,100

)

$

(1,602

)

$

(144

)

$

(1,746

)

FOREIGN CURRENCY EFFECTS

Int’l Upstream

$

(162

)

$

(83

)

$

376

$

816

Int’l Downstream

(58

)

(112

)

(12

)

235

All Other

(259

)

(210

)

(588

)

(382

)

Total Foreign Currency Effects

$

(479

)

$

(405

)

$

(224

)

$

669

ADJUSTED EARNINGS/(LOSS) *

U.S. Upstream

$

2,368

$

2,618

$

7,863

$

13,221

Int’l Upstream

3,095

4,025

12,259

17,722

U.S. Downstream

470

1,180

3,904

5,394

Int’l Downstream

735

703

2,245

2,526

All Other

(215

)

(676

)

(1,578

)

(2,321

)

Total Adjusted Earnings/(Loss)

$

6,453

$

7,850

$

24,693

$

36,542

Total Adjusted Earnings/(Loss) per share

$

3.45

$

4.09

$

13.13

$

18.83

* Adjusted Earnings/(Loss) is defined as Net Income (loss) attributable to Chevron Corporation excluding special items and foreign currency effects.


View source version on businesswire.com: https://www.businesswire.com/news/home/20240202391329/en/

The post Chevron Reports Fourth Quarter 2023 Results appeared first on Energy News Beat.


ExxonMobil Announces 2023 Results

Energy News Beat

Delivered industry-leading 2023 earnings of $36.0 billion1, generated $55.4 billion of cash flow from operating activities and distributed $32.4 billion to shareholders


Leading industry in compounded annual growth rate for earnings excl. identified items and cash flow since 2019 2


Increased Guyana and Permian production by 18% vs. 2022 and achieved record annual refinery throughput 3


Strengthened portfolio with $4.1 billion of non-core asset divestments, and two acquisitions; one that accelerates Low Carbon Solutions and one that will transform the Upstream business4


Launched new MobilTM Lithium business with the potential to supply up to one million EVs per year by 2030

SPRING, Texas, Feb. 02 /BusinessWire/ — Exxon Mobil Corporation (NYSE:XOM):


Results Summary

4Q23

3Q23

Change

vs

3Q23

4Q22

Change

vs

4Q22

Dollars in millions (except per share data)

2023

2022

Change

vs

2022

7,630

9,070

-1,440

12,750

-5,120

Earnings (U.S. GAAP)

36,010

55,740

-19,730

9,963

9,117

+846

14,035

-4,072

Earnings Excluding Identified Items (non-GAAP)

38,572

59,101

-20,529

1.91

2.25

-0.34

3.09

-1.18

Earnings Per Common Share ⁵

8.89

13.26

-4.37

2.48

2.27

+0.21

3.40

-0.92

Earnings Excl. Identified Items Per Common Share ⁵

(non-GAAP)

9.52

14.06

-4.54

7,757

6,022

+1,735

7,463

+294

Capital and Exploration Expenditures

26,325

22,704

+3,621

Exxon Mobil Corporation today announced fourth-quarter 2023 earnings of $7.6 billion, or $1.91 per share assuming dilution. Fourth-quarter results included unfavorable identified items of $2.3 billion including a $2.0 billion impairment as a result of regulatory obstacles in California that have prevented production and distribution assets from coming back online. Impairments were partly offset by favorable tax and divestment-related items. Earnings excluding identified items were $10.0 billion, or $2.48 per share assuming dilution. For the full year 2023, the company reported earnings of $36.0 billion, or $8.89 per share assuming dilution.

“Our consistent strategy and execution excellence across the business delivered industry-leading earnings and enabled us to return more cash to shareholders than our peers in 2023 1,” said Darren Woods, chairman and chief executive officer.

“These results demonstrate the fundamental improvements we’ve made to our business, reflecting our progress in high-grading our portfolio through investments in advantaged projects and select divestments, while, at the same time, driving a higher level of efficiency and effectiveness throughout the business. The foundation of our success comes from the resiliency, hard work and commitment of our people. As I reflect on our industry-leading results over the past year, I have a great sense of pride in what our people accomplished.”

1

Reported earnings, share buybacks and total dividends paid measured for 2023. 2023 figures for the industry peer group are actuals for companies that reported results on or before February 1, 2024, or estimated using either Bloomberg consensus as of February 1st or company-announced programs for share buybacks. Shareholder distributions is defined as dividends and share purchases. Industry peer group includes BP, Chevron, Shell and TotalEnergies.

2

Adjusted net income and cash flow from operations sourced from Bloomberg for the industry peer group. 2023 figures for the industry peer group are actuals for companies that reported results on or before February 1, 2024, or estimated using Bloomberg consensus as of February 1st. Industry peer group includes BP, Chevron, Shell and TotalEnergies.

3

Best-ever annual global refining throughput (2000 – 2023) since Exxon and Mobil merger in 1999, based on current refinery circuit.

4

Announced agreement to merge with Pioneer Natural Resources in October 2023. Transaction is expected to close in the second quarter of 2024, pending regulatory and Pioneer shareholder approval.

5

Assuming dilution.

Financial Highlights

Fourth-quarter earnings were $7.6 billion versus $9.1 billion in the third quarter. Identified items decreased earnings by $2.3 billion mainly from asset impairments, partly offset by favorable tax and divestment-related items. Earnings excluding identified items were $10.0 billion, an increase of $0.8 billion from the third-quarter. Results strengthened on favorable derivative mark-to-market impacts, improved volume and mix driven by advantaged Guyana and Permian assets, and stronger chemical margins. These factors were partly offset by lower industry refining margins and seasonally higher expenses.

Delivered full-year 2023 earnings of $36.0 billion and return on capital employed of 15%.

Achieved $9.7 billion of cumulative structural cost savings in 2023 versus 2019, exceeding the $9 billion plan with an additional $2.3 billion of savings during the year and $0.7 billion during the quarter. The company plans to deliver cumulative savings totaling $15 billion through the end of 2027.

Generated strong cash flow from operations of $13.7 billion and free cash flow of $8.0 billion in the fourth quarter. For the full year, cash increased $1.9 billion with free cash flow of $36.1 billion. Peer-leading1 2023 shareholder distributions of $32.4 billion included $14.9 billion of dividends, and $17.4 billion of share repurchases consistent with announced plans.

The Corporation declared a first-quarter dividend of $0.95 per share, payable on March 11, 2024, to shareholders of record of Common Stock at the close of business on February 14, 2024. Including the 4% increase in fourth-quarter dividend, the company has increased its annual dividend for a peer-leading1 41 consecutive years.

The debt-to-capital ratio was 16%, and the net-debt-to-capital ratio was 5%, reflecting a period-end cash balance of $31.6 billion.

The company continued to strengthen its portfolio with the closing of the East Texas upstream assets divestment in the fourth quarter. Total asset sales and divestments generated $4.1 billion of cash proceeds during the year.

Capital and exploration expenditures were $7.8 billion in the fourth quarter, bringing full-year 2023 expenditures to $26.3 billion, slightly above the top end of the guidance range, as the company opportunistically accelerated activities in the advantaged Permian and Guyana assets, and entered a new lithium business.

1

Share buybacks and total dividends paid measured for 2023. 2023 figures for the industry peer group are actuals for companies that reported results on or before February 1, 2024, or estimated using either Bloomberg consensus as of February 1st or company-announced programs for share buybacks. Shareholder distributions is defined as dividends and share purchases. Industry peer group includes BP, Chevron, Shell and TotalEnergies.

ADVANCING CLIMATE SOLUTIONS

Progress Toward Net Zero

In the Permian Basin, ExxonMobil made great progress on the plan to achieve net zero GHG emissions by 2030. In 2023, the company electrified all of its drilling fleet and replaced over 6,000 natural-gas-driven pneumatic devices in its unconventional operated assets. In addition, ExxonMobil also deployed its first electric fracturing units to further reduce emissions intensity, and signed additional long-term agreements enabling renewable power capacity to support operations. In the quarter, the company also launched a high-altitude monitoring balloon with advanced imaging technology and data processing platforms that has the potential to provide continuous, real-time methane detection. These efforts support ExxonMobil’s industry-leading plans to achieve net-zero Scope 1 and 2 emissions from its unconventional operations in the Permian by 2030.

Lithium

In the fourth quarter, ExxonMobil announced its new MobilTM Lithium business with plans to become a leading producer and grow U.S.-based supplies of lithium for the global battery and EV markets. The company’s advanced production approach has the potential to produce vast supplies of lithium with fewer environmental impacts than traditional mining operations1. Work is underway for the first phase of lithium production in southwest Arkansas, an area known to hold significant lithium deposits.

The company is planning first production for 2027. By 2030, ExxonMobil aims to produce enough MobilTM Lithium with the potential to supply approximately one million EVs per year.

Carbon Capture and Storage

In November, ExxonMobil completed the acquisition of Denbury, Inc. for $4.8 billion of ExxonMobil stock, based on the share price at closing2. The company now has the largest owned and operated carbon dioxide (CO2) pipeline network in the United States at 1,300 miles, including nearly 925 miles in Louisiana, Texas and Mississippi, one of the largest U.S. markets for CO2 emissions. The company also has access to more than 15 strategically located onshore CO2 storage sites.

1

Expected smaller footprint of lithium mining and expected lower carbon and water impacts: EM analysis of external sources and third party life-cycle analyses. 1) Vulcan Energy, 2022 https://v-er.eu/app/uploads/2023/11/LCA.pdf, Minviro publication. Grant, A., Deak, D., & Pell, R. (2020). 2) The CO2 Impact of the 2020s Battery Quality Lithium Hydroxide Supply Chain-Jade Cove Partners. https://www.jadecove.com/research/liohco2impact. Kelly, J. C., Wang, M., Dai, Q., & Winjobi, O. (2021). 3) Energy, greenhouse gas, and water life cycle analysis of lithium carbonate and lithium hydroxide monohydrate from brine and ore resources and their use in lithium ion battery cathodes and lithium ion batteries. Resources, Conservation and Recycling, 174, 105762.

2

Total consideration of $5.1 billion includes ExxonMobil stock of $4.8 billion and cash payments of $0.3 billion related to repayment of Denbury’s credit facility and settlement of fractional shares.

EARNINGS AND VOLUME SUMMARY BY SEGMENT

Upstream

4Q23

3Q23

4Q22

Dollars in millions (unless otherwise noted)

2023

2022

Earnings/(Loss) (U.S. GAAP)

84

1,566

2,493

United States

4,202

11,728

4,065

4,559

5,708

Non-U.S.

17,106

24,751

4,149

6,125

8,201

Worldwide

21,308

36,479

Earnings/(Loss) Excluding Identified Items (non-GAAP)

1,573

1,566

2,493

United States

5,691

11,429

4,693

4,573

6,269

Non-U.S.

17,918

27,989

6,266

6,139

8,762

Worldwide

23,609

39,418

3,824

3,688

3,822

Production (koebd)

3,738

3,737

Upstream fourth-quarter earnings were $4.1 billion, a decrease of $2.0 billion from the third quarter. Identified items reduced earnings by $2.1 billion this quarter, mainly from the impairment of the idled Santa Ynez Unit assets in California due to regulatory challenges restarting production and distribution. Earnings excluding identified items were $6.3 billion, an increase of $127 million. Higher volumes and improved mix, mainly from Guyana and Permian growth, and stronger gas realizations more than offset lower crude realizations, unfavorable tax impacts, and year-end inventory effects.

Net production in the fourth quarter was 3.8 million oil-equivalent barrels per day, an increase of 136,000 oil-equivalent barrels per day compared to the prior quarter on favorable entitlement effects and growth in Permian and Guyana. Payara, the third Guyana development, started up in November ahead of schedule with production reaching nameplate capacity of 220,000 barrels per day in mid-January.

Compared to the same quarter last year, earnings decreased $4.1 billion. Identified items reduced earnings by $2.1 billion this quarter, compared to a reduction of $0.6 billion in the fourth quarter of 2022. Earnings excluding identified items were $6.3 billion, a decrease of $2.5 billion, primarily due to lower natural gas prices. Higher Permian and Guyana volumes and less unfavorable year-end inventory effects provided a partial offset. Net production was flat compared to the same quarter last year. Excluding the impacts from divestments, entitlements, and government-mandated curtailments, net production grew about 70,000 oil-equivalent barrels per day.

Full-year earnings were $21.3 billion, $15.2 billion less than 2022. Identified items for the year reduced earnings by $2.3 billion, compared to an unfavorable $2.9 billion impact last year. Excluding identified items, earnings decreased $15.8 billion on lower liquids and natural gas realizations, and unfavorable unsettled derivatives mark-to-market effects of $2.4 billion, primarily from the absence of favorable impacts in the prior year. Higher volume contributions from improved portfolio mix added nearly $1 billion, as growth from Guyana and Permian more than offset divestments. Net production in 2023 was 3.7 million oil-equivalent barrels per day, in line with prior year. Production increased 111,000 oil-equivalent barrels per day, excluding impacts from divestments, entitlements, and government-mandated curtailments. Permian and Guyana combined production grew 18% versus 2022.

In October, ExxonMobil announced an agreement to merge with Pioneer Natural Resources in a $59.5 billion all-stock transaction1. The combination is expected to generate double-digit returns by recovering more resources, more efficiently, while accelerating emissions reductions2. The transaction is expected to close in the second quarter of 2024, pending regulatory and Pioneer shareholder approval.

1

Based on the October 5, 2023 closing price for ExxonMobil shares and the fixed exchange rate of 2.3234 per Pioneer share.

2

Expected to leverage Permian GHG reduction plans to accelerate Pioneer’s net-zero emissions plan to 2035 from 2050; plan to lower both companies’ Permian methane emissions through new technology application.

Energy Products

4Q23

3Q23

4Q22

Dollars in millions (unless otherwise noted)

2023

2022

Earnings/(Loss) (U.S. GAAP)

1,329

1,356

2,188

United States

6,123

8,340

1,878

1,086

1,882

Non-U.S.

6,019

6,626

3,207

2,442

4,070

Worldwide

12,142

14,966

Earnings/(Loss) Excluding Identified Items (non-GAAP)

1,137

1,356

2,246

United States

5,931

8,398

1,881

1,119

2,508

Non-U.S.

6,067

7,252

3,018

2,475

4,754

Worldwide

11,998

15,650

5,357

5,551

5,423

Energy Products Sales (kbd)

5,461

5,347

Energy Products fourth-quarter earnings totaled $3.2 billion compared to $2.4 billion in the third quarter, an increase of $765 million. A favorable derivatives mark-to-market impact of $1.2 billion and the unwinding of prior quarter unfavorable timing effects more than offset weaker seasonal industry refining margins. Results also improved from favorable tax, year-end inventory impacts, and foreign exchange effects. These factors were partly offset by higher seasonal expenses and lower volumes from higher scheduled maintenance and divestments. Identified items increased earnings by $222 million versus the third quarter. Earnings excluding these items were $3.0 billion for the quarter, an increase of $543 million from the third quarter.

Compared to the fourth quarter last year, earnings decreased $863 million on weaker industry refining margins and higher project-related expenses, partly offset by favorable derivatives mark-to-market effects. Identified items improved earnings by $873 million mainly from lower additional European taxes on the energy sector and the absence of asset impairments. Earnings excluding these identified items were $3.0 billion, $1.7 billion lower than the fourth quarter last year.

Full-year 2023 earnings were $12.1 billion, a decrease of $2.8 billion versus 2022 due to the decline in industry refining margins, higher planned maintenance activities and divestments. These factors were partly offset by stronger trading and marketing margins and higher sales volumes from strong reliability and the start-up of the Beaumont refinery expansion. Identified items improved earnings by $828 million mainly from lower additional European taxes on the energy sector and the absence of asset impairments. Earnings excluding identified items were $12.0 billion, a decrease of $3.7 billion from last year.

Refining throughput for the year was 4.1 million barrels per day, up 38,000 barrels per day from 2022. The record throughput on a current refinery circuit basis was supported by strong reliability and the completion of the 250,000 barrels per day Beaumont refinery expansion in the first quarter of 2023. In addition, with the December completion of the 1.5 million barrels per day strategic Permian crude venture project, both the Beaumont and Baytown refineries have expanded access to advantaged Permian feedstocks.

Chemical Products

4Q23

3Q23

4Q22

Dollars in millions (unless otherwise noted)

2023

2022

Earnings/(Loss) (U.S. GAAP)

478

338

298

United States

1,626

2,328

(289)

(89)

(48)

Non-U.S.

11

1,215

189

249

250

Worldwide

1,637

3,543

Earnings/(Loss) Excluding Identified Items (non-GAAP)

446

338

298

United States

1,594

2,328

131

(89)

(48)

Non-U.S.

431

1,215

577

249

250

Worldwide

2,025

3,543

4,776

5,108

4,658

Chemical Products Sales (kt)

19,382

19,167

Chemical Products fourth-quarter earnings were $189 million compared to $249 million in the third quarter. Identified items mainly associated with asset impairments and other financial reserves reduced earnings by $388 million. Earnings excluding identified items were $577 million for the quarter, an increase of $328 million from the third quarter. Margins improved from lower U.S. feed costs and strong performance product sales. Lower overall seasonal sales were partly offset by new volumes from the recently completed Baytown expansion.

Current quarter earnings were $61 million lower compared to fourth-quarter 2022. Identified items mainly associated with asset impairments and other financial reserves reduced earnings by $388 million. Earnings excluding identified items were $577 million, $327 million higher on improved margins from lower feed costs.

Full-year earnings were $1.6 billion, a decrease of $1.9 billion versus 2022. Lower earnings reflect the overall weaker margin environment from bottom-of-cycle market conditions, higher planned maintenance, and unfavorable sales mix effects. Identified items reduced earnings by $388 million. Earnings excluding identified items were $2.0 billion, a decrease of $1.5 billion from 2022.

Specialty Products

4Q23

3Q23

4Q22

Dollars in millions (unless otherwise noted)

2023

2022

Earnings/(Loss) (U.S. GAAP)

386

326

406

United States

1,536

1,190

264

293

354

Non-U.S.

1,178

1,225

650

619

760

Worldwide

2,714

2,415

Earnings/(Loss) Excluding Identified Items (non-GAAP)

374

326

406

United States

1,524

1,190

369

293

394

Non-U.S.

1,283

1,265

743

619

800

Worldwide

2,807

2,455

1,839

1,912

1,787

Specialty Products Sales (kt)

7,597

7,810

Specialty Products continued to deliver strong earnings from high-value products. Fourth-quarter earnings were $650 million, compared to $619 million in the third quarter. Higher margins from improved realizations and lower feed costs, and positive year-end inventory impacts were partly offset by higher seasonal expenses and lower sales volumes. Identified items reduced earnings by $93 million in the quarter.

Compared to the same quarter last year, earnings decreased by $110 million. Weaker basestock margins were mostly offset by favorable year-end inventory impacts, improved reliability and stronger finished lubes margins.

Full-year earnings were $2.7 billion, an increase of $299 million compared with 2022 as product differentiation and brand strength drove sustained business performance. Improved finished lubes margins more than offset lower basestock margins and specialty products sales volumes due to weaker global demand.

Corporate and Financing

4Q23

3Q23

4Q22

Dollars in millions (unless otherwise noted)

2023

2022

(565)

(365)

(531)

Earnings/(Loss) (U.S. GAAP)

(1,791)

(1,663)

(641)

(365)

(531)

Earnings/(Loss) Excluding Identified Items (non-GAAP)

(1,867)

(1,965)

Corporate and Financing fourth-quarter net charges of $565 million increased $200 million versus the third quarter driven by unfavorable foreign exchange impacts, partly offset by tax-related identified items.

Net charges of $565 million in the fourth quarter of 2023 increased $34 million from the same quarter of 2022.

Full-year net charges of $1.8 billion increased $128 million from 2022 mainly due to the absence of prior year favorable tax-related and other identified items, partly offset by lower financing costs.

CASH FLOW FROM OPERATIONS AND ASSET SALES EXCLUDING WORKING CAPITAL

4Q23

3Q23

4Q22

Dollars in millions (unless otherwise noted)

2023

2022

8,012

9,346

13,055

Net income/(loss) including noncontrolling interests

37,354

57,577

7,740

4,415

5,064

Depreciation and depletion (includes impairments)

20,641

24,040

(2,191)

1,821

(200)

Changes in operational working capital, excluding cash and debt

(4,255)

(194)

121

381

(298)

Other

1,629

(4,626)

13,682

15,963

17,621

Cash Flow from Operating Activities (U.S. GAAP)

55,369

76,797

1,020

917

1,333

Proceeds from asset sales and returns of investments

4,078

5,247

14,702

16,880

18,954

Cash Flow from Operations and Asset Sales (non-GAAP)

59,447

82,044

2,191

(1,821)

200

Less: Changes in operational working capital, excluding cash and debt

4,255

194

16,893

15,059

19,154

Cash Flow from Operations and Asset Sales excluding Working Capital

(non-GAAP)

63,702

82,238

FREE CASH FLOW

4Q23

3Q23

4Q22

Dollars in millions (unless otherwise noted)

2023

2022

13,682

15,963

17,621

Cash Flow from Operating Activities (U.S. GAAP)

55,369

76,797

(6,228)

(4,920)

(5,783)

Additions to property, plant and equipment

(21,919)

(18,407)

(1,854)

(307)

(2,175)

Additional investments and advances

(2,995)

(3,090)

1,348

31

1,270

Other investing activities including collection of advances

1,562

1,508

1,020

917

1,333

Proceeds from asset sales and returns of investments

4,078

5,247

7,968

11,684

12,266

Free Cash Flow (non-GAAP)

36,095

62,055

RETURN ON AVERAGE CAPITAL EMPLOYED

Dollars in millions (unless otherwise noted)

2023

2022

Net income/(loss) attributable to ExxonMobil (U.S. GAAP)

36,010

55,740

Financing costs (after-tax)

Gross third-party debt

(1,175)

(1,213)

ExxonMobil share of equity companies

(307)

(198)

All other financing costs – net

931

276

Total financing costs

(551)

(1,135)

Earnings/(loss) excluding financing costs (non-GAAP)

36,561

56,875

Total assets (U.S. GAAP)

376,317

369,067

Less liabilities and noncontrolling interests share of assets and liabilities

Total current liabilities excluding notes and loans payable

(61,226)

(68,411)

Total long-term liabilities excluding long-term debt

(60,980)

(56,990)

Noncontrolling interests share of assets and liabilities

(8,878)

(9,205)

Add ExxonMobil share of debt-financed equity company net assets

3,481

3,705

Total capital employed (non-GAAP)

248,714

238,166

Average capital employed (non-GAAP)

243,440

228,404

Return on average capital employed – corporate total (non-GAAP)

15.0%

24.9%

CALCULATION OF STRUCTURAL COST SAVINGS

Dollars in billions

2019

2023

Components of Operating Costs

From ExxonMobil’s Consolidated Statement of Income

(U.S. GAAP)

Production and manufacturing expenses

36.8

36.9

Selling, general and administrative expenses

11.4

9.9

Depreciation and depletion (includes impairments)

19.0

20.6

Exploration expenses, including dry holes

1.3

0.8

Non-service pension and postretirement benefit expense

1.2

0.7

Subtotal

69.7

68.9

ExxonMobil’s share of equity company expenses (non-GAAP)

9.1

10.5

Total Adjusted Operating Costs (non-GAAP)

78.8

79.4

Total Adjusted Operating Costs (non-GAAP)

78.8

79.4

Less:

Depreciation and depletion (includes impairments)

19.0

20.6

Non-service pension and postretirement benefit expense

1.2

0.7

Other adjustments (includes equity company depreciation

and depletion)

3.6

3.7

Total Cash Operating Expenses (Cash Opex) (non-GAAP)

55.0

54.4

Energy and production taxes (non-GAAP)

11.0

14.9

Market

Activity /

Other

Structural

Savings

Total Cash Operating Expenses (Cash Opex) excluding Energy and Production Taxes (non-GAAP)

44.0

+3.6

+1.6

-9.7

39.5

This press release also references structural cost savings. Structural cost savings describe decreases in cash opex excluding energy and production taxes as a result of operational efficiencies, workforce reductions, and other cost-saving measures that are expected to be sustainable compared to 2019 levels. Relative to 2019, estimated cumulative structural cost savings totaled $9.7 billion, which included an additional $2.3 billion in 2023. The total change between periods in expenses above will reflect both structural cost savings and other changes in spend, including market factors, such as inflation and foreign exchange impacts, as well as changes in activity levels and costs associated with new operations. Estimates of cumulative annual structural savings may be revised depending on whether cost reductions realized in prior periods are determined to be sustainable compared to 2019 levels. Structural cost savings are stewarded internally to support management’s oversight of spending over time. This measure is useful for investors to understand the Corporation’s efforts to optimize spending through disciplined expense management.

ExxonMobil will discuss financial and operating results and other matters during a webcast at 7:30 a.m. Central Time on February 2, 2024. To listen to the event or access an archived replay, please visit www.exxonmobil.com.

Important Information about the Pioneer Transaction and Where to Find It

In connection with the proposed transaction between Exxon Mobil Corporation (“ExxonMobil”) and Pioneer Natural Resources Company (“Pioneer”), ExxonMobil and Pioneer have filed and will file relevant materials with the Securities and Exchange Commission (the “SEC”). On November 21, 2023, ExxonMobil filed with the SEC a registration statement on Form S-4 (the “Form S-4”) to register the shares of ExxonMobil common stock to be issued in connection with the proposed transaction. The Form S-4 includes a proxy statement of Pioneer that also constitutes a prospectus of ExxonMobil. The information in the Form S-4 is not complete and may be changed. After the Form S-4 is declared effective, a definitive proxy statement/prospectus will be mailed to stockholders of Pioneer.

This communication is not a substitute for the Form S-4, proxy statement or prospectus or any other document that ExxonMobil or Pioneer (as applicable) has filed or may file with the SEC in connection with the proposed transaction.

BEFORE MAKING ANY VOTING OR INVESTMENT DECISION, INVESTORS AND SECURITY HOLDERS OF EXXONMOBIL AND PIONEER ARE URGED TO READ THE FORM S-4, THE PROXY STATEMENT/PROSPECTUS AND ANY OTHER RELEVANT DOCUMENTS THAT ARE FILED OR WILL BE FILED WITH THE SEC, AS WELL AS ANY AMENDMENTS OR SUPPLEMENTS TO THESE DOCUMENTS, CAREFULLY AND IN THEIR ENTIRETY WHEN THEY BECOME AVAILABLE BECAUSE THEY CONTAIN OR WILL CONTAIN IMPORTANT INFORMATION ABOUT THE PROPOSED TRANSACTION AND RELATED MATTERS.

Investors and security holders may obtain free copies of the Form S-4 and the proxy statement/prospectus (when they become available), as well as other filings containing important information about ExxonMobil or Pioneer, without charge at the SEC’s Internet website (http://www.sec.gov). Copies of the documents filed with the SEC by ExxonMobil are and will be available free of charge on ExxonMobil’s internet website at www.exxonmobil.com under the tab “investors” and then under the tab “SEC Filings” or by contacting ExxonMobil’s Investor Relations Department at [email protected]. Copies of the documents filed with the SEC by Pioneer will be available free of charge on Pioneer’s internet website at https://investors.pxd.com/investors/financials/sec-filings/. The information included on, or accessible through, ExxonMobil’s or Pioneer’s website is not incorporated by reference into this communication.

Participants in the Solicitation

ExxonMobil, Pioneer, their respective directors and certain of their respective executive officers may be deemed to be participants in the solicitation of proxies in respect of the proposed transaction. Information about the directors and executive officers of Pioneer and a description of their direct or indirect interests, by security holdings or otherwise, is set forth in the Form S-4, including the documents incorporated by reference therein. Information about the directors and executive officers of ExxonMobil is set forth in its proxy statement for its 2023 annual meeting of stockholders, which was filed with the SEC on April 13, 2023, in its Form 10-K for the year ended December 31, 2022, which was filed with the SEC on February 22, 2023, in its Form 8-K filed on June 6, 2023 and in its Form 8-K filed on February 24, 2023. Additional information regarding the participants in the proxy solicitations and a description of their direct or indirect interests, by security holdings or otherwise, are contained in the proxy statement/prospectus and will be contained in other relevant materials filed with the SEC when they become available.

No Offer or Solicitation

This communication is for informational purposes and is not intended to, and shall not, constitute an offer to sell or the solicitation of an offer to buy any securities or a solicitation of any vote or approval, nor shall there be any offer, solicitation or sale of securities in any jurisdiction in which such offer, solicitation or sale would be unlawful prior to registration or qualification under the securities laws of any such jurisdiction. No offering of securities shall be made except by means of a prospectus meeting the requirements of Section 10 of the U.S. Securities Act of 1933, as amended.

Cautionary Statement

Statements related to future events; projections; descriptions of strategic, operating, and financial plans and objectives; statements of future ambitions and plans; and other statements of future events or conditions in this release, are forward-looking statements. Similarly, discussion of future carbon capture, transportation and storage, as well as biofuels, hydrogen and other plans to reduce emissions of ExxonMobil, its affiliates or companies it is seeking to acquire, are dependent on future market factors, such as continued technological progress, policy support and timely rule-making and permitting, and represent forward-looking statements. Actual future results, including financial and operating performance; potential earnings, cash flow, or rate of return; total capital expenditures and mix, including allocations of capital to low carbon investments; realization and maintenance of structural cost reductions and efficiency gains, including the ability to offset inflationary pressure; plans to reduce future emissions and emissions intensity; ambitions to reach Scope 1 and Scope 2 net zero from operated assets by 2050, to reach Scope 1 and 2 net zero in Upstream Permian Basin unconventional operated assets by 2030 and in Pioneer Permian assets by 2035, to eliminate routine flaring in-line with World Bank Zero Routine Flaring, to reach near-zero methane emissions from its operated assets and other methane initiatives, to meet ExxonMobil’s emission reduction goals and plans, divestment and start-up plans, and associated project plans as well as technology advances, including the timing and outcome of projects to capture and store CO2, produce hydrogen, produce biofuels, produce lithium and use plastic waste as feedstock for advanced recycling; changes in law, taxes, or regulation including environmental and tax regulations, trade sanctions, and timely granting of governmental permits and certifications; cash flow, dividends and shareholder returns, including the timing and amounts of share repurchases; future debt levels and credit ratings; business and project plans, timing, costs, capacities and returns; resource recoveries and production rates; and planned Pioneer and Denbury integrated benefits, could differ materially due to a number of factors. These include global or regional changes in the supply and demand for oil, natural gas, petrochemicals, and feedstocks and other market factors, economic conditions and seasonal fluctuations that impact prices and differentials for our products; government policies supporting lower carbon investment opportunities such as the U.S. Inflation Reduction Act or policies limiting the attractiveness of future investment such as the additional European taxes on the energy sector and unequal support for different methods of emissions reduction; variable impacts of trading activities on our margins and results each quarter; actions of competitors and commercial counterparties; the outcome of commercial negotiations, including final agreed terms and conditions; the ability to access debt markets; the ultimate impacts of public health crises, including the effects of government responses on people and economies; reservoir performance, including variability and timing factors applicable to unconventional resources; the level and outcome of exploration projects and decisions to invest in future reserves; timely completion of development and other construction projects; final management approval of future projects and any changes in the scope, terms, or costs of such projects as approved; government regulation of our growth opportunities; war, civil unrest, attacks against the company or industry and other political or security disturbances; expropriations, seizure, or capacity, insurance or shipping limitations by foreign governments or laws; opportunities for potential acquisitions, investments or divestments and satisfaction of applicable conditions to closing, including timely regulatory approvals; the capture of efficiencies within and between business lines and the ability to maintain near-term cost reductions as ongoing efficiencies; unforeseen technical or operating difficulties and unplanned maintenance; the development and competitiveness of alternative energy and emission reduction technologies; the results of research programs and the ability to bring new technologies to commercial scale on a cost-competitive basis; and other factors discussed under Item 1A. Risk Factors of ExxonMobil’s 2022 Form 10-K.

Actions needed to advance ExxonMobil’s 2030 greenhouse gas emission-reductions plans are incorporated into its medium-term business plans, which are updated annually. The reference case for planning beyond 2030 is based on the Company’s Global Outlook research and publication. The Outlook is reflective of the existing global policy environment and an assumption of increasing policy stringency and technology improvement to 2050. However, the Global Outlook does not attempt to project the degree of required future policy and technology advancement and deployment for the world, or ExxonMobil, to meet net zero by 2050. As future policies and technology advancements emerge, they will be incorporated into the Outlook, and the Company’s business plans will be updated accordingly. References to projects or opportunities may not reflect investment decisions made by the corporation or its affiliates. Individual projects or opportunities may advance based on a number of factors, including availability of supportive policy, permitting, technological advancement for cost-effective abatement, insights from the company planning process, and alignment with our partners and other stakeholders. Capital investment guidance in lower-emission investments is based on our corporate plan; however, actual investment levels will be subject to the availability of the opportunity set, public policy support, and focused on returns.

Forward-looking and other statements regarding environmental and other sustainability efforts and aspirations are not an indication that these statements are material to investors or requiring disclosure in our filing with the SEC. In addition, historical, current, and forward-looking environmental and other sustainability-related statements may be based on standards for measuring progress that are still developing, internal controls and processes that continue to evolve, and assumptions that are subject to change in the future, including future rule-making. The release is provided under consistent SEC disclosure requirements and should not be misinterpreted as applying to any other disclosure standards.

Frequently Used Terms and Non-GAAP Measures

This press release includes cash flow from operations and asset sales (non-GAAP). Because of the regular nature of our asset management and divestment program, the company believes it is useful for investors to consider proceeds associated with the sales of subsidiaries, property, plant and equipment, and sales and returns of investments together with cash provided by operating activities when evaluating cash available for investment in the business and financing activities. A reconciliation to net cash provided by operating activities for the 2022 and 2023 periods is shown on page 8.

This press release also includes cash flow from operations and asset sales excluding working capital (non-GAAP). The company believes it is useful for investors to consider these numbers in comparing the underlying performance of the company’s business across periods when there are significant period-to-period differences in the amount of changes in working capital. A reconciliation to net cash provided by operating activities for the 2022 and 2023 periods is shown on page 8.

This press release also includes Earnings/(Loss) Excluding Identified Items (non-GAAP), which are earnings/(loss) excluding individually significant non-operational events with, typically, an absolute corporate total earnings impact of at least $250 million in a given quarter. The earnings/(loss) impact of an identified item for an individual segment may be less than $250 million when the item impacts several periods or several segments. Earnings/(loss) excluding Identified Items does include non-operational earnings events or impacts that are generally below the $250 million threshold utilized for identified items. When the effect of these events is significant in aggregate, it is indicated in analysis of period results as part of quarterly earnings press release and teleconference materials. Management uses these figures to improve comparability of the underlying business across multiple periods by isolating and removing significant non-operational events from business results. The Corporation believes this view provides investors increased transparency into business results and trends and provides investors with a view of the business as seen through the eyes of management. Earnings excluding Identified Items is not meant to be viewed in isolation or as a substitute for net income/(loss) attributable to ExxonMobil as prepared in accordance with U.S. GAAP. A reconciliation to earnings is shown for 2023 and 2022 periods in Attachments II-a and II-b. Corresponding per share amounts are shown on page 1 and in Attachment II-a, including a reconciliation to earnings/(loss) per common share – assuming dilution (U.S. GAAP).

This press release also includes total taxes including sales-based taxes. This is a broader indicator of the total tax burden on the Corporation’s products and earnings, including certain sales and value-added taxes imposed on and concurrent with revenue-producing transactions with customers and collected on behalf of governmental authorities (“sales-based taxes”). It combines “Income taxes” and “Total other taxes and duties” with sales-based taxes, which are reported net in the income statement. The company believes it is useful for the Corporation and its investors to understand the total tax burden imposed on the Corporation’s products and earnings. A reconciliation to total taxes is shown in Attachment I-a.

This press release also references free cash flow (non-GAAP). Free cash flow is the sum of net cash provided by operating activities and net cash flow used in investing activities. This measure is useful when evaluating cash available for financing activities, including shareholder distributions, after investment in the business. Free cash flow is not meant to be viewed in isolation or as a substitute for net cash provided by operating activities. A reconciliation to net cash provided by operating activities for the 2022 and 2023 periods is shown on page 8.

References to resources or resource base may include quantities of oil and natural gas classified as proved reserves, as well as quantities that are not yet classified as proved reserves, but that are expected to be ultimately recoverable. The term “resource base” or similar terms are not intended to correspond to SEC definitions such as “probable” or “possible” reserves. A reconciliation of production excluding divestments, entitlements, and government mandates to actual production is contained in the Supplement to this release included as Exhibit 99.2 to the Form 8-K filed the same day as this news release.

The term “project” as used in this news release can refer to a variety of different activities and does not necessarily have the same meaning as in any government payment transparency reports. Projects or plans may not reflect investment decisions made by the company. Individual opportunities may advance based on a number of factors, including availability of supportive policy, technology for cost-effective abatement, and alignment with our partners and other stakeholders. The company may refer to these opportunities as projects in external disclosures at various stages throughout their progression.

Government mandates are changes to ExxonMobil’s sustainable production levels as a result of production limits or sanctions imposed by governments.

Compound annual growth rate (CAGR) represents the consistent rate at which an investment or business result would have grown had the investment or business result compounded at the same rate each year.

Debt-to-capital ratio is total debt divided by the sum of total debt and equity. Total debt is the sum of notes and loans payable and long-term debt, as reported in the consolidated balance sheet, along with total equity.

Net-debt-to-capital ratio is net debt divided by the sum of net debt and total equity, where net debt is net of cash and cash equivalents, excluding restricted cash.

This press release also references structural cost savings, for more details see page 9.

Reference to Earnings

References to corporate earnings mean net income attributable to ExxonMobil (U.S. GAAP) from the consolidated income statement. Unless otherwise indicated, references to earnings, Upstream, Energy Products, Chemical Products, Specialty Products and Corporate and Financing earnings, and earnings per share are ExxonMobil’s share after excluding amounts attributable to noncontrolling interests.

Exxon Mobil Corporation has numerous affiliates, many with names that include ExxonMobil, Exxon, Mobil, Esso, and XTO. For convenience and simplicity, those terms and terms such as Corporation, company, our, we, and its are sometimes used as abbreviated references to specific affiliates or affiliate groups. Similarly, ExxonMobil has business relationships with thousands of customers, suppliers, governments, and others. For convenience and simplicity, words such as venture, joint venture, partnership, co-venturer, and partner are used to indicate business and other relationships involving common activities and interests, and those words may not indicate precise legal relationships. ExxonMobil’s ambitions, plans and goals do not guarantee any action or future performance by its affiliates or Exxon Mobil Corporation’s responsibility for those affiliates’ actions and future performance, each affiliate of which manages its own affairs.

Throughout this press release, both Exhibit 99.1 as well as Exhibit 99.2, due to rounding, numbers presented may not add up precisely to the totals indicated.

ATTACHMENT I-a

CONDENSED CONSOLIDATED STATEMENT OF INCOME

(Preliminary)

Dollars in millions (unless otherwise noted)

Three Months Ended December 31,

Twelve Months Ended

December 31,

2023

2022

2023

2022

Revenues and other income

Sales and other operating revenue

81,688

93,164

334,697

398,675

Income from equity affiliates

1,165

605

6,385

11,463

Other income

1,491

1,660

3,500

3,542

Total revenues and other income

84,344

95,429

344,582

413,680

Costs and other deductions

Crude oil and product purchases

46,352

50,761

193,029

228,959

Production and manufacturing expenses

9,893

10,365

36,885

42,609

Selling, general and administrative expenses

2,591

2,832

9,919

10,095

Depreciation and depletion (includes impairments)

7,740

5,064

20,641

24,040

Exploration expenses, including dry holes

139

348

751

1,025

Non-service pension and postretirement benefit expense

217

100

714

482

Interest expense

272

207

849

798

Other taxes and duties

6,515

6,910

29,011

27,919

Total costs and other deductions

73,719

76,587

291,799

335,927

Income/(Loss) before income taxes

10,625

18,842

52,783

77,753

Income tax expense/(benefit)

2,613

5,787

15,429

20,176

Net income/(loss) including noncontrolling interests

8,012

13,055

37,354

57,577

Net income/(loss) attributable to noncontrolling interests

382

305

1,344

1,837

Net income/(loss) attributable to ExxonMobil

7,630

12,750

36,010

55,740

OTHER FINANCIAL DATA

Dollars in millions (unless otherwise noted)

Three Months Ended December 31,

Twelve Months Ended

December 31,

2023

2022

2023

2022

Earnings per common share (U.S. dollars)

1.91

3.09

8.89

13.26

Earnings per common share – assuming dilution (U.S. dollars)

1.91

3.09

8.89

13.26

Dividends on common stock

Total

3,839

3,767

14,941

14,939

Per common share (U.S. dollars)

0.95

0.91

3.68

3.55

Millions of common shares outstanding

Average – assuming dilution

4,010

4,138

4,052

4,205

Taxes

Income taxes

2,613

5,787

15,429

20,176

Total other taxes and duties

7,308

7,754

32,191

31,455

Total taxes

9,921

13,541

47,620

51,631

Sales-based taxes

5,792

6,113

24,693

25,434

Total taxes including sales-based taxes

15,713

19,654

72,313

77,065

ExxonMobil share of income taxes of equity companies (non-GAAP)

843

1,512

3,058

7,594

ATTACHMENT I-b

CONDENSED CONSOLIDATED BALANCE SHEET

(Preliminary)

Dollars in millions (unless otherwise noted)

December 31,
2023

December 31,
2022

ASSETS

Current assets

Cash and cash equivalents

31,539

29,640

Cash and cash equivalents – restricted

29

25

Notes and accounts receivable – net

38,015

41,749

Inventories

Crude oil, products and merchandise

20,528

20,434

Materials and supplies

4,592

4,001

Other current assets

1,906

1,782

Total current assets

96,609

97,631

Investments, advances and long-term receivables

47,630

49,793

Property, plant and equipment – net

214,940

204,692

Other assets, including intangibles – net

17,138

16,951

Total Assets

376,317

369,067

LIABILITIES

Current liabilities

Notes and loans payable

4,090

634

Accounts payable and accrued liabilities

58,037

63,197

Income taxes payable

3,189

5,214

Total current liabilities

65,316

69,045

Long-term debt

37,483

40,559

Postretirement benefits reserves

10,496

10,045

Deferred income tax liabilities

24,452

22,874

Long-term obligations to equity companies

1,804

2,338

Other long-term obligations

24,228

21,733

Total Liabilities

163,779

166,594

EQUITY

Common stock without par value

(9,000 million shares authorized, 8,019 million shares issued)

17,781

15,752

Earnings reinvested

453,927

432,860

Accumulated other comprehensive income

(11,989)

(13,270)

Common stock held in treasury

(4,048 million shares at December 31, 2023, and 3,937 million shares at December 31, 2022)

(254,917)

(240,293)

ExxonMobil share of equity

204,802

195,049

Noncontrolling interests

7,736

7,424

Total Equity

212,538

202,473

Total Liabilities and Equity

376,317

369,067

ATTACHMENT I-c

CONDENSED CONSOLIDATED STATEMENT OF CASH FLOWS

(Preliminary)

Dollars in millions (unless otherwise noted)

Twelve Months Ended

December 31,

2023

2022

CASH FLOWS FROM OPERATING ACTIVITIES

Net income/(loss) including noncontrolling interests

37,354

57,577

Depreciation and depletion (includes impairments)

20,641

24,040

Changes in operational working capital, excluding cash and debt

(4,255)

(194)

All other items – net

1,629

(4,626)

Net cash provided by operating activities

55,369

76,797

CASH FLOWS FROM INVESTING ACTIVITIES

Additions to property, plant and equipment

(21,919)

(18,407)

Proceeds from asset sales and returns of investments

4,078

5,247

Additional investments and advances

(2,995)

(3,090)

Other investing activities including collection of advances

1,562

1,508

Net cash used in investing activities

(19,274)

(14,742)

CASH FLOWS FROM FINANCING ACTIVITIES

Additions to long-term debt

939

637

Reductions in long-term debt

(15)

(5)

Additions to short-term debt

198

Reductions in short-term debt

(879)

(8,075)

Additions/(Reductions) in debt with three months or less maturity

(284)

25

Contingent consideration payments

(68)

(58)

Cash dividends to ExxonMobil shareholders

(14,941)

(14,939)

Cash dividends to noncontrolling interests

(531)

(267)

Changes in noncontrolling interests

(770)

(1,475)

Common stock acquired

(17,748)

(15,155)

Net cash provided by (used in) financing activities

(34,297)

(39,114)

Effects of exchange rate changes on cash

105

(78)

Increase/(Decrease) in cash and cash equivalents

1,903

22,863

Cash and cash equivalents at beginning of period

29,665

6,802

Cash and cash equivalents at end of period

31,568

29,665

1 Includes $568 million issued to facilitate the sale of an entity where the buyer assumed the debt upon closing; no longer on the Condensed Consolidated Balance Sheet at the end of 2023.

ATTACHMENT II-a

KEY FIGURES: IDENTIFIED ITEMS

4Q23

3Q23

4Q22

Dollars in millions (unless otherwise noted)

2023

2022

7,630

9,070

12,750

Earnings/(Loss) (U.S. GAAP)

36,010

55,740

Identified Items

(3,040)

(530)

Impairments

(3,040)

(4,202)

305

Gain/(Loss) on sale of assets

305

886

577

(47)

(1,825)

Tax-related items

348

(1,501)

(175)

1,070

Other

(175)

1,456

(2,333)

(47)

(1,285)

Total Identified Items

(2,562)

(3,361)

9,963

9,117

14,035

Earnings/(Loss) Excluding Identified Items (non-GAAP)

38,572

59,101

4Q23

3Q23

4Q22

Dollars per common share

2023

2022

1.91

2.25

3.09

Earnings/(Loss) Per Common Share (U.S. GAAP)

8.89

13.26

Identified Items Per Common Share

(0.75)

(0.13)

Impairments

(0.75)

(1.00)

0.08

Gain/(Loss) on sale of assets

0.08

0.21

0.14

(0.01)

(0.44)

Tax-related items

0.08

(0.36)

(0.04)

0.26

Other

(0.04)

0.35

(0.57)

(0.01)

(0.31)

Total Identified Items Per Common Share

(0.63)

(0.80)

2.48

2.27

3.40

Earnings/(Loss) Excl. Identified Items Per Common Share (non-GAAP)

9.52

14.06

1 Assuming dilution.

ATTACHMENT II-b

KEY FIGURES: IDENTIFIED ITEMS BY SEGMENT

Fourth Quarter 2023

Upstream

Energy Products

Chemical Products

Specialty Products

Corporate
&
Financing

Total

Dollars in millions (unless otherwise noted)

U.S.

Non-U.S.

U.S.

Non-U.S.

U.S.

Non-U.S.

U.S.

Non-U.S.

Earnings/(Loss) (U.S. GAAP)

84

4,065

1,329

1,878

478

(289)

386

264

(565)

7,630

Identified Items

Impairments

(1,978)

(686)

(21)

(273)

(82)

(3,040)

Gain/(Loss) on sale of assets

305

305

Tax-related items

184

58

192

(3)

53

12

5

76

577

Other

(147)

(28)

(175)

Total Identified Items

(1,489)

(628)

192

(3)

32

(420)

12

(105)

76

(2,333)

Earnings/(Loss) Excl. Identified Items (non-GAAP)

1,573

4,693

1,137

1,881

446

131

374

369

(641)

9,963

Third Quarter 2023

Upstream

Energy Products

Chemical Products

Specialty Products

Corporate
&
Financing

Total

Dollars in millions (unless otherwise noted)

U.S.

Non-U.S.

U.S.

Non-U.S.

U.S.

Non-U.S.

U.S.

Non-U.S.

Earnings/(Loss) (U.S. GAAP)

1,566

4,559

1,356

1,086

338

(89)

326

293

(365)

9,070

Identified Items

Tax-related items

(14)

(33)

(47)

Total Identified Items

(14)

(33)

(47)

Earnings/(Loss) Excl. Identified Items (non-GAAP)

1,566

4,573

1,356

1,119

338

(89)

326

293

(365)

9,117

Fourth Quarter 2022

Upstream

Energy Products

Chemical Products

Specialty Products

Corporate
&
Financing

Total

Dollars in millions (unless otherwise noted)

U.S.

Non-U.S.

U.S.

Non-U.S.

U.S.

Non-U.S.

U.S.

Non-U.S.

Earnings/(Loss) (U.S. GAAP)

2,493

5,708

2,188

1,882

298

(48)

406

354

(531)

12,750

Identified Items

Impairments

(216)

(58)

(216)

(40)

(530)

Tax-related items

(1,415)

(410)

(1,825)

Other

1,070

1,070

Total Identified Items

(561)

(58)

(626)

(40)

(1,285)

Earnings/(Loss) Excl. Identified Items (non-GAAP)

2,493

6,269

2,246

2,508

298

(48)

406

394

(531)

14,035

2023

Upstream

Energy Products

Chemical Products

Specialty Products

Corporate
&
Financing

Total

Dollars in millions (unless otherwise noted)

U.S.

Non-U.S.

U.S.

Non-U.S.

U.S.

Non-U.S.

U.S.

Non-U.S.

Earnings/(Loss) (U.S. GAAP)

4,202

17,106

6,123

6,019

1,626

11

1,536

1,178

(1,791)

36,010

Identified Items

Impairments

(1,978)

(686)

(21)

(273)

(82)

(3,040)

Gain/(Loss) on sale of assets

305

305

Tax-related items

184

(126)

192

(48)

53

12

5

76

348

Other

(147)

(28)

(175)

Total Identified Items

(1,489)

(812)

192

(48)

32

(420)

12

(105)

76

(2,562)

Earnings/(Loss) Excl. Identified Items (non-GAAP)

5,691

17,918

5,931

6,067

1,594

431

1,524

1,283

(1,867)

38,572

2022

Upstream

Energy Products

Chemical Products

Specialty Products

Corporate
&
Financing

Total

Dollars in millions (unless otherwise noted)

U.S.

Non-U.S.

U.S.

Non-U.S.

U.S.

Non-U.S.

U.S.

Non-U.S.

Earnings/(Loss) (U.S. GAAP)

11,728

24,751

8,340

6,626

2,328

1,215

1,190

1,225

(1,663)

55,740

Identified Items

Impairments

(3,790)

(58)

(216)

(40)

(98)

(4,202)

Gain/(Loss) on sale of assets

299

587

886

Tax-related items

(1,415)

(410)

324

(1,501)

Other

1,380

76

1,456

Total Identified Items

299

(3,238)

(58)

(626)

(40)

302

(3,361)

Earnings/(Loss) Excl. Identified Items (non-GAAP)

11,429

27,989

8,398

7,252

2,328

1,215

1,190

1,265

(1,965)

59,101

ATTACHMENT III

KEY FIGURES: UPSTREAM VOLUMES

4Q23

3Q23

4Q22

Net production of crude oil, natural gas liquids, bitumen and synthetic oil, thousand barrels per day (kbd)

2023

2022

851

756

789

United States

803

776

709

655

682

Canada/Other Americas

664

588

3

4

4

Europe

4

4

231

229

223

Africa

221

238

722

713

725

Asia

721

705

34

40

38

Australia/Oceania

36

43

2,550

2,397

2,461

Worldwide

2,449

2,354

4Q23

3Q23

4Q22

Net natural gas production available for sale, million cubic feet per day (mcfd)

2023

2022

2,262

2,271

2,383

United States

2,311

2,551

98

94

74

Canada/Other Americas

96

148

367

368

536

Europe

414

667

149

129

89

Africa

125

71

3,486

3,528

3,704

Asia

3,490

3,418

1,283

1,358

1,381

Australia/Oceania

1,298

1,440

7,645

7,748

8,167

Worldwide

7,734

8,295

3,824

3,688

3,822

Oil-equivalent production (koebd)

3,738

3,737

1 Natural gas is converted to an oil-equivalent basis at six million cubic feet per one thousand barrels.

ATTACHMENT IV

KEY FIGURES: MANUFACTURING THROUGHPUT AND SALES

4Q23

3Q23

4Q22

Refinery throughput, thousand barrels per day (kbd)

2023

2022

1,933

1,868

1,694

United States

1,848

1,702

407

415

433

Canada

407

418

1,014

1,251

1,157

Europe

1,166

1,192

450

517

532

Asia Pacific

498

539

82

164

167

Other

149

179

3,886

4,215

3,983

Worldwide

4,068

4,030

4Q23

3Q23

4Q22

Energy Products sales, thousand barrels per day (kbd)

2023

2022

2,704

2,626

2,507

United States

2,633

2,426

2,653

2,925

2,916

Non-U.S.

2,828

2,921

5,357

5,551

5,423

Worldwide

5,461

5,347

2,255

2,316

2,270

Gasolines, naphthas

2,288

2,232

1,735

1,834

1,798

Heating oils, kerosene, diesel

1,795

1,774

328

358

349

Aviation fuels

336

338

185

229

210

Heavy fuels

214

235

854

814

796

Other energy products

829

768

5,357

5,551

5,423

Worldwide

5,461

5,347

4Q23

3Q23

4Q22

Chemical Products sales, thousand metric tons (kt)

2023

2022

1,743

1,750

1,583

United States

6,779

7,270

3,033

3,358

3,076

Non-U.S.

12,603

11,897

4,776

5,108

4,658

Worldwide

19,382

19,167

4Q23

3Q23

4Q22

Specialty Products sales, thousand metric tons (kt)

2023

2022

473

498

455

United States

1,962

2,049

1,367

1,414

1,332

Non-U.S.

5,635

5,762

1,839

1,912

1,787

Worldwide

7,597

7,810

ATTACHMENT V

KEY FIGURES: CAPITAL AND EXPLORATION EXPENDITURES

4Q23

3Q23

4Q22

Dollars in millions (unless otherwise noted)

2023

2022

Upstream

2,258

2,241

2,118

United States

8,813

6,968

3,512

2,560

3,297

Non-U.S.

10,948

10,034

5,770

4,801

5,415

Total

19,761

17,002

Energy Products

227

261

343

United States

1,195

1,351

485

386

405

Non-U.S.

1,580

1,059

712

647

748

Total

2,775

2,410

Chemical Products

211

103

332

United States

751

1,123

641

268

824

Non-U.S.

1,962

1,842

852

371

1,156

Total

2,713

2,965

Specialty Products

22

16

12

United States

63

46

127

95

90

Non-U.S.

391

222

149

111

102

Total

454

268

Other

274

92

42

Other

622

59

7,757

6,022

7,463

Worldwide

26,325

22,704

CASH CAPITAL EXPENDITURES

4Q23

3Q23

4Q22

Dollars in millions (unless otherwise noted)

2023

2022

6,228

4,920

5,783

Additions to property, plant and equipment

21,919

18,407

506

276

905

Net investments and advances

1,433

1,582

6,734

5,196

6,688

Total Cash Capital Expenditures

23,352

19,989

ATTACHMENT VI

KEY FIGURES: QUARTER EARNINGS/(LOSS)

Results Summary

4Q23

3Q23

Change

vs

3Q23

4Q22

Change

vs

4Q22

Dollars in millions (except per share data)

2023

2022

Change

vs

2022

7,630

9,070

-1,440

12,750

-5,120

Earnings (U.S. GAAP)

36,010

55,740

-19,730

9,963

9,117

+846

14,035

-4,072

Earnings Excluding Identified Items (non-GAAP)

38,572

59,101

-20,529

1.91

2.25

-0.34

3.09

-1.18

Earnings Per Common Share

8.89

13.26

-4.37

2.48

2.27

+0.21

3.40

-0.92

Earnings Excl. Identified Items Per Common Share
(non-GAAP)

9.52

14.06

-4.54

7,757

6,022

+1,735

7,463

+294

Capital and Exploration Expenditures

26,325

22,704

+3,621

1 Assuming dilution.

ATTACHMENT VII

KEY FIGURES: EARNINGS/(LOSS) BY QUARTER

Dollars in millions (unless otherwise noted)

2023

2022

2021

2020

2019

First Quarter

11,430

5,480

2,730

(610)

2,350

Second Quarter

7,880

17,850

4,690

(1,080)

3,130

Third Quarter

9,070

19,660

6,750

(680)

3,170

Fourth Quarter

7,630

12,750

8,870

(20,070)

5,690

Full Year

36,010

55,740

23,040

(22,440)

14,340

Dollars per common share

2023

2022

2021

2020

2019

First Quarter

2.79

1.28

0.64

(0.14)

0.55

Second Quarter

1.94

4.21

1.10

(0.26)

0.73

Third Quarter

2.25

4.68

1.57

(0.15)

0.75

Fourth Quarter

1.91

3.09

2.08

(4.70)

1.33

Full Year

8.89

13.26

5.39

(5.25)

3.36

1 Computed using the average number of shares outstanding during each period; assuming dilution.


View source version on businesswire.com: https://www.businesswire.com/news/home/20240201689947/en/

The post ExxonMobil Announces 2023 Results appeared first on Energy News Beat.


Across America, clean energy plants are being banned faster than they’re being built

Energy News Beat

Across America’s power grid, there’s a growing gap between what we need and what we’ll allow.

As the planet warms and climate disasters grow more costly, the U.S. has set a target to reach 100% clean energy by 2035, a goal that depends on building large-scale solar and wind power.

A nationwide analysis by USA TODAY shows local governments are banning green energy faster than they’re building it.

At least 15% of counties in the U.S. have effectively halted new utility-scale wind, solar, or both, USA TODAY found. These limits come through outright bans, moratoriums, construction impediments and other conditions that make green energy difficult to build.

The impediments come as a gigantic effort to build green energy also is under way. U.S. energy from commercial wind and solar is expected to hit 19% by 2025, and those sources are expected to surpass the amount of electricity made from coal this year.

But green energy must increase radically over the next 11 years to meet U.S. goals. And those projects are becoming harder to build.

In the past decade, about 180 counties got their first commercial wind-power project. But in the same period, more than twice as many blocked wind development. And while solar power has found more broad acceptance, 2023 was the first year to see almost as many individual counties block new solar projects as the ones adding their first project.

The result: Some of the nation’s areas with the best sources of wind and solar power have now been boxed out.

Because large-scale solar and wind projects typically are built outside city limits, USA TODAY’s analysis focuses on restrictions by the county-level governments that have jurisdiction. In a few cases, such as Connecticut, Tennessee and Vermont, entire states have implemented near-statewide restrictions.

While 15% of America’s counties might sound like a small portion, the trend has significant consequences, says Jeff Danielson, a former four-term Iowa state senator now with the Clean Grid Alliance.

“It’s 15% of the most highly productive areas to develop wind and solar,” he said. “Our overall goals are going to be difficult to achieve if the answer is ‘No’ in county after county.”

The country’s green-energy deadline now sits just 11 years away. But even if politicians fail to meet that goal, another clock is ticking.

1031 Exchange E-Book

ENB Top News 
ENB
Energy Dashboard
ENB Podcast
ENB Substack


The post Across America, clean energy plants are being banned faster than they’re being built appeared first on Energy News Beat.


Argentinian, German officials meet to discuss critical minerals

Energy News Beat


​[[{“value”:”

Argentina’s Mining Secretary, Flavia Royon, and the governors of the Lithium Table provinces, that is, Jujuy, Catamarca and San Juan, travelled to Germany to promote the country’s critical mineral resources at a conference and through one-on-one meetings with government officials.

The politicians met with representatives from Germany’s Ministry of Foreign Affairs, members of the Economic Affairs Commission of the German Parliament, the Secretary of Commerce, as well as with the director of mineral resources, the director of exports and representatives for the Americas of the German Ministry of Economy and Climate.

“The Argentine delegation, led by the Secretary of Mining and accompanied by the governors, held a fruitful exchange with the 15 deputies from the German Chamber of Deputies’ Economic Affairs Commission. The German representatives showed keen interest in the exploration and production of critical minerals, such as copper and lithium, in Argentine territory,” Royon’s office said in a media statement.

According to the brief, the discussions revolved around the role that Argentina can play in the global energy transition, particularly concerning the EU as the block moves toward supplier diversification.

The Argentinian governors detailed the mineral potential of each of their provinces, with a special focus on the mining projects that employ solar energy, thus fostering processes with low carbon emissions.

“This comprehensive approach reflects the provinces’ commitment to responsible industrial practices and respect for the environment. The domestic mining industry is considered a platform with great potential to be a beneficiary of German financial funds and tools. These funds are designed to meet the most demanding standards of environmental stewardship. Notably, these Argentine provinces considerably exceed these standards,” the release reads.

To strengthen this bilateral collaboration, especially in the energy and mining sectors, the German parliamentarians who met with the Argentinian delegation will visit the South American country in March 2024.

“}]] 

The post Argentinian, German officials meet to discuss critical minerals appeared first on Energy News Beat.