Denmark’s Uni-Tankers is renewing its fleet with two modern stainless steel vessels.
The Per Ekmann-led outfit is adding the Selandia Swan to its owned fleet this spring. The ship is said to represent the company’s ongoing commitment to renewing its fleet with new, energy-efficient tonnage.
Uni-Tankers is also bringing in the 2024-built 6,000 dwt Tina M on a long-term charter in April.
Both units are sister vessels to the 2022-built Fionia Swan, which joined Uni-Tankers’s fleet last year, and which according to the company, boasts about 25% higher efficiency compared to conventional tankers of similar size.
The new additions will take Uni-Tankers’ fuel-efficient sister vessel series to five. The Middelfart-based company currently lists 43 ships in its fleet of which 16 are owned.
AP Moller-Maersk has reached an agreement with the Port Authority of New York and New Jersey to extend APM Terminals Elizabeth’s lease through December 2062.
Originally set to expire in 2029, the 33-year lease extension “paves the way for major infrastructure investments which will enhance capacity and transport velocity, create jobs and strengthen the US economy”, Maersk’s port operating arm said.
The proposed deal is subject to vote by Port Authority Board of Commissioners on March 27.
The terminal in Elizabeth is APM Terminals’ largest terminal on the east coast of North America and offers the largest reefer capacity in the port of New York and New Jersey. It currently handles over 25% of the annual container throughput in the port complex.
APM Terminals said it envisions an even larger and more efficient container terminal in the future with further investments. Planned upgrades include the optimisation of the terminal layout, electrification of container handling equipment, and future-proofing container berths.
U.S. President Donald Trump has announced that any country that buys oil or gas from Venezuela will pay a 25% secondary tariff on trades with the United States, Reuters reported on Monday, with Trump claiming that Venezuela has sent “tens of thousands” of people to the U.S. who have a “very violent nature.
Earlier this month, Chevron Corp. (NYSE:CVX) received a 30-day notice from the Trump administration to wrap up its operations in Venezuela. The deadline, set for April 3, provides the company only 30 days instead of the normal six-month wind-down period. Since 2022, Chevron has been allowed to operate in Venezuela as an exception to U.S. sanctions, exporting crude to the United States. According to Secretary of State Marco Rubio and other foreign-policy hawks, Chevron has been providing a financial lifeline for Maduro’s regime to enrich itself and suppress civil rights. Venezuela produced about 20% of Venezuela’s oil in 2024, close to Maduro’s goal of 1 million barrels per day. Chevron is the only major oil producer with a waiver to operate in Venezuela despite Washington’s sanctions against President Nicolás Maduro’s regime.
Last year, the United States Office of Foreign Assets Control (OFAC) eased some sanctions on Venezuela but retained sanctions on PdVSA. OFAC has issued a new license allowing certain transactions related to the export or re-export of liquefied petroleum gas (LPG) to Venezuela until July 8, 2025. However, transactions with Petróleos de Venezuela, S.A., the Venezuelan state-owned oil and natural gas company in which PdVSA has a 50 percent or greater interest, remain prohibited under the sanctions imposed by various executive orders.
Venezuela’s crude oil production has declined sharply from 3.2 million b/d in 2000 to 735,000 b/d in September 2023 mainly due to sanctions and poor maintenance; in contrast, Argentina’s crude output has been increasing with Argentine President Javier Milei vowing to shake up the system.
Greek bulker owner Diana Shipping has landed another charter deal with Cargill, the New York-listed company’s fourth fixture with the commodities trading giant in just over a month.
The Semiramis Paliou-led company has secured employment for the 2010-built panamax Leto from end-March through to July 16, 2026, and extension options for up to two more months.
The 81,297 dwt vessel, which has been earning $16,000 per day, excluding 5% commission, at ASL Bulk Shipping since last May, will take a rate cut of about $3,250 per day on the new Cargill fixture.
Athens-based Diana said it should earn around $5.9m, excluding options.
Last week, the company fixed its 2016-built ultramax DSI Andromeda to Cargill up to January 15, 2026, at $14,000 per day in a slight improvement against the vessel’s current charter with Bunge at $13,500 per day.
Earlier in March, Diana chartered out the 2010-built kamsarmax Medusa to Cargill for up to 16 months, after fixing another 2010-built unit Myrsini in February. Both ships will earn $13,000 per day excluding 4.75% commission until at least mid-May and January 2026, respectively.
Shell is considering a potential delisting from the London Stock Exchange, which could have significant implications for BP’s future.
BP is facing investor pressure for strategic changes and may be open to a merger, with Shell being a potential acquirer due to its financial strength and market capitalization.
BP’s successful oil trading desk is a valuable asset that could make it an attractive acquisition target for Shell, and the UK government would likely favor a Shell takeover to maintain influence over BP.
Last year, British multinational oil & gas giant, Shell Plc (NYSE:SHEL) threatened to delist from the London Stock Exchange (LSE) and list on the New York Stock Exchange (NYSE). Shell CEO Wael Sawan told Bloomberg that the company is grossly undervalued in London due to shareholder apathy to the oil and gas sector. Sawan also expressed deep frustration by investors’ under-appreciation of the financial performance of the company, as well as the British government’s over-taxation of its profits. Sawan vowed to “look at all options”, including switching the group’s listing to New York in a bid to close the valuation gap with American Big Oil companies Exxon Mobil Corp. (NYSE:XOM) and Chevron Corp. (NYSE:CVX). A U.S. listing might make even more sense now that Trump is in office thanks to his pro-fossil fuel policies.
The UK government, however, will be wishing for Shell to stay put as it looks up to Europe’s biggest oil and gas company to save the British crown jewel, BP Plc (NYSE:BP). Shell moved its headquarters from Hague to London in 2022 as part of a broader corporate restructuring, including simplifying its share structure, dropping “Royal Dutch” from its name, and shifting its tax residence to the UK. Over the past couple of years, rumours have swirled in the industry that BP might be open to a merger, with its shares struggling after CEO Murray Auchincloss’ fossil fuel-focused strategy reset failed to win over markets. U.S. activist investor Elliott Management has acquired a 5% stake in BP, and is using his fire power to push for changes including cost cuts and potential changes in leadership.
There are several reasons why such a merger would make sense. For starters, Shell has the wherewithal to pull off such a deal, thanks to its $218B market cap compared with BP’s $92B. Further, despite its recent struggles, BP has an impressive oil and gas portfolio, including onshore shale basins in the U.S. and the Gulf of Mexico, Brazil, the North Sea and the Middle East. BP produced 2.36 million barrels of oil equivalent per day last year, generating $8.9 billion in net profit.
BP also owns one of the biggest and most successful oil trading desks in the world.
Whereas several U.S. oil companies have tried their hand at oil trading, it’s European oil and gas supermajors that have perfected the art and science of leveraging volatile oil markets to reap big profits. To wit, Exxon Mobil (NYSE: XOM) famously ditched its effort to build an energy trading business to compete with those of European oil majors after a period of low oil prices forced the company to heavily cut the unit’s funding amid broader spending cuts. BP, on the other hand, has managed to build one of the most successful energy trading ventures by an oil and gas major. BP’s trading desk has been astute at taking advantage of highly volatile energy markets in the past, with former CEO Bob Dudley and his army of 3,000 traders displaying an uncanny ability to predict the oil price trajectory. For instance, Dudley famously told the media that “Prices will remain low for longer,” after oil prices plunged to their lowest in more than a decade in 2016. Indeed, Dudley authorized a daring trade that saw BP place a large bet on a rebound in oil prices. BP was already heavily exposed to (low) oil prices, yet it chose to double down in a bid to increase the exposure by buying futures contracts much as a hedge fund would. A former BP executive with direct knowledge of the trade told Bloomberg that BP “made a lot of money” from that bet.
The UK government would certainly favor a Shell takeover of BP, being loath to lose its ability to leverage the company to wield soft power by letting the company be snapped up by a foreign rival, including Middle Eastern oil giants. Last year, Iraqi oil ministry officials revealed that BP will develop Iraq’s Kirkuk oil and gas fields based on a profit-sharing model. The oil ministry and BP are expected to sign a confidentiality agreement in the current week, after which Iraq will hand over the data package for Kirkuk’s four fields and installations. According to the officials, Kirkuk oil fields are currently producing 245,000 barrels of crude per day. Iraq is OPEC’s second largest producer after Saudi Arabia. Iraq’s economy relies heavily on crude oil exports, with crude accounting for more than 90 percent of the country’s revenues.
That said, it would be interesting to see if Shell would be interested in buying its British peer. A big challenge for a potential tie-up would be the fact that it does not necessarily align with the ethos of Shell CEO Wael Sawan, who is focused on cutting costs and narrowing the business’s focus to liquefied natural gas (LNG). On the other hand, Shell is one of the oil majors trying to expand their trading desks, and buying BP would be a slam dunk in that regard.
ENB Pub Note: This article is from Robert Bryce and his Substack. We highly recommend subscribing and supporting his work. He has amazing points on Energy and today is no exception. The world needs low-cost energy, and as I talked about Net Zero today on the Energy Realities podcast, the world is being divided. One-half of the world will have access to low-cost energy, financial growth, and prosperity, and the other side will face decline, no growth, and fiscal failure.
Soaring coal use in China and India is swamping the West’s decarbonization efforts. Here’s a climate policy reality check in nine charts.
Net zero and decarbonization pledges are a dime a dozen.
Earlier this month, the Australian government released an update to its “Net Zero in Government Operations Annual Progress Report.” The 65-page document is a marvel of bureaucratic navel-gazing. It takes a deep dive into the “Australian Public Service Net Zero by 2030 target,” including discussions of “emissions factors,” as well as scope 1, scope 2, and scope 3 emissions on everything from airplane flights to rental cars. The document has some laughably precise numbers. It claims electricity-related emissions totaled exactly 1.697 million tons of CO2 and that “38.29% of electricity consumed in 2023-24 was certified renewable electricity.”
Numerous other countries are touting their net zero plans. The German government has a target of net zero emissions by 2045. The UK’s net zero target is 2050. Canada plans to hit net zero by 2050. So does the EU, Japan, and South Korea. The Biden administration — remember them? — pledged that the US would achieve net zero “no later than 2050.” Notably, China and India also have bold decarbonization plans, with India targeting net zero by 2070, and China claiming it will hit net zero “before 2060.”
But there’s a China-size gap between these decarbonization pledges and the ever-increasing global demand for hydrocarbons. According to the International Energy Agency’s Global Energy Review, which was released today, hydrocarbon growth again exceeded the growth in renewables last year. The report also shows that oil, natural gas, and coal provide more than five times as much primary energy to the global economy as the political darlings of the moment.
According to the IEA, oil consumption increased by 0.8%, and natural gas use jumped by 2.7% in 2024. While oil and gas are pivotal fuels, the global climate story continues to be defined by coal. Last year, global coal use increased by 1%, and power generation from coal plants totaled 10,700 terawatt-hours, a new record. The IEA’s reports show that soaring coal use and electricity demand in China (population: 1.4 billion) and India (population: 1.4 billion) is swamping all the climate policies and decarbonization efforts in the US, Canada, Europe, Japan, and South Korea.
Indeed, one of the big ironies in the IEA’s Electricity 2025 report, which was released last month, is that a significant chunk of China’s electricity demand growth — and therefore, its coal demand — is due to industrial demand for the production of the solar panels, batteries, and EVs that Western countries claim are needed for their decarbonization efforts.
China and India now account for more than 70% of global coal use, and their coal demand and CO2 emissions will continue rising for years to come. Need proof? Look at these nine charts.
The IEA’s recent report shows yet again that electricity is the world’s most important and fastest-growing form of energy.
The agency expects that over the next three years, global electricity demand will increase by “an unprecedented 3,500 terawatt-hours. This corresponds to adding more than the equivalent of a Japan to the world’s electricity consumption each year.” (Japan’s electricity generation in 2023 was 1,013 TWh.)
The IEA also reported that “emissions from electricity generation remain the highest of any sector” and that in 2024, greenhouse gas emissions from the electric sector set another new record: 13.8 billion tons of CO2. That’s a slight increase over the 13.6 billion tons emitted in 2023.
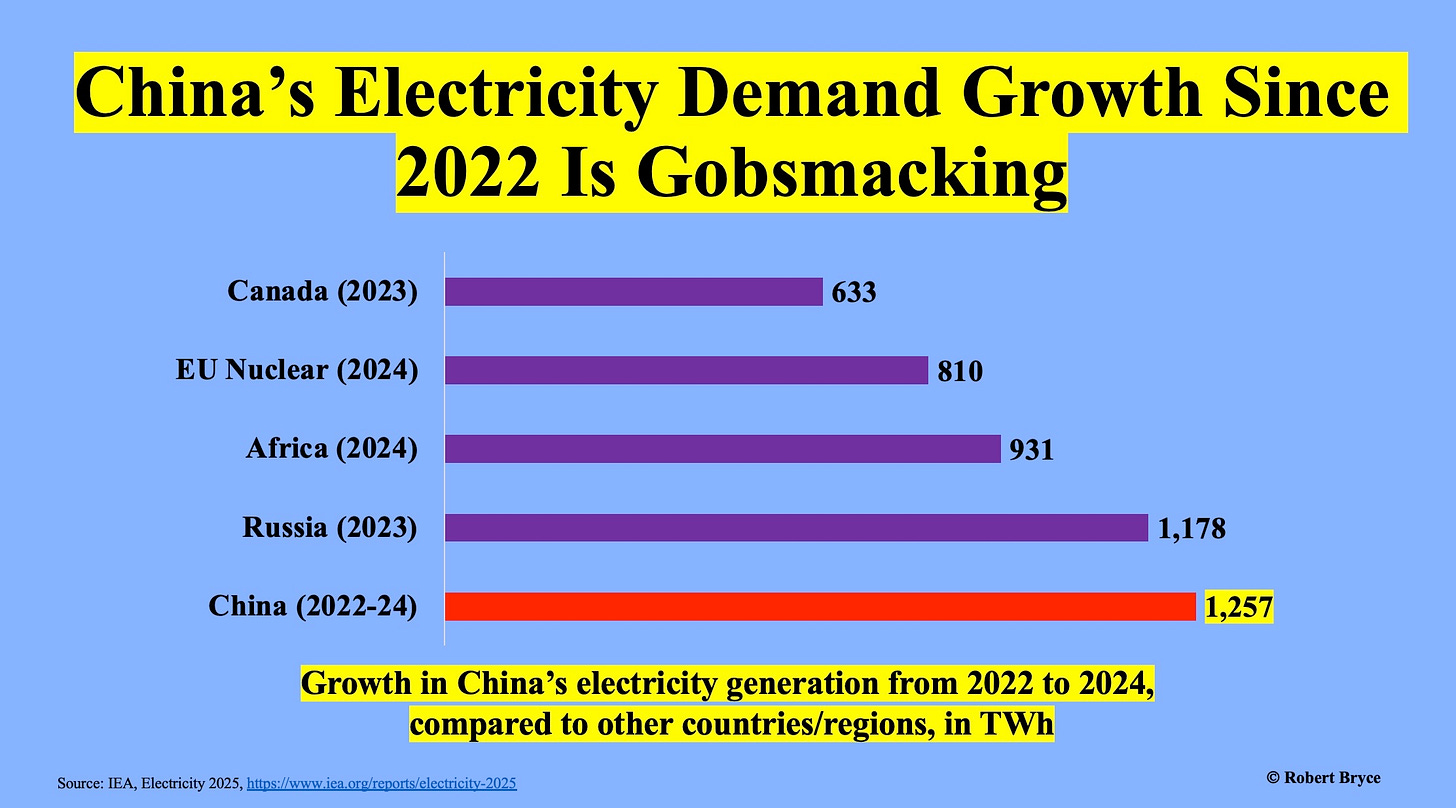
As seen above, the growth in China’s electricity use boggles the mind. Between 2022 and 2024, China’s electricity generation increased by some 1,257 TWh. Thus, just the growth in China’s electricity use was greater than all of the electricity generated in Africa in 2024. Here’s a key segment from the IEA’s report, which says global electricity use:
Rose by an estimated 4.3% y-o-y in 2024, up from 2.5% in 2023, with growth expected to continue at a robust 3.9% in our outlook period. In 2024, around 95% of the growth in global electricity demand occurred in emerging economies, with China accounting for 54% of the total. Out to 2027, developing economies will remain the engines of growth, accounting for around 85% of additional global electricity demand, with China providing more than half of the gains. (Emphasis added.)
How has China generated all that juice? The IEA says that last year, coal demand in China increased by 1.2% to a new record high and that 60% of China’s electricity came from coal-fired power plants. In the report released today, the IEA said China:
Now consumes nearly 40% more coal than the rest of the world combined, largely for power generation. Over one-third of all the coal consumed globally is burned by power plants in China. China’s influence in global coal market trends is unparalleled by any country for any type of fuel, with China’s share of global coal consumption now standing at 58%. (Emphasis added.)
The IEA expects China’s astonishing coal demand to continue. It says electricity generation in China increased by about 7% in 2023 and 2024, and it expects electricity consumption to continue growing by about 6% per year through 2027. At that rate, China’s electricity use will double over the next decade or so.
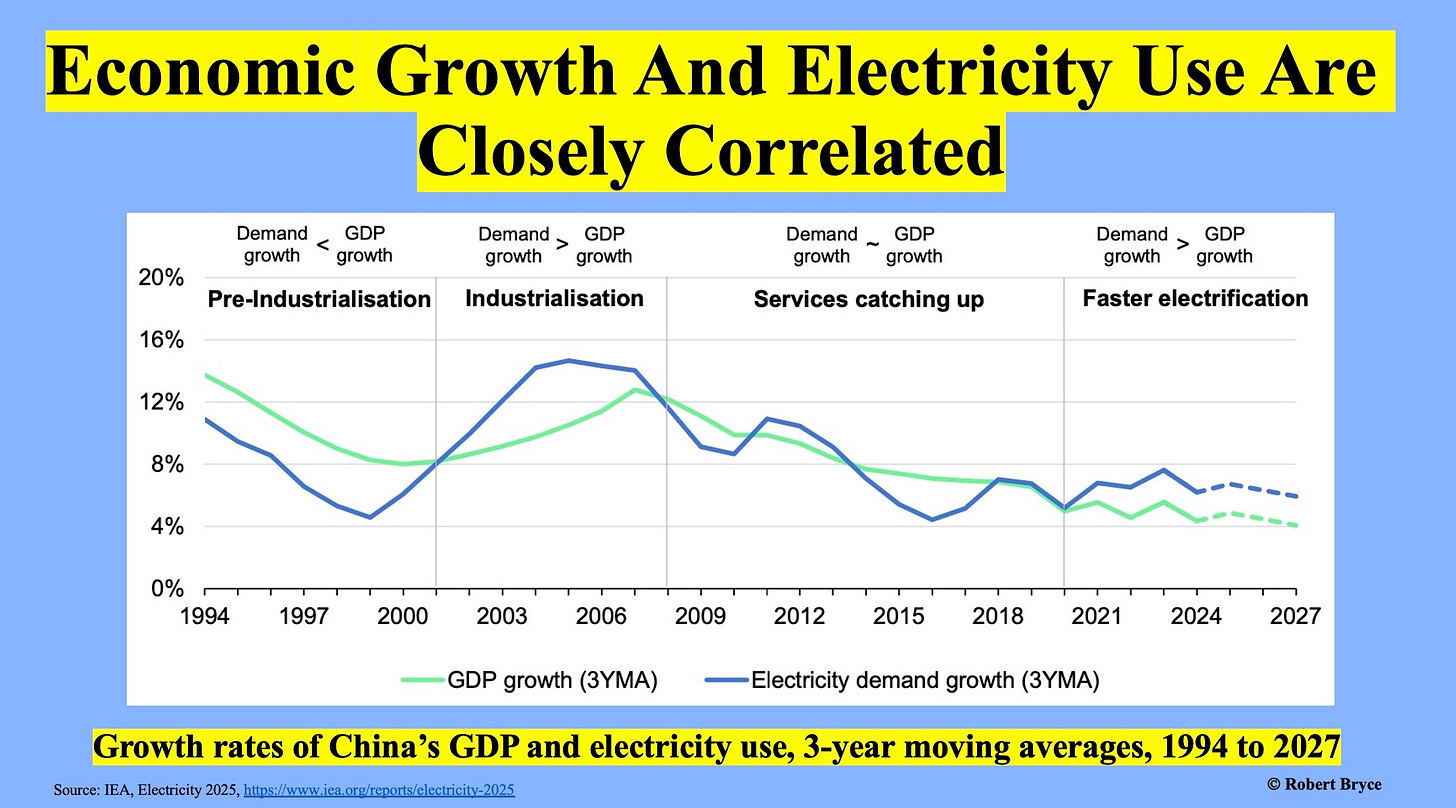
One of the most interesting graphics in the IEA report shows the close connection between economic growth and electricity demand. As seen in the chart above, sometimes GDP leads the increase in electricity demand, and sometimes it lags. But the chart shows that what’s true in China — and every other country on the planet — is that economic growth drives electricity demand, and electricity demand drives economic growth.
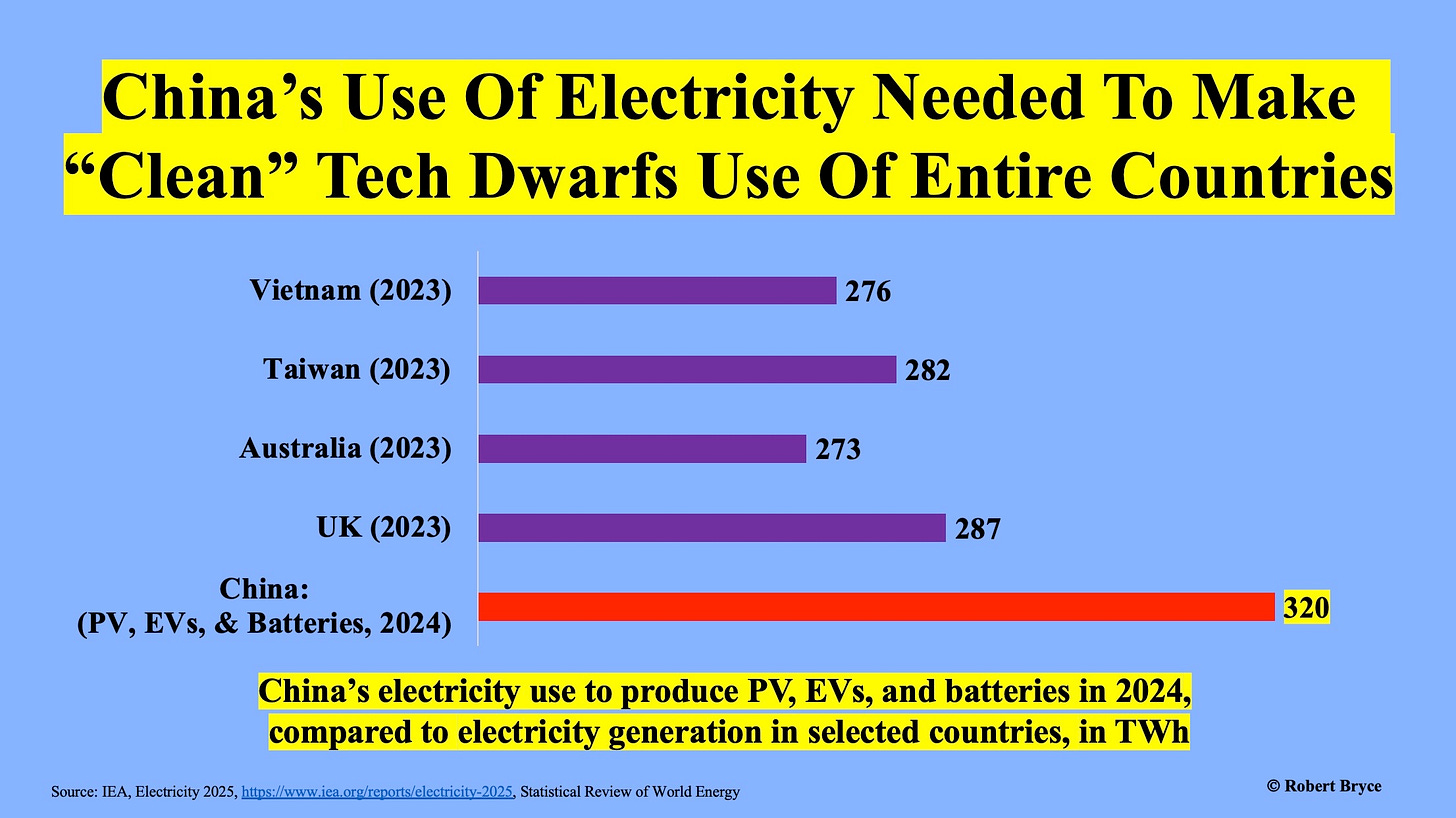
One of the revelations from the IEA’s electricity report is the staggering amount of juice China uses to produce solar panels, batteries, and electric vehicles. The IEA explains:
In China, industry consumes approximately 60% of all electricity, much higher than in any other country in the world (32% on average in the OECD). Over the three-year period from 2022 to 2024, 48% of the increase in Chinese electricity demand came from the industry sector. The manufacturing of PV modules, batteries, and EVs, excluding the processing of associated materials, are estimated to have consumed around 320 TWh of electricity in 2024…which rose by more than 230 TWh over 2022-2024. During this period, new energy products made up nearly 35% of the increase in industrial electricity demand and 16% of the growth in total electricity use across China. Including the numerous electricity-intensive upstream processes associated with these products that take place in China, such as the refining and processing of the related materials, can further boost these numbers. (Emphasis added.)
Pay attention to that last sentence.
The IEA is saying that the 320 TWh estimate represents only a part of the electricity China uses to produce PV panels, batteries, and EVs. If the agency included all the energy needed to refine copper, lithium, and rare earths, and smelt the steel, aluminum, and other metals needed for alt-energy products, the electricity total would be significantly larger.
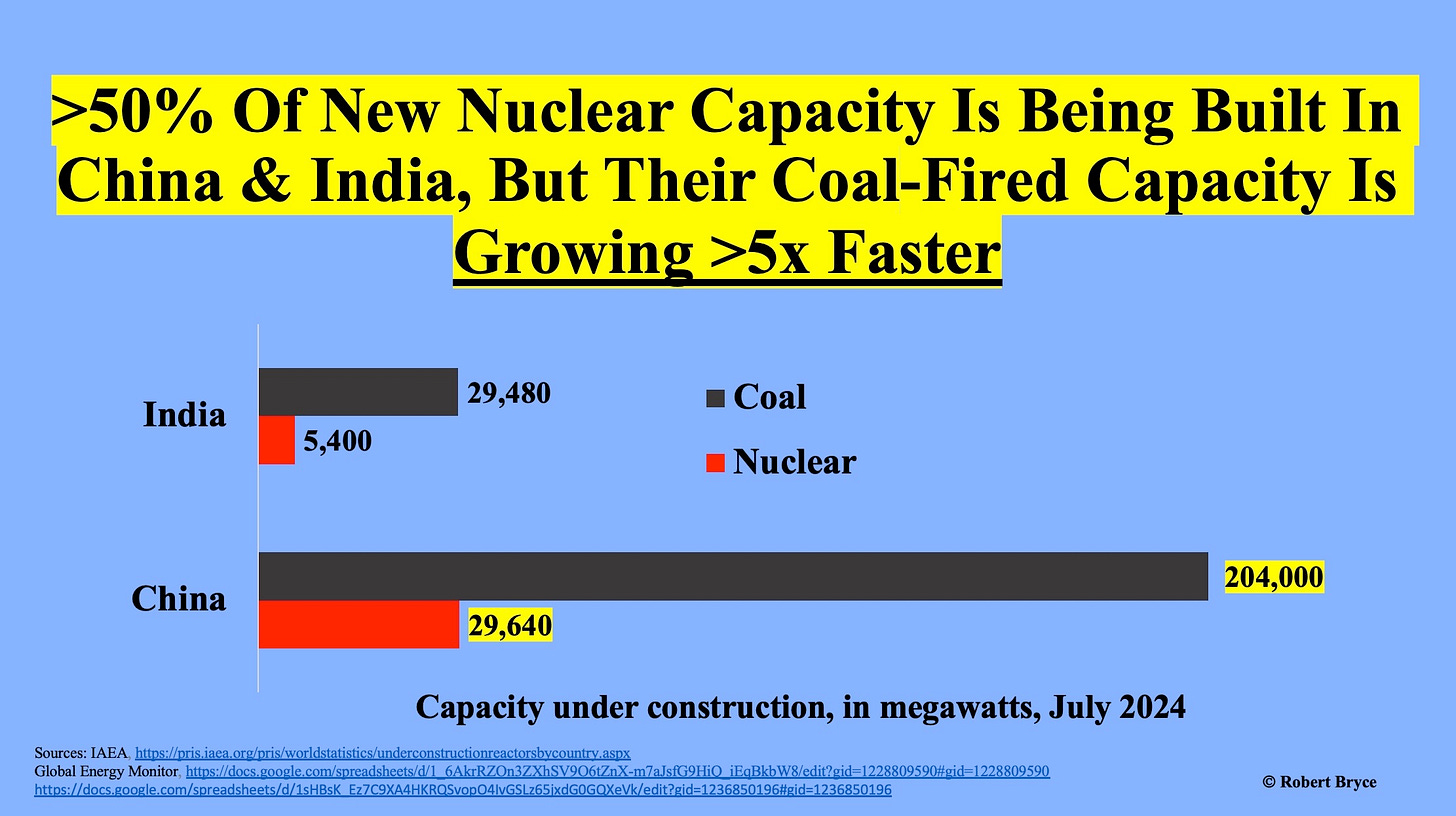
How will China meet its growing electricity demand? As shown above, according to data from the International Atomic Energy Agency, it is building more nuclear capacity than any other country. But King Coal still rules. According to Reuters, China’s coal imports hit a record high in 2024, with imports up 14.4% over 2023. In addition, the latest Global Energy Monitor figures show China is now building 204,000 megawatts of coal-fired capacity. Thus, India and China are building five times more coal plants than nuclear plants.
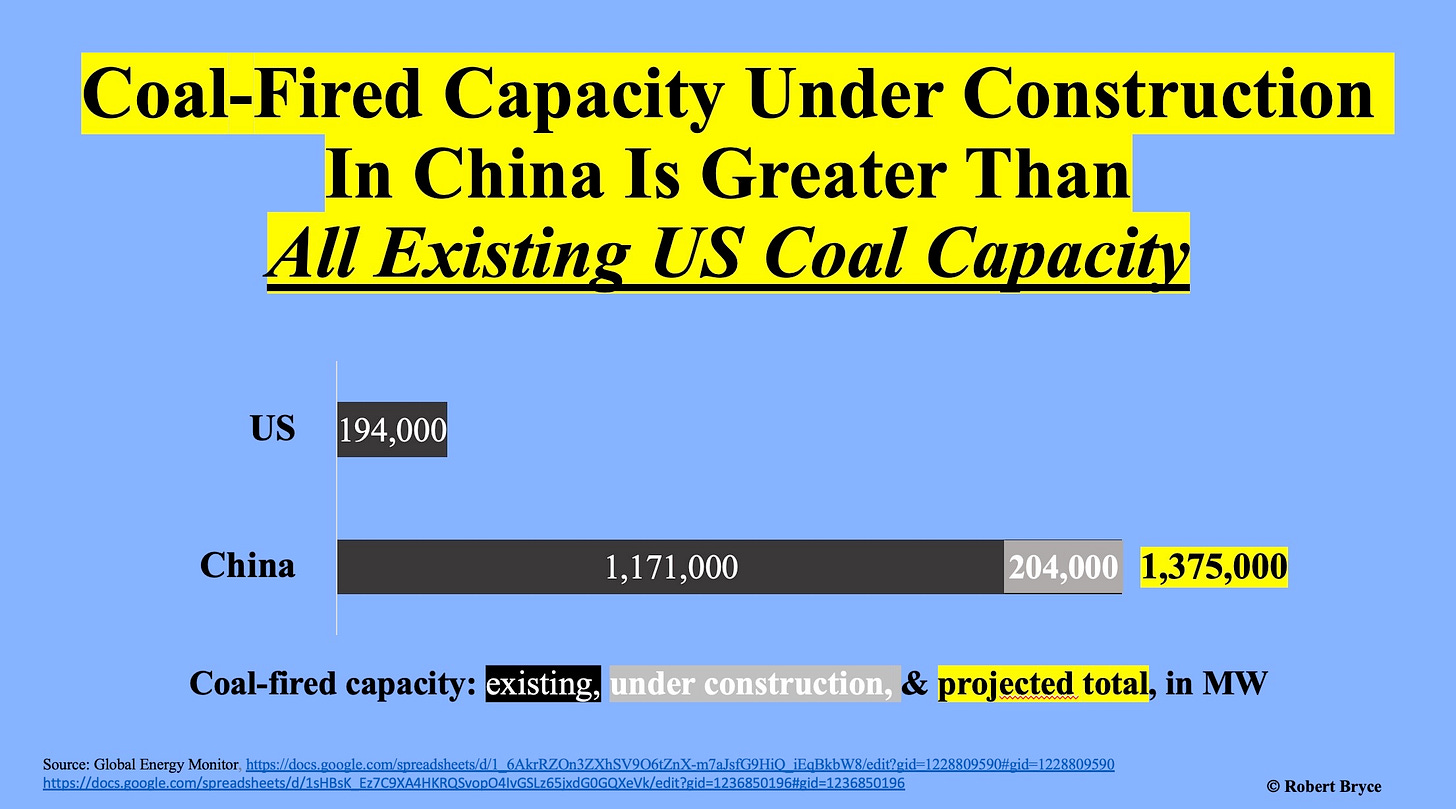
How does China’s coal capacity compare with the generating capacity of the US? As shown above, the 204,000 megawatts of new coal capacity being built in China is larger than the entire installed coal fleet in the US. (Note: Since 2010, US coal consumption has fallen by half.)
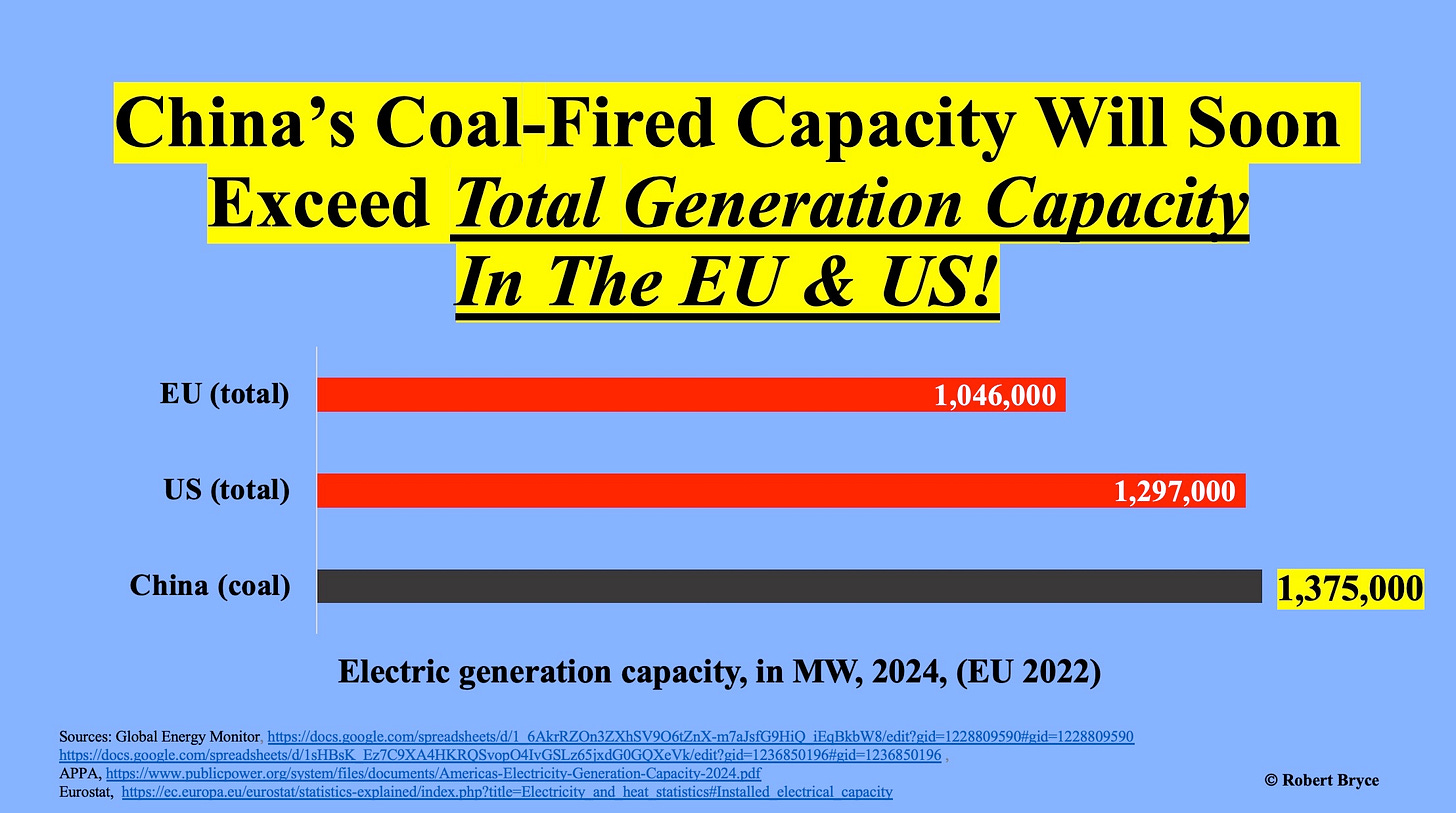
Here’s another comparison. As shown above, when China finishes the 204,000 megawatts of coal capacity now under construction, it will have nearly 1.4 million megawatts of installed coal-fired capacity. Thus, within the next few years, China’s fleet of coal plants will be larger than all of the generation capacity — including coal, gas, nuclear, solar, wind, oil, biomass, and hydro — in the US. It will also be larger than the EU’s entire generation capacity.
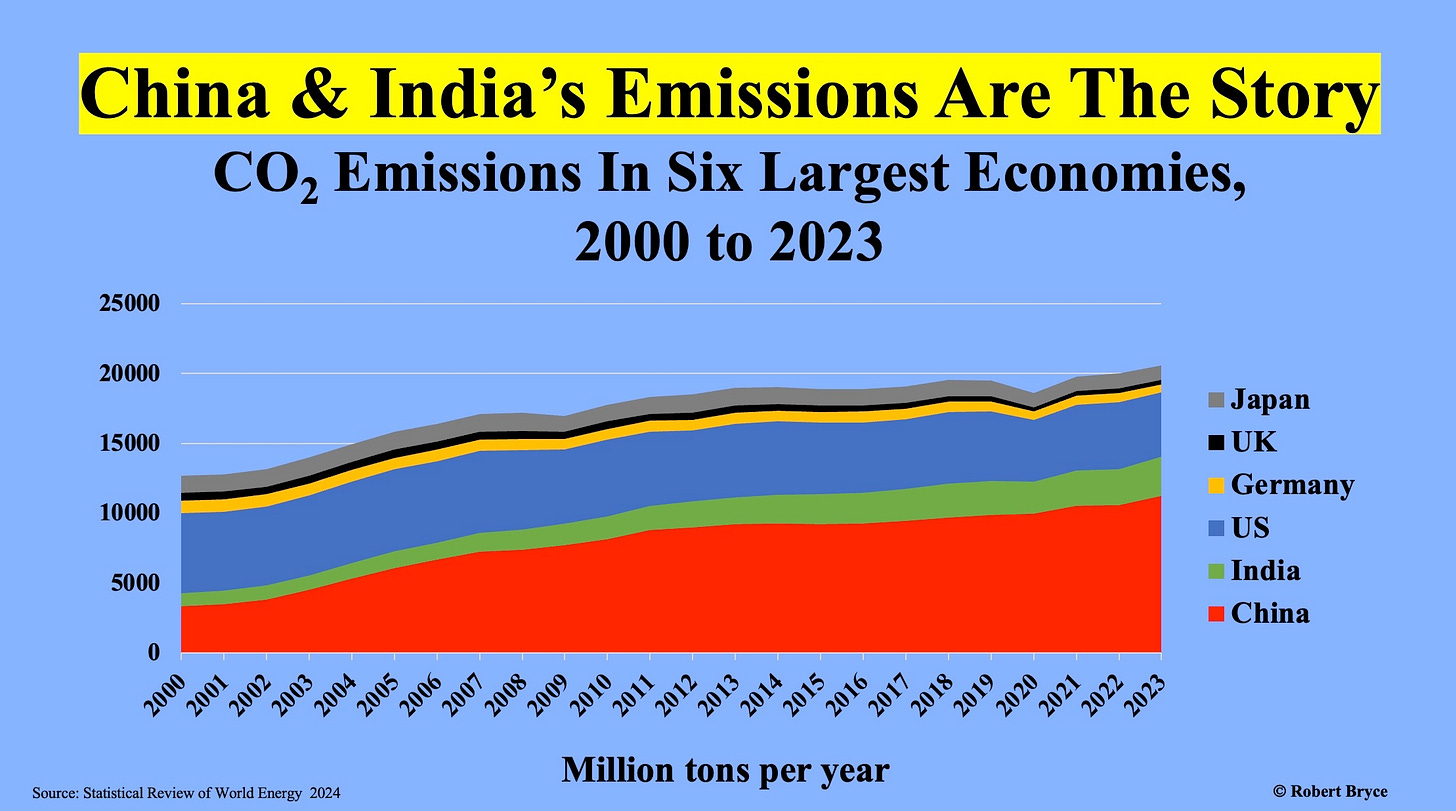
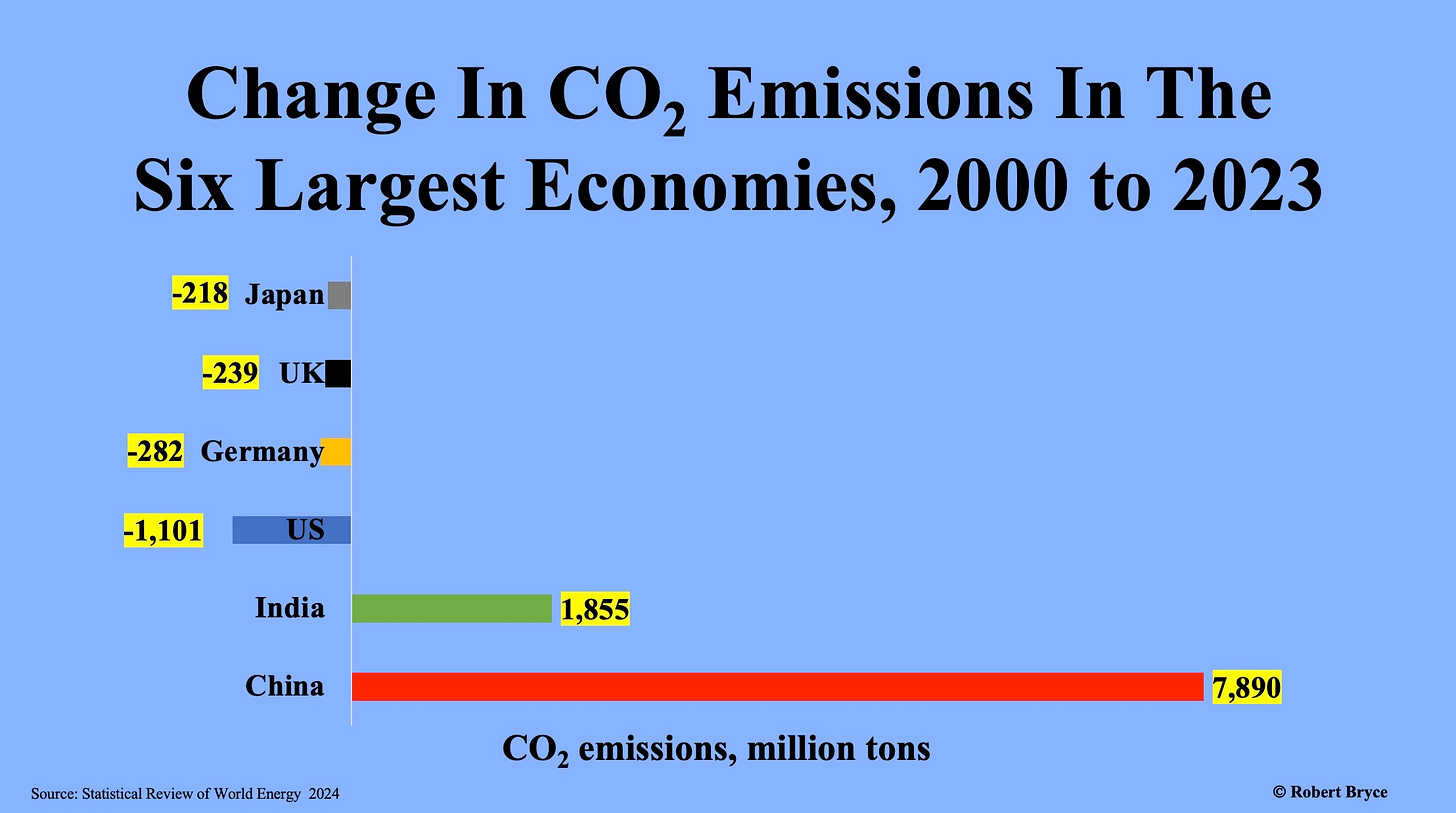
As seen above, the soaring use of coal in China and India is resulting in massive increases in CO2 emissions. The growth of those emissions is obliterating the decarbonization efforts in the US, Germany, the UK, and Japan.
This chart (which I have published several times) uses the same numbers as the preceding one but provides a higher-resolution look at the comparative numbers. While both charts use data through 2023, it is reasonable to assume that the 2024 CO2 numbers will show a similar trend.
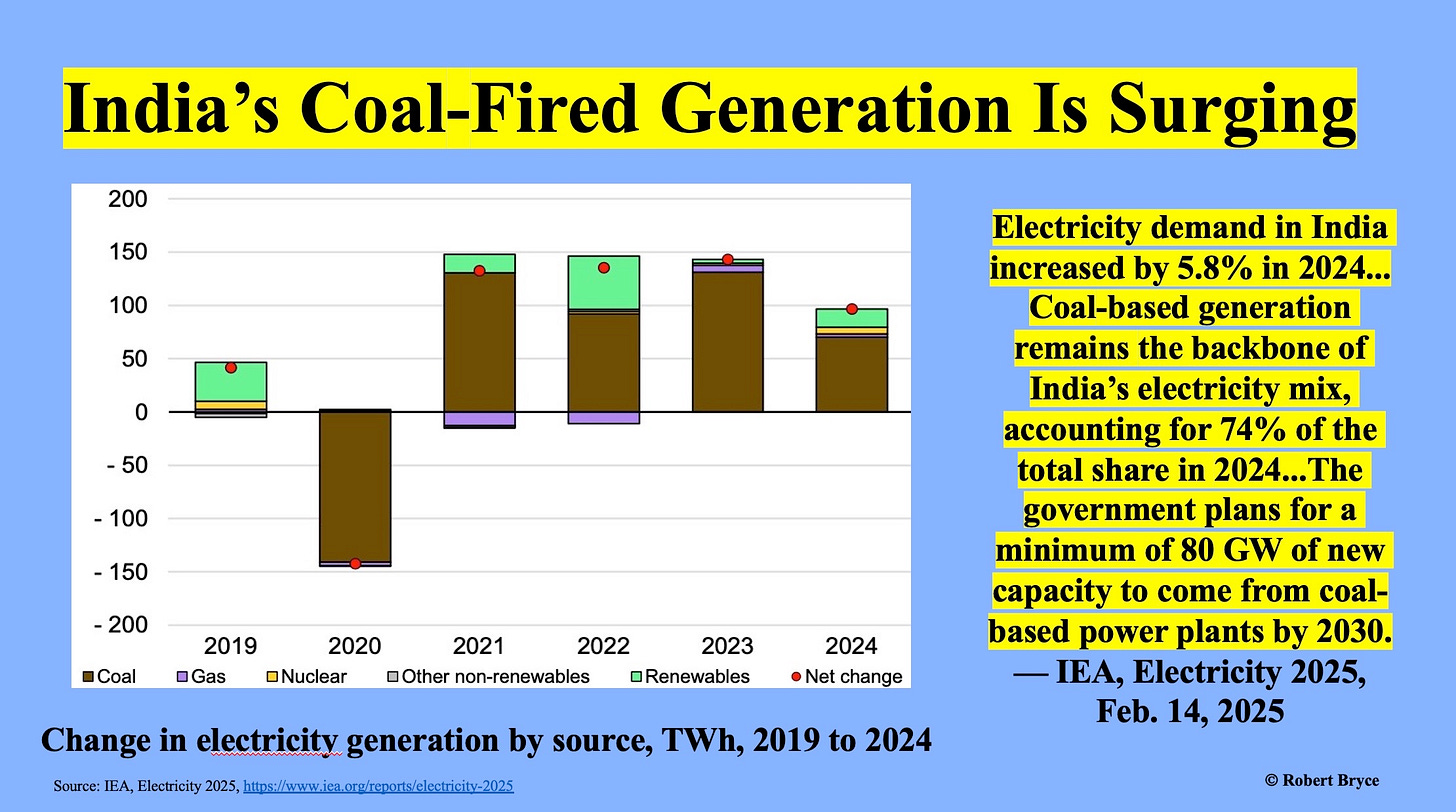
Finally, let’s look at India, where electricity use and coal consumption are soaring. The IEA reports that electricity use in the country jumped by 5.8% in 2024. That jump in electricity use was fueled by “a rapidly expanding economy that is estimate to grow by 7% in 2024.” The IEA also reported that “Coal-based generation remains the backbone of India’s electricity mix, accounting for 74% of the total.”
As Reuters explained last month, India’s coal power emissions hit a new high of 1.2 billion tons of CO2 in 2024. Reuters also reported that India is building significant amounts of alt-energy, including 29,000 megawatts of solar and 6,300 megawatts of wind capacity. But as seen above, most of the growth in India’s electricity generation is coming from coal plants, and the IEA expects “a minimum” of 80 gigawatts (80,000 megawatts) of new coal capacity to come online in India over the next five years.
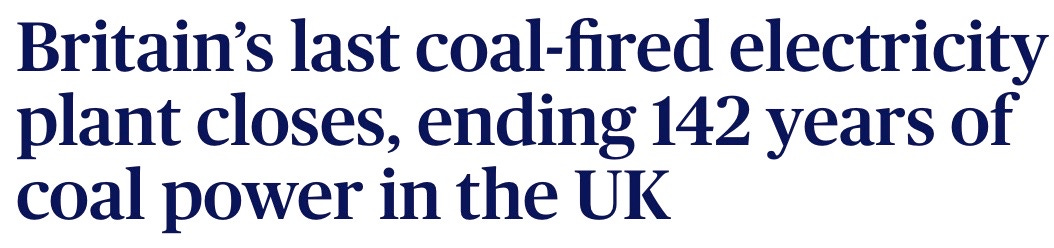
While China and India are building coal plants, and lots of them, western governments are touting their moves away from coal. Last September, the last coal-fired power plant in the UK was shut down. The BBC celebrated the news, saying the UK was the “birthplace of coal power,” and it was now “the first major economy to give it up.” The UK’s energy minister, Michael Shanks, claimed that while the UK’s coal era was ending, “a new age of good energy jobs for our country is just beginning.”
I will be writing more about the coal sector in the coming weeks, including a look at President Trump’s call to open “hundreds” of coal plants in the US. I wouldn’t bet on that happening. Nevertheless, it’s clear that the climate and energy policies in the UK, US, and other developed countries are becoming irrelevant.
Unless or until China and India decide to burn less coal, global CO2 emissions will continue rising.
Overall economic growth accelerated in March from February, driven by a sharp acceleration in services activity, which bounced off the 15-month low in February – with “companies reporting improved new business inflows amid some signs of strengthening customer demand and better weather compared to earlier in the year.”
Some of the businesses reported that the acceleration in services comes “after adverse weather conditions had dampened activity across many states in January and February.”
Manufacturing pulled back in March from the spike in February, which had been the largest increase in output since May 2022, according to the “flash” composite Purchasing Managers’ Index by S&P Global today.
“Factories reported fewer instances of output having been buoyed by the front-running of tariffs, and new orders growth came close to stalling in the goods-producing sector. Input buying in the sector also fell back into decline,” the report said.
“However, export sales showed the smallest decline for nine months thanks to rising orders in particular from Canada, Germany and other EU countries, hinting at some further efforts to fulfil orders ahead of tariff implementation,” the report said.
Employment rose “slightly” in March from February, led by renewed hiring in services, while manufacturers cut headcount for the first time since October.
Indicative of 1.5% Q1 real GDP growth.
The services and manufacturing survey data are “indicative of the economy growing at an annualized 1.9% rate in March and just 1.5% over the quarter as a whole, pointing to a slowing of GDP growth compared to the end of 2024,” when real GDP grew by 2.3%.
So slower growth than in Q4, and slower than the 15-year average of 2%, and a tad slower than Q1 2024 (1.6%), but it would be far better than the recession everyone has been clamoring about.
“Competition limited the pass-through of higher costs to selling price.”
Input prices – cost for companies, including staffing costs – “accelerated sharply, especially in manufacturing, to a near two-year high, often attributed to the impact of tariff policies,” the report said.
“Cost pressures intensified across the economy in March. Across both goods and services, input costs increased at the sharpest rate for 23 months, surging especially in manufacturing (where the rate of inflation hit a 31-month high) but also picking up further pace (to an 18-month high) in the service sector.”
“Higher costs were first and foremost attributed to tariffs, though increased staffing costs were also widely reported,” the report said.
“Higher costs fed through to a steeper rise in manufacturing selling prices, which rose in March at the sharpest rate for 25 months.”
Many of these manufacturers’ customer are not retail customers, where measures such as CPI track inflation, but other companies, including construction companies, companies assembling the components or materials into finished goods, etc. And there often is another layer, such as retailers, between them and consumers. And passing price increases on through that chain is very difficult. Big retailers – from Walmart and Target on down – are currently in tough negotiations with their foreign supplies to eat some or all of the tariffs because they know how tough it difficult it be to pass on the price increases to consumers without losing sales.
“Which will harm profits.”
Selling prices: In terms of services, “competition limited the pass-through of higher costs to selling price,” the report said.
“The March survey also saw a modest acceleration in services selling price inflation, albeit to a level that was historically subdued as firms reported the need to offer competitive prices in a weak-demand environment,” the report said.
“Thankfully, from the Federal Reserve’s perspective, services inflation remains relatively subdued, but this reflects the need to keep prices low amid weak demand, which will harm profits.”
“The resulting combined increase in prices levied [selling prices] by companies across both sectors was the second largest seen over the past six months – surpassed only by the rise seen in January – but remaining below the survey’s long-run average,” the report said.
The numbers: above 50 = growth, below 50 = decline.
The Flash US PMI Composite Output Index jumped to 53.5, a three-month high, up from 51.6 in February, a 10-month low, according to the preliminary reading today, which captures about 85% of the data.
The Flash US Services PMI Business Activity Index jumped to 54.3 (faster growth) from 51.0 in February (slower growth).
Flash US Manufacturing PMI fell to 49.8 (slight decline) from 52.7 in February (faster growth).
Enjoy reading WOLF STREET and want to support it? You can donate. I appreciate it immensely. Click on the mug to find out how:
We are seeing some notable trends in the energy and finance markets. Energy Policies and laws incorporating the Net Zero mandate from governments have started breaking into two camps. Countries that are heading to Net Zero are having more financial problems, and those that are not moving to Net Zero are focusing on increased GDP and growth. You won’t want to miss the Energy Realities team from Bulgaria, the UK or Canada, and the US as they cover these trends. The hosts, David Blackmon, Irina Slav, Tammy Nemeth, and Stu Turley, have great information from different viewpoints and backgrounds.
Highlights of the Podcast
00:11 – Introduction
02:12 – Net Zero and Global Division
08:31 – Heathrow Power Outage & Net Zero Failures
14:14 – Corporate Shift Away from Net Zero
21:14 – Carbon Border Adjustment Mechanism
24:12 – Media Censorship & Throttling of Net Zero Discussion
33:27 – Carney Defends Carbon Strategy, Say Trade With Europe, Asia Dependent on It
36:48 – Ed Miliband admits his solar panels bought for English schools and hospitals are Chinese and may be made using coal
43:08 – Banks picking sides
44:24 – The Fossil Industry Gets Its Revenge on Green Activists
47:07 – The Business Case for Green Energy
47:21 – Tesla’s Electric Dream Collapses As Carmaker Possibly Enters A Blackberry moment
51:58 – The UK’s Heathrow Power Outage sheds light on Net Zero Policies
53:05 – Trump,Zelensky Talk Cease-Fire Conditions in Phone Call – US Looks at Nuclear Power Plant ownership
55:20 – Global Energy Strategies & U.S. Policy Impacts
Irina SlavInternational Author writing about energy, mining, and geopolitical issues. BulgariaDavid BlackmonPrincipal at DB Energy Advisors, energy author, and podcast host.Principal at DB Energy Advisors, energy author, and podcast host.Tammy NemethEnergy Consulting SpecialistStuart TurleyPresident, and CEO, Sandstone Group, Podcast Host
Net Zero is Dividing the World
Stuart Turley [00:00:11] Well, hello, everybody. Welcome to the Energy Realities on Monday Morning Live on X, YouTube, and LinkedIn. We have a wonderful show. We’re waiting for Tammy Nemeth from The Nemeth Report. She’ll be here in a little bit, but we’ve got David Blackmon. David Blackmon is a legend in my mind. He is absolutely all over the planet at the Daily Caller, Forbes, and… Everywhere you can possibly imagine, David, welcome, how are you today?
David Blackmon [00:00:43] I’m glad there’s one person who thinks I’m a legend, Stu, always comforting to know. I’m fine
Stuart Turley [00:00:50] you. You’ve you’ve had a lot of great things coming around the corner and here comes Tammy and she’s rolling into the stage. We have also Irina Slav and Irina is also over there at Oilprice.com. She’s got her own substack and I mean, I absolutely love your substack. She is a great authorist out there or author. How are you today?
Irina Slav [00:01:19] Great, thank you, Stu. It’s a lovely spring day.
Stuart Turley [00:01:23] Oh, how’s the gardening going?
Irina Slav [00:01:25] It’s going well now that it’s warmer, everything is growing, including a lot of weeds, but we’ll take care of that.
Stuart Turley [00:01:32] Oh, outstanding. I’ll tell you what, we have got a heck of a show. I’m Stu Turley, president of the Sandstone Group. And I’ll say what, Net Zero is dividing the world into those that have energy and those that do not have energy. And it’s also a… a strong correlation between fiscal responsibility, those with GDP growth, and those without GDP growth. So this conversation is not only just is net zero dividing the world, what kind of shape is it going on? David, what are your thoughts there?
David Blackmon [00:02:12] Well, that’s absolutely right. And I think, you know, there’s a general awakening that net zero is actually an unattainable goal and even another awakening that it is a scam and always has been a scam, a tool to use to invoke global style, authoritarian style of government over all free countries. And we see that happening in real time in Germany. You see it happening in the UK, see it happening in New Zealand, Australia, Canada. And we did see it for four years happening in the United States. Luckily, we still have free elections in the United States sometimes. And last November’s election went the right way. And so we’ll get a four-year respite from it. I think even Al Gore, Al understands, and I want to reference an op-ed he wrote at the Wall Street Journal last week. understands that the fraud that is net zero goal is dying. And he wrote a piece in the Wall Street Journal last week in which he admits and chronicles catalogs a series of withdrawals from international agreements by big investment houses, by insurance companies, you know, in both Europe and the United States from these net zero alliances that are falling apart. And he talks about the fact that the United States and EU governments are backing away from some of their net zero goals now. United States is just willy-nilly going to cancel everything by the end, at the end of the day. That’s another topic for another show. But then the rest of his piece focuses on trying to encourage the big investment houses and companies to continue to ramp up their investments. and low carbons, energy solutions, and spends several paragraphs touting his own scam in that realm that he’s a partner in. So even Al Gore understands the world is changing, and it’s changing very rapidly. The landscape is changing very quickly, where climate alarmism is concerned. I think it’s a net positive for the whole world that the United States is now playing leading role in making that happen. And over the weekend, one last thing I want to reference, while all these countries in Europe, the EU and Germany, UK and others, are still, you know, maintaining their headlong dash into this net zero madness, deindustrializing their economies, the Prime Minister of India put out a very public post on Sunday celebrating the fact that India has now achieved a record level of coal production. That’s what India’s proud of in the energy space. And at the same time, China, of course, last year permitted the building of more new coal plants in a single year than all the existing fleet of coal plants in the rest of the world. So without India and China on board, net zero is a fantasy. It was always a fantasy even with them on board. Certainly can’t succeed without them on-board and the whole thing is falling apart. So. We even see Al Gore now preaching an alternative narrative, and that’s a net positive for everybody.
Stuart Turley [00:05:43] David, this brings up a point that you had shared out on LinkedIn from one of your friends out there. I’m not sure where this came from, but this is a beautiful representation and we take a look in the 1800s for our podcast listeners out in the 18 hundreds there’s wood, you know, sticks and then you come over here to the 2000s and you look at coal oil gas nuclear. And it is really renewables on the trillions of dollars of renewable unsustainable energy, how much it’s really added to it. And it’s not that much. I mean, it’s less than.
David Blackmon [00:06:26] amazing graphic. It shows basically that we still get about 80% of our primary energy from fossil fuels today, despite $20 trillion in subsidy investment for renewable energy, which is essentially the same percentage that fossil fuels provided in 1995. So there’s been virtually no change in primary energy delivery. The other thing that shows, well, it doesn’t show because It only goes through 2020. So it doesn’t show the last four years of the ramp up again in what they call traditional biomass, which is essentially burning wood for energy. Right. You know, we began, England began its transition from away from burning wood for energy to burning coal in the 16th century, 500 years ago. And last year we burned a record amount of wood for energy, an all time record high global. Energy transitions never eliminate the existing fuel source. They only add to fuel sources. And that’s exactly what’s been happening in this quote, energy transition, we’re supposed to be in the middle of. So it’s a great, it’s wonderful graphic. I wish I knew exactly who created it, but I don’t.
Stuart Turley [00:07:46] Speaking of bio.
Irina Slav [00:07:47] How demand is rising.
David Blackmon [00:07:50] Yes, and the land has just spiked since, you know, one of its ministries.
Stuart Turley [00:07:57] Tammy, speaking of biomass Heathrow had a horrific issue and let me show you what on Heathrow’s had a power outage was it Thursday evening, Friday morning, our time and something like that. And Heathrow’s emergency backup systems went to net zero. for biomass reasons and their infrastructure is absolutely horrific. So let’s go to this video here.
Video Speaker 1 [00:08:31] requires a backup and I can exclusively reveal this morning to you your viewers and your listeners having spoken to an industry expert it appears that Heathrow had changed its backup systems in order to be wait for it net zero compliant and therefore they had got rid of their diesel generators and had moved towards a biomass generator that was designed not to completely replace the grid but work alongside the grid and therefore basically their net zero compliant backup system has completely failed in its core function at the first time of asking. I mean it beggars belief.
Stuart Turley [00:09:17] And so when you sit back and kind of go uh Heathrow going down is absolutely horrific. Tammy, how are you this morning? You’re having some technical difficulties this morning.
Tammy Nemeth [00:09:29] Yeah, I don’t know, I must be because I was working on the carbon border adjustment mechanism article and it just my computer function. So I’m on my iPad. I have to move around the house because it uses the Wi Fi and our old house that’s parts of get a good signal. So yeah, I know the the Heathrow thing was very fascinating. Catherine Porter on what logic had a really great detailed assessment of the grid and what the what they were supposed to do and whatnot and and I forget if it was she or someone else had talked about some of the American airports have backup electricity so that they could run for days without being on the grid. So it’s like Heathrow which is like one of the biggest airports in the world. doesn’t have that and that supposedly this backup system is not really a backup but is it runs these other things in parallel? I don’t know. The whole thing is
Stuart Turley [00:10:34] You can go to energynewsbeat.co and their first article up there has got a detailed history on it on my substack as well. It’s pathetic.
Tammy Nemeth [00:10:43] It is. It is and you know that this is what I find so interesting and contradictory because on the one hand the environmental people who are part of the climate change committee want to shut down air travel except for certain times for people or you know for the elites and that kind of thing. But then there there’s others who are encouraging like Rachel Reeves who’s a die-hard socialist and full on with this green stuff. wanted to expand the runways at Heathrow and was giving approval to expand the runway at Heathrow. And in Canada they’re trying to encourage the pension funds to take over the investment in airports. So on the one hand they’re like we’re going to shut down the airports but we want pension funds, to invest in them and we’re going to expand airports but who’s going to be using them? I understand. So it’s one of these you know, green contradictions that we talk often about on the channel.
Stuart Turley [00:11:49] So, Irina, what do you think about the EU in net zero?
Irina Slav [00:11:55] Well, I think companies are moving in the opposite direction of governments from what I’ve been reading, you know, all these companies, not just in the United States. But some European companies, large companies, are reconsidering their net zero pledges and commitments and the sustainability language. There was a new story in the Financial Times just a couple of days ago, was it today, I can’t remember, saying that the FT just went and looked at companies websites about their commitments and slashing emissions and all that. and they have pulled these texts. I’m sure that pretty much everyone is doing it in the corporate world. Some of them are blaming Trump, of course, the Wall Street Journal is blaming Trump. He told Trump’s fault because of this pressure. But I think, as I’ve written in my sub Saturday, that they’re doing it with a deep, deep sigh of relief that now they have an excuse to start walking back these commitments. But the governments in Europe. Well, the central brain of the thing, of this creature that the EU has become is still doubling down on stupid. It will take a while before they realize that corporate money is not coming because they don’t want to waste this money. And another interesting story that confirms this is from China, it’s from Bloomberg where The Chinese corporate world has realized that they have reached the point of over-saturation with solar, specifically, and there was one guy, an executive, I think, saying that coal and gas are going nowhere because they’re providing very, very necessary backup, Heathrow Airport, backup, wind and solar, because they can’t operate without backup. hence all these new coal power plant approvals last year. Diverging paths between corporate and government is going to be interesting.
Stuart Turley [00:14:14] I think we’ve got a video Tammy that really shows someone that understands net zero and T and I think that when we sit back and understand the people that are defining it net zero financial policies and energy policies may not have all the information but let’s let’s hear your thoughts on
Video Speaker 2 [00:14:38] Because I’ve never had any before, so I’m trying Sleepytime Tea, and I got the big one because I’m assuming that I’ll probably like it. So I’ve got this out of the package, it’s just the square of tea, I think it’s pretty self-explanatory. I already have my.
David Blackmon [00:14:58] Pause it, Stu, can you pause it? Everybody needs to understand this is a 2021 clip of Jennifer Granholm developing energy policy at the Department of Energy.
Video Speaker 2 [00:15:15] And then you just dump it in. I’m gonna get a spoon quick. All right, so you just stir it around and I’m assuming it’ll dissolve into the tea at some point. Maybe just in a couple minutes. It’s been a few minutes and nothing has happened. I tried it obviously and it is a total mess so they really should make something that contains it. Otherwise, it just goes everywhere. 0 out of 10.
Tammy Nemeth [00:15:46] Oh my gosh, is this for real?
Stuart Turley [00:15:49] Perfect example of energy policy based on climate activism without an understanding of physics or fiscal responsibility.
Tammy Nemeth [00:16:01] Well, unless they were, there was that study that said tea bags like that are sources of microplastics or something.
David Blackmon [00:16:09] Oh my god.
Irina Slav [00:16:11] How do they make this paper?
Tammy Nemeth [00:16:13] I don’t know, but this is what the study said, that you shouldn’t use tea bags like that, because it puts, I don’ know, some chemical in.
Irina Slav [00:16:22] I’m fine, the cleaner! UGH!
David Blackmon [00:16:27] I want to reinforce a point Irina made about the changing corporate language around climate change and the fact that they’re backing off these commitments. Everyone should think back. If you ever have watched investor presentations by the CEOs of these big corporations, think back to the 2020 through 2022 time frame. And if you watched any of those, listened to them, you would the CEOs of major oil companies, coal companies. every company you can imagine leading off their investor presentation with their climate change commitments and their ESG plans and all this stuff that was not central to their core business. I listened to, well, I won’t say which company, but the investor presentation of one of the big oil companies back in February. Zero mention of any of that other and the investments, their business unit. on these kinds of projects are making and the profitability of those projects, not the climate impacts of the projects, but the profitability. It’s a complete change of priorities, complete change in language. It began at the end of 2022, early 2023, we saw the first manifestation of it at Air Week Conference in 2023 when there was just this big focus. on energy security rather than climate change and it’s only expanded since then. And it’s a welcome change because these companies are focused back on their core businesses and doing what they’re supposed to do, which is maximizing profits for their investors.
Tammy Nemeth [00:18:11] Okay, so I will add to that with the because I’ve been doing all this research on the carbon border adjustment mechanism, which kicks in for real next year. So right now, it’s been a transition for how companies should calculate their emissions and how they should set up their infrastructure to do so. And then this whole process for reporting. Now everybody thinks with the carbon boarder adjustment mechanism. It’s just a tariff. But it’s more than a tariff. It creates an entirely new bureaucracy in order to calculate, verify, report, and then decide how much an importer will have to pay for whatever they’re importing. Now, right now it’s six major high-emitting commodities or products. But eventually there’ll be everything that’s on the European trading system. So by 2030, it’s almost everything. So for the EU, it’s great that the companies are like, well, I don’t really wanna have to talk about this. Let’s sort of move back to our main focus and everything. But there’s no moves to get rid of this. They’re doubling down on it. And by 2030, it will cover almost every product entering the European Union. So I mean, people could, maybe companies should say, well,I don’t wanna deal with the EU. I don’t want to export because we’re going to have to. do invest all this money into counting our emissions. And it’s not that they care about what your environmental regulations are. Like if you’re really looking, you have all these regulations for managing the water and the land or your employees. So they don’t care about any of that. They only care about what your embedded emissions are. And it goes through the entire supply chain. So one, two, and three. So it’s crazy. And on the one hand, it’s when we talked about the bifurcation last year, where you had the bricks going in one direction, and you had the western nations with the EU, and the G7 and everybody on the other. And now that America is joining basically where the bricks were at, in saying, we don’t want to have to do all this stuff. But then at the same time, you have California introducing carbon disclosures. You’ve got New York just introduced it. I think Illinois might have been introducing something in their legislation. So you have blue states that are going to be demanding this information. then you have people who are going to have to export to the EU or they’ll have to find a different thing. So there’s all these divisions taking place and what that will mean for how companies operate, where they trade and all of that. I think we’re just sort of at the beginning of how this is all going to play out.
Stuart Turley [00:21:14] Tammy, you just nailed a huge home run mess. And congratulations on Monday morning here in the United States for what a mess. But an honest question is the Obama era EPA regulations of putting in CO2 as a pollutant, which is actually plant food. And you sit back and kind of go, wait a minute. the place gets greener with CO2. It’s the pollutants in particular matter in a coal plant or the other kind of things that that redefinition is going to go on. What do you think as a world, and I’m going to open this up to the panel, net zero or what does the redefiniton of CO2 mean to the rest of the world for net zero?
Tammy Nemeth [00:22:04] That’s a great question. I don’t know how that’ll play out. I think countries like India will say, wow, that’s great. We don’t have to worry about that anymore. China is trying to play all sides. I mean, one of the articles I’m going to talk about is the UK going over there signing who knows what deals memorandum of understanding. at the same time the UK government is announcing they’re going to put solar panels on every school and government buildings and so on. Where are you getting those from? Well, we’re going to buy them from China until we make them in the UK. When are you ever going to make them in the U.K.? Unless it’s a Chinese company that sets up here. With what energy? I mean, We don’t have the materials, don’t have the energy. So they’re just gonna keep importing container after container of Chinese solar panels. So China’s like, yeah, okay, we can report all this stuff because we probably with social credit already have all that data and information. And if not, we know we can make it up and who’s gonna verify it. Now, the EU market does have provision for verification and they will actually part in the little flowchart I saw, they will send inspectors to foreign countries to verify what they’re doing. I’m like, OK, how is that going to work? In China, are they going to hire local Chinese who will carry out the inspections? How does that work?
Irina Slav [00:23:33] And how do you verify these numbers, yeah, emission numbers, how?
Tammy Nemeth [00:23:38] Right. So they go there, they inspect their data or I don’t know, their processes, they want geolocation for where they’re getting their energy from. And I’m like, okay, well, China will say, we have these factories in this particular province, and they have X amount of solar and wind. Ta-da, we’ve got no green electricity, right? And who’s going to say, I’m sorry, China, we think you’re lying. Can we still have those solar panels you’re making for us? Like it makes. Anyway, so that’s my little thing for today.
Stuart Turley [00:24:12] Um, I noticed that I have zero views on X and I’ve had people sending, saying it’s not showing out there. So I’m even being throttled on X when you start talking about net zero.
David Blackmon [00:24:24] Yeah, and I’m being followed on Linkedin.
Stuart Turley [00:24:28] So everybody needs to subscribe to our substack so this can go out there. Unbelievable.
Tammy Nemeth [00:24:36] Are we streaming from Substack?
David Blackmon [00:24:40] Um, No no The Substack doesn’t have that capability unless you use their tool.
Stuart Turley [00:24:47] Right.
Tammy Nemeth [00:24:47] OK.
David Blackmon [00:24:50] but we will repost this at Substack.
Stuart Turley [00:24:53] Right.
David Blackmon [00:24:54] And on YouTube.
Stuart Turley [00:24:57] But you know,.
David Blackmon [00:24:57] Our problem is with YouTube is that they’re gonna throttle it and it’s hard to find. And so yes, the thing for people to do is check our various Substack
Stuart Turley [00:25:07] The, you know, this whole thing of policies generated by people on the left have a negative impact. And we’re seeing that play out with Tesla. Tesla is a great brand. I, you, I want the choice to be able to buy an electric car or not buy an electric car. And if I buy an electric car, I’m buying a Tesla. I like the fact that it’s going to be able to make. life better for people for driving longer periods of time. I’ve got a 90 year old dad. I’d love to be able to see him drive till he’s 95 with a Tesla, an auto driving Tesla. But why is the left being so bad? So the people making left-wing decisions is like a wife doing something really bad to a husband. I mean, there are things that just shouldn’t be done. Now, imagine if you’re making policies and you put all these airheads. I don’t understand that analogy. But if you make all these policies, it’s like putting a bunch of airheads in lemonade and then forcing the rest of the public to drink it, like this poor woman did to her husband.
Stuart Turley [00:26:58] People that make policies think that they’re giving us lemonade, but it’s actually so tart we cannot even stand it when we start failing as an economy.
Irina Slav [00:27:11] They keep asking, why aren’t you drinking the lemonade? It’s so good for the planet.
Stuart Turley [00:27:17] And a shout out to Gayle. She’s seeing it on LinkedIn. And Patrick, you’re on LinkedIn and Greg is on your LinkedIn. So, it’s not totally shut down. Oh, cool. Sorry. I like all forms of if you hate us, give us your feedback. That means you’re watching
David Blackmon [00:27:42] It’s like Lyndon Johnson. I don’t care what people are saying about me just as long as they’re talking about.
Irina Slav [00:27:48] It wasn’t wrong.
Stuart Turley [00:27:52] I like the, I actually like open discussions. And David, your open discussion is kind of like what the Biden administration did when they buried this report. This was a fairly huge story that LNG was shut down and our own president did not know that he did when he was speaking with speaker Johnson. And speaker Johnson goes, wait a minute, You did not. Shut down, LNG.
David Blackmon [00:28:26] So this story, the news media suddenly found this story this past week, late last week, and I look back and I had actually, someone had revealed this to me, and I think I know who it was and I probably shouldn’t mention, in Washington DC had revealed this to be and I actually wrote about it in a piece in the Daily Caller last September, but it didn’t make a lot of news at that time. And that is that DOE on this stupid, Ludicrous. LNG pause that Biden, Granholm, and John Podesta put into effect in January of 2024 and lasted a full year, had zero basis in anything resembling science. And it turned out that the Department of Energy, even though it pretended to be conducting its own study last year, it actually conducted the exact same study in 2023 and found that LNG exports and LNG production globally is actually a net benefit to the United States and both environmentally and economically. And of course, Jennifer Granholm and the people at DOE decided, well, we have to hide that 2023 study because we’re pretending to conduct the same study in 2024, but they didn’t succeed in hiding it permanently. And so the media actually, reported on it last week, six months too late, but whatever, better late than never. And, you know, but it’s just the kind, it’s the links the Biden administration would go in order to create this insane suite of energy and climate policies, all based on hysteria about too much plant food and the atmosphere. And now, of course, we have an energy secretary and an EPA administrator. uh, who are going about reversing that and all that stuff. And of course, EPA is going to reconsider the endangerment finding. And I think we’ll succeed in reversing it. And that’s going to put every policy, both Biden and Obama put into place in real jeopardy of being reversed. Gail Campbell, Andrus. I have the same conclusion, but I’m coming at the net zero issue from a different angle. I am in the private sector and can make fuel efficient devices for transport trailers and large trucks. Yes. I cannot get introduced to anyone involved in carbon markets or carbon credit markets. I’m led to believe that carbon markets are fraud. Yes, a lot of us are led to belief that. US companies are interested in investing in my company until they find out I’m located in, oh God, okay. I should have incorporated in the US it seems, oh boy. Well, sorry you had difficulties, but she illustrates a really good point is, You know, none of this means that companies should or are going to stop investing in environmental friendly solutions. None of this means that’s going to happen.
Stuart Turley [00:31:30] The biggest thing.
David Blackmon [00:31:32] The ones that work.
Stuart Turley [00:31:35] And Irina, I think one of the biggest things that we see is it’s not that I’m sitting here with my oil and gas for executives for nuclear hat. I am an oil and glass kind of guy. But I love nuclear. I love no waste or no damage to the environment. That’s what this is all about. And you write about that all the time. I mean, it’s about the environment.
Tammy Nemeth [00:32:04] Yeah, it’s also about what works in the most in the best and most efficient way. And as we’ve seen with solar and wind, outside of certain niche areas, like where it’s really difficult to connect to the grid or something like that. It’s really an abuse of the planet, I would I would submit it takes up way more space in dangers way more animals and land and Water and air to some extent if you’re looking at hydro, for example, it I mean there’s Significant impacts on on the environment then you have the built environment Which apparently we’re supposed to care about except when it comes to that. There’s there’s always seems to be exceptions for pursuing this this ideology and It it’s it becomes an issue if there’s something better that comes along Like fusion or whatever. I would absolutely jump on that, you know But it’s not there yet. And until those things are there, the best that we have are oil, gas, coal, hydro in some areas that have already been developed, and nuclear.
Stuart Turley [00:33:19] I’d love to see nuclear exported from countries that have it to those that don’t. And Tammy, on your stories this week, you had Carney defends carbon strategy. Holy smokes, Batman. What a good timing. This was a great, you know, intro to your stories. This week says trade with Europe, Asia depends on it. I’m not sure this guy, I don’t know.
Tammy Nemeth [00:33:43] He’s right about, so he’s the new leader of the Liberal Party and I guess as Prime Minister, but he called an election yesterday, so we’ll have our election at the end of April. And he, his very first trip was to jet around to Paris and London, a really quick two-day trip, where it looks like he was trying to stay, try and get Canada to be able to buy or be involved in the new EU defense. procurement stuff and is looking to buy European equipment, I guess, or something instead of American, which, you know, what’s the interoperability with NORAD and, you know, whatever continental defense. I recall Canada bought some European little light trucks or something back in the late 80s, early 90s that were terrible, couldn’t even run in the winter. So, you know, we have a history of making poor decisions with respect to defense procurement, especially with our relationship with Europe. Anyway, but what he said there is that when he talks about carbon strategy, he’s talking about mandatory climate disclosures and carbon tax. So he’s got rid of the personal carbon tax that everybody could see that everyone was paying and it was very visible. So he got rid that, he set it to zero, but is going to increase what is currently being charged to industry. So industry will end up picking up the slack for whatever they were charging for individuals and he’s saying we absolutely have to have it in order to trade with Europe because of Europe’s carbon border adjustment mechanism. And it requires mandatory climate disclosures. It requires being able to account and verify your emissions. And then if you have a carbon tax, it gets deducted off what you would have to pay through this tariff. Then he said Asia depends on it. Actually Asia doesn’t. And so that was just a straight up lie or he was misspeaking, I suppose. So, um, where he says you you need it for Europe absolutely but we have eight percent of Canada’s trade goes to the European Union why would you want to increase that and then on the one hand he’s complaining that America wants to make us a 51st state but then he said let’s go join the EU so how is that any different in fact it’d be worse if Canada were to join the you because member states. are forced to put into their own law what the European Union decides. So you really have little control over what you’re doing. It has to be in complete alignment with what Europe is doing or the European Commission. So that would actually be worse for Canada than if it were to have some kind of relationship with the United States. And then, as I mentioned before, Ed Miliband jetted off to China, was there for a couple of days. for signing these memorandum of understanding and the solar panels that he’s buying to put on all English schools and hospitals are made in China and will likely, oh yeah, they might be used, made using coal, might be, probably, you know, like, come on, give me a break. And if it isn’t using slave labor, yeah, you, know, from his perspective, doesn’t matter, We just need to have lots of solar panels and… We were driving around the UK countryside on the weekend and saw a whole bunch of really beautiful farm fields being solar panel installations going up, hundreds, if not thousands of acres of farmland being used for solar.
David Blackmon [00:37:45] One question, this personal carbon tax that Carney set to zero, wasn’t that personal carbon tax originally placed on citizens in Canada by his own political party?
Tammy Nemeth [00:37:59] Yeah, yeah. And that was going to this is what the conservatives have been railing on about for at least three years to the whole campaign was ax the tax. So Carney like, Oh, look, we did it. And so in typical hypocritical fashion, on the one hand saying, we’re not American, America’s bad. He then sets up a little table and pretends to do an executive order, which you can’t do in Canada, and then finds it like Trump does. I’m like, okay, so America’s bad, but let’s do copy them in all these different things.
David Blackmon [00:38:35] She just can’t make this stuff up.
Tammy Nemeth [00:38:39] Yeah, the carbon market scale, you’re absolutely right. You have to be in the in-group in order to participate in the carbon-market. Now, there’s a group where they’re putting some chemicals into the water in the sea off the coast of Nova Scotia in Halifax Harbor, where it’s supposed to capture… um co2 and turn it into stone or i don’t know something in the water and they’re getting carbon credits that they’re selling to companies like google um google alphabet meta i think was one of them microsoft was one there was like a list of about five companies stripe is the one that set it up mark carney used to be on the board of strike and so they set up this carbon market where if you’re actually removing CO2 and storing it away, then you can participate in the carbon market. But if you have to demonstrate that you’re actually storing it in order to be part of these things. So it’s kind of weird how they set that up.
David Blackmon [00:39:57] Canada could copy the US better if Alberta became our 51st state.
Tammy Nemeth [00:40:03] Interesting. Okay, that’s my thing. Thank you.
Stuart Turley [00:40:08] Good job. and your Substack
Tammy Nemeth [00:40:13] Yes, so it’s the TheNemethReport.substack.com and I’ve been working on this carbon border adjustment mechanism piece for a long time, but I realized it’s way too long, so I’m going to break it up into a couple of different parts, so the first part should be up today.
Stuart Turley [00:40:30] So put it as paid subscribers only. That would be the best way to do that.
Tammy Nemeth [00:40:36] Well, I don’t do paid subscriptions right now. I’m just, it’s just all out.
Stuart Turley [00:40:41] If you should and I let’s go to Irina next here. There we go, Irina.
Irina Slav [00:40:48] Thanks, but could I please address Greg’s second comment which presents it news?
Irina Slav [00:40:56] Germany anchors net zero by 20, 45 in constitution. Germany is on a suicide mission. Emissions from global construction sectors stop rising. Okay, are we sure? BYD unveils new EV tech to charge vehicles in just five minutes. Does anyone need any more evidence that the Chinese are killing it technologically? I mean, there’s no debate about that. Germany earmarks 100 billion euros for climate action, yes, because the party that won the elections needs green votes to pass these changes and it had to make promises. Germany has been in a recession for two years, all thanks to its climate policies. EVs are going to save you 20 million tons of CO2 emissions in 2025. If this is according to Amber, I’m sorry, but I’m taking it with a really big pinch of salt. And Germany is on track to hit 2030 climate goal of cutting emissions to 65% below 1990, of course, because they are in a recession, because there are industrializing. If you cannot afford to use the energy that you possibly produce, you will use less energy. and this will work towards hitting this emission target. So please, I mean, let’s be serious.
Tammy Nemeth [00:42:23] If you go live in a tent, you’re not emitting.
David Blackmon [00:42:29] Germany is the poster child for this. You depress your economy, you de-industrialize, you send all the emissions to China, and you pretend you’re helping here.
Irina Slav [00:42:39] Exactly, Germany is the case study that we all wanted to see, and the UK as well, and they’re both failing.
Stuart Turley [00:42:48] David, you also mentioned Germany, but I believe there is the close second behind that with the UK, New York, Delaware, California, and a couple others. Sorry, and I mean, here’s your stories for today.
Irina Slav [00:43:07] Well, that’s okay. Now, the first story I think I’ve already referenced, some of the stuff I’ve written in there about corporates walking back their climate commitments and pretending it didn’t happen and citing challenges and supply chain problems and all this. But ultimately, they’re going back. on what previously used to be their top priority, climate action, emission reduction, scope three reporting and all that. They saw it’s not working, they saw it not making money. So now they’re going back on these pledges. It’s not just banks, it’s all sorts of companies, Aviva, the insurance giant in Europe did just that. and Some companies in Europe, before they tied ESG performance to executives’ remuneration, now they are decoupling ESG targets from the compensation packages of executives because it’s not making sense and they’ll never make any money. So yeah, that’s that. What was the second story? Oh yeah, that’s a lovely headline from the Wall Street Journal, how the fossil fuel industry gets its revenge on green activists. This is not a revenge, this is justice, you people. Well, yeah, the green activists have been, you know, destroying stuff and protesting and interfering with people’s lives. I like this angle, tell me. Yes, and they have assumed that nobody will ever do anything to stop them and they will not be punished whatever they do, I assume short of killing someone. But now with this verdict against Greenpeace… Did you hear about the just top oil people who appealed their sentences but only some of them got reduced by a year and the others were upheld by the court, which is again a win. It’s not a matter of revenge, it’s a matter punishment for wrong action, for wrong doing.
Stuart Turley [00:45:32] I think the people that are actually terrorizing Tesla right now deserve their 20 years in jail when they do firebombs and those kind of things. I hope…
Irina Slav [00:45:44] And all the emissions from these fires, all these natural fires, that’s a serious emission generation going on that do they not care?
Stuart Turley [00:45:55] I want to know from our listeners, if they have any questions, but I’m hearing that everybody that I know is running out and buying a Tesla and they’re actually going to, I think Tesla’s, this is maybe a marketing strategy. I don’t know how, but I think that they’re, actually, I’m trying to find out how many Tesla’s- It’s gonna boom in their sales, yes. I think it’s actually increasing sales. I don’t know. I would want to see. I want to see numbers on it and I’m trying to find those but.
David Blackmon [00:46:29] We’ll see at the end of the month. Yeah.
Stuart Turley [00:46:31] Yeah, how do we find your uh Substack there.
Irina Slav [00:46:34] by typing Irina Slav on Energy or just Irina Slav plus Substack. And it’s right there on Google.
Stuart Turley [00:46:42] I love your articles also on oilprice.com as well, too. So those are.
David Blackmon [00:46:48] The headline to the shocking truth about actions. That’s perfect.
Irina Slav [00:46:54] A real shopper.
Stuart Turley [00:46:56] And let’s go to David next year. I’m trying to find your slide here. I think it’s this one. There you go, David.
David Blackmon [00:47:04] Okay, so the second one, let’s look at that first. That’s the op-ed that Al Gore wrote in the Wall Street Journal this week, and we’ve talked about that already. Al is very upset that the tide has turned against him and is beginning to lash out. Texas electric dream collapses as carmaker possibly enters a blackberry moment. This is from… an investment advisory website. I’m trying to remember what it’s called. God almighty, I can’t remember. Anyway, so their thesis is, we all remember that Blackberry was the personal handheld device that dominated the market for a decade before Apple introduced the first iPhone in 2007. And that step change in technology by Apple, which kept up and recognized societal trends and took advantage of the new technology. can introduce this step change in technology, collapse Blackberry. Blackberry still exists, but it’s a dramatically reduced market share company from what it used to be. So this Seeking Alpha is the website where this article appeared. You know, their thesis is that, well, you know, Tesla is facing the same kind of dilemma because of all these violent attacks on its infrastructure and its cars. I don’t think that’s true. I think actually this is a real buying opportunity for Tesla. The stock price has fallen by half since January and is a really good time for people to be investing in Tesla because what people don’t really understand about Tesla, it’s a highly diversified company. Yes, I mean, sales of its cars is its main revenue stream, but it is developing all sorts of other technologies that it is selling all over the world. and it’s a very robust business model at this point. It’s not the same one trick pony it was 10 years ago. Elon Musk is not a stupid man. He’s probably the most brilliant business mind of our generation and maybe any generation. And so probably this is a real buying opportunity to invest in Tesla, not a blackberry moment, but I thought it was interesting that that story got written.
Irina Slav [00:49:22] It’s really stupid because there’s no better technology in EVs. People are burning cars because they’re angry.
David Blackmon [00:49:30] They’re stupid and
David Blackmon [00:49:32] and it’s all an organized campaign. What people need to understand about the attacks on Tesla is this is all a campaign organized by a dark money group funded by George Soros and the open society foundations. It’s going to last for a limited amount of time and then there’s going to be a full recovery in Tesla and Tesla stock. Yes, the market has plateaued for electric vehicles in the United States, at least temporarily, but think about who their competitors are. Every pure play EV company competitor to Tesla in the United States is either in bankruptcy or teetering on the brink of bankruptcy. And the EV divisions at Ford and GM are failing disastrously. Ford’s lost five billion dollars each in the last two years on its EV business unit and probably won’t continue in the same form going ahead they’ve talked about. rejiggering their plan to invest in hybrids rather than pure-play electric vehicles. And so everybody’s failing with Tesla in this market in the United States. This is a buying opportunity.
Stuart Turley [00:50:41] You bet. My father-in-law just picked up his yesterday. So, I mean, it’s pretty cool.
David Blackmon [00:50:47] I’ll never buy one. I’m not gonna go out and buy an EV. I don’t like the technology, but look, people need to understand what Tesla is and what it is.
Stuart Turley [00:50:56] their robots are making a major announcements here very quickly and I think that that is a whole new animal for them. David and your substack, I’m trying to get to your substack here, there we are.
Irina Slav [00:51:12] Sorry guys.
Tammy Nemeth [00:51:12] Bye, Irina! See you next week.
Stuart Turley [00:51:19] There you go.
David Blackmon [00:51:19] See me at blackmon.substack, energy transition realities. Love to have you there. You’ll get a laugh every once in a while.
Stuart Turley [00:51:26] And if you really care about emissions, people should buy a Prius. Toyota has been great with standing the net zero movement. I love Toyota. And I think they’re leading the world in hybrids. And quite honestly, I think hybrides are the technology forward to lower emissions. I’m all in on let’s be good on the environment. I think that that is a wonderful kind of a thing. So. And for our stories here, we’ve already covered the Heathrow outage on net zero. I think that exemplifies totally what is going on with the net zero policies based on false climate narratives equals a false narrative of an energy secure country. and I think this is going to mold into one other next statement, there will be those countries with fiscal responsibility and growth and there will be those countries without fiscal responsibility and growth, and they’re going to be in decline. We’re going see a microcosm of that in the United States, and that’s going to be the blue states are going to failing even further, the red states are going to be successful. until more of the blue people come into the blue states and if we don’t get our elections fixed, the whole thing’s going to fall. So sorry about that one. But this next story bringing up here is Trump Zelensky ceasefire conditions on US looks at buying a nuclear power plant. And I find this one very interesting and very important from several different aspects. Zelensky went to the EU and reportedly was offering the minerals to the UK. And then he also offered the minerals the EU. So I think those minerals are actually worthless and Trump is actually doing a great thing and saying, okay, I don’t need your stinking minerals. I will take your grid. Holy smokes, Batman. So now, if you think about it, what has Russia done great? They have a 4% GDP growth last year. With a 4 percent GDP growth, countries love 4%. And so when you sit back and what are they exporting? They’re exporting energy, they’re exporting their nuclear technology, they are exporting their oil, they exporting their LNG, but their LNG has had a really hard time because their dart fleet is not nearly as much. But in this case, if the United States exported clean technology for scrubbers, we do coal generation better than anybody else. Why don’t we export that to India and China and teach them how to really clean the emissions out of coal plant? Oh, we can make a lot of money. It’s kind of like Canada in their turbine generators that are needed for natural gas plants and pipelines. Canada does a great job on those things. If you focused on that technology, Canada would be doing very well on those kind of exports because their turbines are phenomenal and needed. So, if United States focused on owning grids around, let’s say, Africa and we helped jobs in Africa would help jobs in the United States, that to me makes sense.
Tammy Nemeth [00:55:20] That wouldn’t happen in Africa until the World Bank and IMF leadership changes. Because I mean, if the United States were to go in and make those investments, I think people would be upset because they’re trying to get the debt under control. So why go and try and make these U.S. government investments in places like Africa? I understand the Ukraine one, because I think Trump is working from the perspective. If we own that nuclear power plant, and Russia attacks it, that’s a declaration of war against America. And that was the whole point of him wanting to be able to be involved with the rare earths and the different minerals in Ukraine, because then it would be like, if Russia is trying to do something, then that’s an attack on the United States. But, you know, to do that in Africa, I don’t know, I didn’t see that there would be a real public support for that in the United states. But hey, you guys are Hurricane. What do you think?
Stuart Turley [00:56:19] I’m thinking that if we did something other than what we’re doing now, it would be successful. And what we are doing now is funding USAID, which is the CIA and overturning governments around the world. I think if we actually tried to become business partners, I think that it would make a huge difference. And when I visited with Nj Ayuk, who is the head of the African Energy Chamber, he’s out there saying, don’t give us any more handouts. give us and work with us as business partners and he’s out there. We’re seeing more and more United States big oil companies going and drilling all over the world. Look at Kazakhstan. I can’t even look at Kazakhstan, and it’s got. Exxon, you’ve got Luke Oil, which is 5% of it, but you’ve got Chevron in there at 50% of the production over there. That’s where you take a look at that same expertise, but let’s export our great how we get clean energy and produce it and make that a focus. I think that would be a much better solution.
David Blackmon [00:57:38] Help with the trade deficit too.
Stuart Turley [00:57:40] Oh, absolutely. And then you can find me on the energynewsbeat.substack.com or energynewsbeat.co or energynews,beat.com. And then after that, we would be like these dogs having a great day. Now, I can only play this song for 10 seconds because it kind of gets into a copyright. So I’m going to cut that out after this. But these dogs, imagine playing that song in your head as these dogs are just zipping around and doing this. This is United States exporting clean energy around the world and everybody’s happy and business partners, as opposed to having us overthrow businesses and countries. And I think this is the way we need to do business.
Tammy Nemeth [00:58:33] Yeah, to do to be responsible, to have responsible development.
Stuart Turley [00:58:42] With that, I think we had an absolute blast. David, any last words?
David Blackmon [00:58:48] Uh, no, man, last week was one of the busiest weeks and major energy stories I’ve ever seen that we, we missed some big stories on this podcast that we may, we can get to them next week. So, uh, it’s great. Wonderful. Yeah. What do you think? Well, one thing was, was our secretary of energy, uh. Classifying climate alarmism as a quasi religious movement. Imagine. Three years ago, if any official in any government in the Western world had said that, it would have been the major news story for a week. And instead, nobody in the media even talked.
Stuart Turley [00:59:31] This is the reaction from them when they found out that they were just classified. Sorry, can you imagine that that’s that is Al Gore on the left as he realized he was now, you know, classified as bad, so sorry, out on his carbon credit scale. Yeah, that’s right. But anyway, I think it was a great show for Tammy, and what are your last thoughts?
Tammy Nemeth [00:59:57] I would just say to Brian Zinchuk, who had a comment about Qatar’s LNG. From what I understand, Qatar has been looking at some kind of emissions trading system, but they don’t have one. They don’t a carbon tax. And they made basically a threat to the EU saying that if the EU was going to follow through and put LNG under this climate disclosure and carbon border adjustment mechanism system, then they would find other markets. but they would stop shipping to the European Union. So yeah, the same thing would be for Canada. We could make a business case for LNG for sure, but it becomes a matter of do we want to participate in these types of emission systems that will add the expense on the business side, on the exporter side, and then the importer would pay whatever difference that is.
Stuart Turley [01:00:57] All right, well, thanks, guys. I think with that, we will call this a show. Have a great day, and thanks for all the great comments from Gayle, and David, and Brian, and Patrick. We sure love everybody. Have a good day. We will see you guys next week.
Tammy Nemeth [01:01:11] Thanks, everyone. Have a great week. Bye.
Sponsorships are available or get your own corporate brand produced by Sandstone Media.
Net Zero has forced global financial and companies to become carbon-neutral. But the why is only one question that we will tackle on another day. Today, let’s look at the energy policies that countries force […]
ENB Pub Note: This article from City A.M. is about energy entertainment. There is no way that the UK can get to 95% low-carbon electricity by 2030 and remain a sovereign nation. The left’s energy […]
Europe’s oil and gas giants are increasingly scaling back their climate goals as they struggle to deliver on their ambitious clean energy pledges. In 2022, Norway’s state-controlled energy giant Equinor ASA laid its roadmap to […]
Trump is moving to reopen coal plants and rolling back regulations, citing U.S. energy needs and competition abroad. Donald Trump announced a massive reversal to decades of American environmental policy on Monday as he vowed […]
Russian drone strikes targeted Odesa during Czech President Petr Pavel’s visit, resulting in power outages and injuries to civilians. Both Russia and Ukraine have accused each other of violating agreements regarding strikes on energy infrastructure. […]
Video Transcription edited for grammar. We disavow any errors unless they make us look better or smarter.
Stuart Turley [00:00:00] Trump announced that America’s trove of coal burning power plants once it began will be operational. This is very, very important. Lee Zeldin said he’s rolling back to 31 environmental regulations, including some that limited pollution that can be emitted from coal burning, power plants. This is critical because we cannot shut them down yet. We need to keep them open. I think that clean coal technology is a technology that we need to get better and export it.
Michael Tanner [00:00:41] What’s going on, everybody? Welcome in to the Monday, March 24th, 2025 edition of the Daily Energy Newsbeat Standup. Here are today’s top headlines. First up, sticking in the UK. UK’s Heathrow Airport power outage sheds light on net zero policies. Staying in the U.K., they aim for 95% low carbon electricity. By 2030, that’s a whole bunch of gobbledygook. I don’t even know what it means. We’ll dive into that one. Next up, big oil retreats, Europe’s energy giants ditch green pledges. So they’re, they’re moving away from where, where Great Britain is coming back at home. Trump moves to reopen coal plants, citing U S need, uh, U S energy needs and global competition will end the new segment with natural gas prices, driving up electricity costs. Around the country Stu will then toss over me. I will quickly cover what happened in the oil and gas markets We’ve got some interesting rig count numbers and a big big deal coming out of the mineral space Oxy decides to sell a nine hundred and five million dollar minerals portfolio to elk range resources out of Dallas where we’re at two hundred and fifty thousand net royalty acres a lot of different angles to cover this on and we Will cover it We will cover all that in a bag of chips, guys. As always, I am Michael Tanner, joined by Stuart Turley. Where do you want to begin?
Stuart Turley [00:02:11] Hey, let’s start with our buddies over there in the UK. Holy smokes, you can’t buy this kind of entertainment today. The UK’s Heathrow power outage sheds light on net zero. The second line in there is London’s Heath Row Airport had a major power outages and relied on biofuel backups. Holy smokes. It was at a standstill on Friday, Michael, because of a power outag due to large fire nearby and a disruption. It affected more than 1,300 flights in the coming days and the cause is under investigation. Well, we found a few of those on the Texas Alliance put out there a video of a guy admitting it appears Heathrow had changed its backup systems in order to be, wait for it, net zero. Their net zero went to biofuels, Michael, And they caught on fire. And so you sit back and kind of go this brings up a gigantic question Michael biofuels Which is also ethanol I put in here and did a little research on Grokon X Why don’t we get rid of ethanol? I’ve written about this before ethanol takes more energy to To produce it to a cost an average of two dollar two miles per gallon per car think about how much that is and then you think about the cost it roughly cost for fifteen point six billion gallons roughly twenty six point four billion it cost the united states every year that’s not including car maintenance or anything else.
Michael Tanner [00:03:56] Yeah, um, I mean, do you want to know the reason why we still use ethanol? And I, before I say it, I want to say, I love farmers. I think farmers are the backbone of this country, but the reason why ethanol is subsidized by the United States is because it’s really a direct subsidy for the corn industry, which is the majority of the farming that gets done in the country. So you’re, you’re at a, you know, you, you know, we need farmers. The question is. Do we need them producing corn? And the problem is you have most of the agriculture in the United States still producing corn because the country and the United States is buying it to use ethanol, which is less energy efficient. So it all, and this was done, Stu, when was this done? This was done way back in your favorite president, Bush era, as a way to garner support throughout the middle of the country. because… If you can imagine the middle of the country used to be some I mean you now look at a map of Democratic and Republicans and it’s basically red in the middle and you’ve got these little strips of blue on the outside used to Not be used to me more of a checkerboard used to have a lot of places like Iowa in the Midwest used to Be not necessarily hardcore, you know Marxists or you know Communists, but they used to definitely have some left-leaning tendencies and you would find pockets of places in Iowa, pockets in places of, of Nebraska, Kansas, and throughout that Midwest where there was some left- leaning stuff. So what did, what did the administration back in 2000, I think it was like three or four do in the, in, in the midst of I think, it was right before the 2004 election where it was, there was a chance that Kerry was going to win. Well, you start, you know, encouraging ethanol. It’s a direct subsidy to those people. So That’s my problem, ultimately, from an economic standpoint of subsidies. It’s hard to wind them back. Once you get somebody hooked on money, their standard of living raises, and you can’t roll that back. So I don’t know what to do about this ethanol thing, but I agree with you. We got to figure out something.
Stuart Turley [00:06:02] Well, let’s go roll on to the UK aims for 95% low carbon electricity. This is absolutely this is articles from City AM. It’s about energy entertainment. There is absolutely zero way, Michael, that the UK can get the 95% low carbon. They’re fast tracking. Michael, they’re fast tracking. Four billion dollars of investment. their grid is the one of the most unstable conglomerate messes in the planet giving developers developers a head start in the global race to secure essential materials and equipment will help avoid delays get it is just absolutely pathetic what the great britain’s or the folks in the uk are putting up with the the uk energy policies are a example of what not to do
Michael Tanner [00:06:57] Yeah, I mean, it’s, and we know this isn’t going to work. We’ve seen California move away from this. They said that EVs were going to be here by 2030 and now they’ve moved that back to 2050. We’ve, we’ve seen it all throughout. We’re about to talk about what’s going on in Europe right now. For some reason, the UK still has to be clinging to this idea. And it’s really in it’s wealth theft, in my opinion, it stealing wealth from the average, the average person and trying to put it in the hands of in an order to divert. quote-unquote power from one sector to another immediate straight robin
Stuart Turley [00:07:31] It is. It is a wealth transfer from the rich to the richer. Let’s go to the next story here. Big oil retreats from Europe’s energy giants on ditch green pledges. I found this one very interesting. Europe’s oil and gas giants are increasingly scaling back their climate goals. Norway’s state-controlled energy giant Equinor laid its roadmap to achieving net zero. We love Norway. Norway is a fantastic country, but they were going to close down all of their natural gas. Now they’re the number one supplier of natural gas to the EU. They love them some natural gas. The energy transition has started. This is a quote. But the opportunity for high value growth is more limited than we anticipated, Equinor CEO Anders Opetl said on Thursday. What is the difference between the US oil majors and the European oil majors? The US oil major kind of stayed their course with the exception of Occidental, and Occidental really tried to play in the carbon capture and go into that route, that’s where their success was. Shell and Equinor appears to be systematically scaling back its energy investments, and doing more like the U.S. made.
Michael Tanner [00:08:56] Yeah, both have ditched their wind investments. You know, you mentioned Shell. They announced early or late last year that they’re ceasing new offshore wind investments after doing some kind of corporate restructuring under the current CEO, Whale Swan, you know. And what’s hilarious is he’s citing and he’s sighting looking to boost profitability. So, I mean, they’re, they used to kind of hide it in the press releases by saying, Oh, well, we’re just. Well, reorganizing to be more competitive and they used to hide. Now they’re just outright saying, yeah, it’s to boost profitability. So, I mean, it’s the funny part, you know, the company spokesperson said, while we will not lead new offshore wind developments, we will remain interested in off-takes where commercial terms are acceptable. Now, that means they’re not doing anything because they’re not going to find any commercial terms acceptable and are cautiously, I mean I’m dead serious, this is the quote, and are cautiously open to equity positions if there is a compelling investment case. I mean that’s as, that’s so, IR guy of the week, right there, whoever came up with that, because that’s saying, oh, we’re open to it, but we’re not ever gonna actually do anything. But we’ll listen, we’ll take a meeting, we’ll let you wine and dine us if you have some new, I mean, it’s unbelievable how quickly they’re running backwards from this and how they’re not even hiding it anymore.
Stuart Turley [00:10:20] Let me give you a industry translation. You say, what did you just say? You said we’re cautious, read that line again.
Michael Tanner [00:10:29] We’re cautiously open to equity positions if there is a compelling investment case.
Stuart Turley [00:10:39] That translates to, holy crap, Batman, the subsidies are drying up and there’s absolutely no way we can make any money is what that translates into to an oil and gas investor. You said it best. Let’s move on. Trump moves to open coal plants, citing U.S. energy and global competition. This story goes really in line with the next story, also natural gas driving up electrical prices. Cold Michael accounts for 15% of all power generated in the U.S. This is down from 50% in 2000 according to the U S IEA. But on a truth social post Monday, President Trump announced that America’s trove of cold burning power plants once it began will be operational. This is very, very important. Lee Zeldin said he’s rolling back to 31 environmental regulations including some that limited pollution that can be emitted from coal burning power plants. This is critical because we cannot shut them down yet. We need to keep them open. I think that clean coal technology is a technology that we need to get better. and export it to the countries that are going to be burning like India and China, let’s sell our great technology to them and then put energy as an export service. That to me would make more sense. Let’s get clean coal going as opposed to just king coal.
Michael Tanner [00:12:13] no you’re absolutely right uh… we need low-cost power and wherever we can get it the free market will figure out where the best is so i’m all with moving rolling back regulations and saying okay now all different sources of energy are available what does the free-market decide it decides cold great if it decides natural gas great right it decides wind power Great, but let the free market, uninhibited by subsidies, uninhabited by regulations, whether it’s harder for fossil fuels and easier for quote unquote renewables, let the free market will decide what’s most efficient and the capital will move towards that.
Stuart Turley [00:12:57] The ideal solution, in my opinion, is nuclear, as I’m sitting here for our podcast listeners with my great hat that says, oil and gas executives for nuclear, I’m a nuclear kind of guy. But you know what? How can we get a nuclear plant done in the United States? UAE did one in four and a half years. We are going to have some serious problems in three years, dude. Let’s go to this next story. Natural gas prices drive electric cost upward. This is from, uh, Leonard Hyman and William Tiles from oilprice.com but this is talking about the markets Michael in natural gas from a how it is funded for the gas generator they did not put in long-term contracts so they were trying to do spot pricing And so spot pricing for natural gas gets a little dicey in the United States. It’s a little easier because we have a much different pricing kind of a thing. The bottom line in this is there are not enough manufacturers for the, the manufacturers of gas turbines have not scaled up their capacity to manufacture all those units needed to power a largely gas fired network. We are seeing shortages going out 20 years, Michael. This is frightening.
Michael Tanner [00:14:19] Yeah. Um, I mean, it, again, if you don’t have access to energy, you know, prices, you’re, you’re going to pay more to, to get natural, you to get natural gas. And I think what’s interesting and what you’re seeing in, in this attempted ceasefire conflict that’s going on in the, in between Russia and Ukraine right now is really it’s all coming down to energy. I think they’ve They both, I think, want to stop this war, but I think now, obviously, you’ve got a borders issue, you’ve go the NATO issue, and you’ve the energy issue.
Stuart Turley [00:14:50] Well, let’s let’s put another twist, put a a bookmark here, Michael, because President Trump is wanting to export LNG. Well, LNG is only about 36 shipments right now a month out of the United States. You can back into how many billions of dollars of LNG that is and how much that can offset trade. But if you were actually shipping out nuclear reactors or you shipping out clean coal technology or you are actually doing what President Trump is talking about doing, Michael, he’s actually talking about taking ownership of the Russian nuclear power plant that was built by Russia that is owned in Ukraine and then leasing it back to the Ukrainian people to keep interest there. that just got my head thinking and thinking wait a minute if we actually became utility companies for countries around the world that would absolutely be a long-term business model that is sustainable that is how russia got to 38 percent of their gdp is energy exports not just natural gas.
Michael Tanner [00:16:00] No, I mean absolutely, it’s not a bad idea, you know, I think there’s some national security issues that come with that.
Stuart Turley [00:16:10] Absolutely. But I didn’t say I approved of us managing that thing. I just said it was an interesting business idea for everybody but Ukraine. I want out of Ukraine. I want that clear.
Michael Tanner [00:16:22] Yeah, well, yeah, I mean, the problem is we got ourselves involved with Ukraine in 2014 when we decided to overthrow the government that was there. So now, unfortunately, we got ourselves into this problem. We’re going to figure out a way to get ourselves out.
Stuart Turley [00:16:36] Well, get rid of the CIA and then I think we can, but we’ll just leave that alone.
Michael Tanner [00:16:39] Absolutely. I mean, so all right. Well, let’s go ahead and jump over to finance guys before we do that. Let’s go ahead and quickly pay the bills. As always, thank you for checking us out here on the world’s greatest website, Energy Newsbeat.com, the best place for all your energy and oil and gas news. Stu and the team do a tremendous job making sure that website stays up to speed, everything you need to know to be the tip of the spear when it comes to the energy and the oil and gass business. Go ahead and hit that description below. for all links to the timestamps, links to the articles. You can also hit the link for our sub stack. The energy newsbeat dot sub stack dot com. Highly, highly, highly recommend you check that out. It’s really the best way to support the show. Go there. Um, stews dropping a lot of custom articles that don’t get on energy news beat dot com great way to just subscribe and stay up to speed with what we have going on. on a more personal level. If you do feel so inclined, go ahead and sign up for a paid subscription. That’s the best way for us to keep the lights on here before we have to put coal fire generators background here. We like the natural gas we’ve got flowing, but we will get on. We’ll move to mice power if we need to. We’ll get a couple of mice losing their mind in the back here if we to keep this podcast going. I promise you that. But thank you to everybody who has subscribed there. And as always guys, investinoil.energynewsbeat. dot com if you want to be called come Billy Bob Thornton from land man it’s a great way to get ahead in your 2025 taxes it’s great way Stu’s got uh Stu’s gotten up right now great way to get ahead on your 2025 tax is a great to give yourself um some monthly distributions um and always always always you get to now tell everybody at parties that you’re an oil man so I mean what’s better than that and finally Guys, thank you to Reese Energy Consulting for also helping us keep the lights on here. We’re a huge fan of everything they do. If you’re an upstream oil and gas company and you haven’t and you’re not working with an oil and gasses marketing company, I highly recommend giving them a call. You’re losing $0.15, $020 per MCF by not negotiating your contracts. You’re loosing $1, maybe $1.50 on your oil contracts if you’re using them with your first purchase. So I highly recommended calling them. If you’re in the midstream or downstream space, there’s some of the experts when it comes to LNG, all which ways. Whether you need help getting a large ramp permitted, whether you’re in the process of building and you need, and you, and, and need help, you know, figuring out plans, sourcing material, if you need crude oil or jet fuel to sell, they’ve got everything, guys, Reese Energy Consulting. And if you need training on anything, Reese energy training, we appreciate them over there. But Stu, let’s jump into the markets here. S&P 500 on Friday, basically flat, little small pop at the end of the day. NASDAQ was actually up a little bit more, up about 4 tenths of a percentage point, 2 in 10-year yields. Actually a difference, your 2-year yield dropped by about 3 tenths, 10- year yield jumped up by about .2 percentage points. So the spread on that was about 2.5, which is generally, you know, usually that spread follows each other, but very interesting there. Dollar index was up about 3 quarter, or 3 tenth of a percent point. Bitcoin over the weekend. It’s about 1.5 percentage points to the upside about $85,000 crude oil jumped about 21 cents or about 3 tenths of a percentage point closed at 68 28 Brent oil basically the same was up 4 tenths of a Percentage point or 34 cents 72 15 natural gas slid a little bit through Thursday and Friday Closing at $3 and 98 cents on the day xop contract was down about 1.4 percentage points or about 131.36. So, really when we go back to oil prices, basically the second week of gains and really that comes back to just slight tighter supply that’s being forecasted. I think the Iranian sanctions that were dropped a month ago and then the freshest ones that were drop this week, really I think has tightened the quote-unquote supply outlook. You know, we did see on Thursday that the U.S. Treasury announced these new Iran-related sanctions, which actually target independent Chinese refiners, among other entities and vessels that are actually buying the Iranian crude. So not necessarily sanctioning Iran, but sanctioning the people that they feel like Iran is selling to, which is super interesting. You know basically, Scott Shelton, he’s an energy analyst at TP. ICAP, his quote was, that probably sent a message to the market that Chinese companies, the largest buyers of Iranian oil. are not immune to sanction pressures from the US. It’s the fourth round of sanctions that have come down on Iran, so fairly interesting there. It also, there is a new OPEC Plus plan for some actual cuts now. Now, it’s not out of Saudi. It’s out of seven other members. They haven’t really leaked who those members are. To give you an idea here, seven members. are to cut output further to compensate for producing more than agreed levels. So basically what’s the monthly cuts are going to be between a hundred and ninety eight thousand barrels per day and four hundred and thirty five thousand barrels into June twenty twenty six. What’s hilarious is that there’s monthly increases of a hundred thirty eight thousand uh… from April which reverses five point eight million of cuts that have happened since twenty twenty two. So basically, what they’re saying is We’re raising oil production over here. But now we’re signaling that we’re cutting production over here in order to cap where that price is. So this really falls back on the concept of, you know, Saudi, who runs OPEC, needs higher oil prices in order balance their budget. They can’t necessarily afford to drive out U.S. shale. And I think the idea that I think a lot of people are running with is, well, Saudi just wants to now get on Trump’s good side. They want to flood the market. They want to drive down oil prices. Well, they’re not in bed right now with US shale in terms of wanting to kick them out. That was what happened in 2014 to 2018. They wanted to drive US shales out of business and regain market share. It worked for a little bit, not really though. And so it’s a little of, look what we’re doing over here, but look what we’re do over here. And the net output is basically the same, basically that three of those countries, Iraq, Kazakhstan, and Russia are who they’re wanting to see. Basically, roll back some of these increases because they’re producing more than they should. Kazakhstan’s oil output did reach a record high in March on the back of multiple oil field expansion, which actually further exceeded the production quotas that they’re under. That’s according to two sources, according to Reuters. We also did see rig count on Fridays. We did see one rig get added, which is fairly interesting. My guess is it’s a natural gas rig. count sitting at 500. and ninety three so slight slight but minimal change there are we did see in canada we dropped nineteen rigs in canada and internationally we were fairly flat the only other thing i saw stu on on on friday was was the announcement from elk range royalties uh… otherwise known as elk range which is a uh… mineral royalties company backed by ngp uh… they go ahead and make a deal with oxy to buy 250,000 net royalty acres. for an approximate transaction price of nine hundred and five million dollars you know cat they don’t tell us if it’s all cash all stock how it actually works my guess is it’s cash because what oxy came out and said was this was part of their long term plan of driving down their debt and what i find interesting is so you know a normal oil and gas setup is you know you pay for you know for well cost ten million dollars the operator Pays $10 million. and they only receive 75, you know, 100% of the cost, they only received about 75, 80% of their revenue because there’s a portion of that that’s carved off for the mineral owners. Well, you a strategy that Diamondback is taking has gotten into with Viper Minerals. What a lot of these large oil companies do is if they’re gonna develop a huge area, they have a 300,000, 200,000 100,000 acre position. What they’ll do is attempt to not only buy the working interest, but they’ll try to go front run and buy the minerals. Because now all of a sudden if you own 100% of the working interests and 100% percent of the revenues, a lot of these single well economics look a lot better. It’s easy to justify single well economic when you put a dollar in and you’ll theoretically get a dollar out. It’s not quite how it works obviously, but let’s just look at it from that perspective. You put a dollar in to only get a 75 cents out you know, for every dollar you put in, you better hope that the revenue coming out is, you’ve got that 25% or 20% margin that you have to make up. So obviously on a portfolio level, you’re buying the minerals and you hope that cost of the minerals, you know the increase in your overall net revenue interest outweighs the cost you paid for minerals. They’re all a bunch of stuff, but they love to do this because on a single well economics level, it allows, you know it allows your half cycle stuff to look a heck of a lot better and the market really likes it. So, oxy now! going and selling minerals in the D.J. Basin, which is one of their few, you know, which is a asset that they have that has not necessarily been neglected, but something that I don’t think people know that Oxy is one the larger operators in Colorado. The fact that they’re selling the minerals in Colorado is a signal to me, one, they really are worried about their debt, and two, they’re getting ready to actually shed their Colorado asset in general. You wouldn’t front run and sell your minerals off if you aren’t then thinking about going and selling the entire asset. Now I think the interesting part is, why wouldn’t you keep the minerals with the asset when you go to sell it? It probably tells you they want too much for the assets and nobody is willing to drop, you know, say five billion dollars plus another billion if you, you know on the royalties and they’re just, they feel like they actually can get better value. You know, the idea is the sum of the parts is greater than the whole. They actually think they can get more cash by separating them. So I think it’s a great deal. If you’re elk range, I think Colorado. is an underrated from an oil production standpoint. I have a lot, you know, being from there, I have lot of contacts there. There’s some big, big, big wells up there. They’re also, some of these minerals are also underneath Chevron and Civitas, who actually account for actually half of the wells that were sputted in 2025. So there is some diversification there, but I do find it extremely, extremely interesting that Oxy goes ahead and makes this decision. Obviously we know they needed to reduce their debt. They’ve said that. I think what this is a signal of is they’re, you know, winding down this portfolio in Colorado from the standpoint of let’s offshore the minerals, and I wouldn’t be too shocked if in six to eight months we start hearing rumors of their Colorado asset being heavily on the market. I know it’s been on the market and there have been discussions about that. The question is, you now, an asset that’s spitting off $700 to $800 billion of cash flow a year or so they, or excuse me, $700 billion a year, $ 700 to $ 800 million a year of cash flow, the question is what does that sell for right now? And I think that’s the hard part is do you take a lesser value and take a little bit of a wash on the asset to lower your debt value? And the question is, who’s going to pay all the cash? If you’re reducing debt, Stu, you can’t take stock as part of the transaction. You’ve got to take cash. And so now, $5 billion in cash is a lot more difficult for somebody to come up with than $5 billion if a public company wants to come in and buy this than doing a half cash, half stock deal. does oxy really want stock no they want all cash so I think it’s going to be really interesting um you know I know a few of the people that work over there are elk range they’re great people ngp does a lot of great work in the private equity states but I think this says more about what oxy’s feeling about Colorado and where they feel like they can actually divest in order to bring down their overall debt load because I think that the dirty little secret on the street right now is their acquisition of crown rock great assets but I don’t think it I think way it was a way. It’s turning out to be a way over value of where their assets were.
Stuart Turley [00:28:56] I think what you’re going to see is Occidental leadership has absolutely been right on track in the past. I think they understand what’s coming around the corner, and if you’re in a Democrat-run state like Colorado, get out now while you can.
Michael Tanner [00:29:11] So this is where I’ll disagree with you slightly. I think Oxy’s leadership is cooked, and I wouldn’t be shocked if we see a leadership change in the next two to three years. I think their two largest M&A transactions, Anadarko and Crown Quest, have turned out to be pretty disastrous from a debt standpoint. They’re now turning around and having to sell. large cash flowing assets. Yes, Colorado is tough to operate in, but it really only makes sense if you’re Chevron, Oxy, or Civitas. If you’re a publicly traded company who has lobbying power, who has enough cash. I mean, they’re big wells in Colorado. Again, it’s about how much oil you make versus how much you have to spend. And okay, great. If you have spend a little bit more money to comply with regulations, but the margins are still there because the oil production is so great, why not? premiums in Colorado are great. I get that the leadership is there, but you know there’s an entire country, or there’s entire portion of that state that relies on oil and gas for the economy, relies on for their schools and all that stuff. I mean, you know, yes Colorado is extremely liberal, but I think you’re from a standpoint of that’s just Boulder in Denver. I think that you have to look at the wide, you look at what’s going down in the San Juan Basin, you have everything that’s going on really in Weld County. I don’t think it’s a bad state to operate in, I just think you’re going to see, it has to be a large public operator is really the only company that can come in and operate these assets. So that shrinks the amount of people who can come buy this asset. Again, I’m gonna take the opposite stance. I think Oxy’s leadership is cooked. I think their investments in carbon capture have not panned out terribly well, considering where the state of kind of the market has gone, the market is backed off of renewables and backed more into oil. on which means they have to put up a lot more money to go by crown rock with the inventory may or may not be that here’s a big if scott sheffield’s coming out basically say gap i years in the tours out by twenty twenty eight brown rocks inventory is gonna be out by next week they you know they didn’t have as much so uh… i it’s me very easy i think oxy’s in for a bunch of changes
Stuart Turley [00:31:12] I would agree, but I also think that if Oxy, if let’s say Kamala Harris had won, Oxy would be ahead of the curve because the subsidies would still be rolling.
Michael Tanner [00:31:23] yeah i disagree though because everybody even even even at the end of of joe biden’s term people role it didn’t nobody woke up when trump won it was like oh when does it make it we’ve been to even talk about this for eighteen months now that all of us to work on
Stuart Turley [00:31:36] I said nothing to be done, Michael, because of all the regulations and everything else.
Michael Tanner [00:31:41] The difference is regulatory capture is real, though. If you’re a large public operator with a market cap in the tens of billions of dollars, like Oxy is, like Chevron is, you actually like regulation because it keeps out your competitors and you’re the only one that can comply with. Regulatory capture in the oil industry is super real. Oh, yeah. So, again, I’m of the mindset, I think you’re gonna, I think, you know, you’re in for a… you’re you’re in for a uh… pretty uh… fascinating uh… span over the next eighteen months for oxy and uh… i wouldn’t be too shocked if we see some some leadership changes there
Stuart Turley [00:32:18] Back to the Kazakhstan article, just real quick, Chevron is 50% of their production out there, ExxonMobil is 25%, Luke Oil is 5% which is Russian, United States is involved in that heavily. We’re seeing the US majors really interested in putting in oil and gas wells around Bye!
Michael Tanner [00:32:44] Yeah, absolutely, absolutely. Um, it is going to be Kazakhstan’s very interesting. So, all right guys, um, another week, Stu, what are you worried about?
Stuart Turley [00:32:52] Oh, just buckle up, get ready for some entertainment. Uh, hats off to the young man that won the, uh, uh from Oklahoma state. That was a, uh he’s a lieutenant, I believe in the U S air force and was able to win, uh and beat a reigning champion, Olympic champion for the NCAA, uh well done and a lot of respect given to president Trump loved it.
Michael Tanner [00:33:18] um… it’s we we we love a good wrestling match so congrats to oklahoma state and congrats uh… to to uh… the u.s. military on a nice win there but with that guys we’ll let you get here get back to work start your day uh… we appreciate that start your week with energy newsbeat and for Stuart er that i’m michael tanner we’ll see you tomorrow folks.
ENB Pub Note: This is an article from the BOE report in Canada by Terry Etam. I have reached out to him to record an episode on this topic on our podcast. Terry is a great author and has excellent points about Canada and their energy policies and investments. How will Canada attract investments when their energy and regulatory policies are not going to be as friendly to businesses as the United States. He brings up some excellent points.
It seemed fitting the other day, when discussing current global events with a particularly erudite friend (and if you think that’s a ten-dollar word hold onto your hat), the word ‘haruspicy’ came into the conversation. Haruspicy is “a form of divination that inspects the entrails of sacrificed animals, particularly the liver of sheep and chickens, looking for omens.” We had exhausted all other options. The mission was unsuccessful; two buckets later we were no closer to understanding what was going on, and that was pretty much our last hope.
As online dude Trader Ferg (great Substack follow for investment thoughts) said in his weekly note, it is mentally taxing to keep up with the news flow and what matters. Everyone is used to spotting a headline and integrating it into their framework of “how the world works”. The higher up the ladder you went, geopolitically speaking, the easier that was, because, well, that’s who controls the frameworks in our societies. We have developed expectations, for better or worse, how the EU will react to something, or Russia, or China, or the US.
But now we have situations like, for example, the US’ top trade representative/negotiator not knowing what tariff levels will be later that day because the President will be deciding that number. Now, that might make sense from the highest level because Trump is playing the negotiating game that he is legendary for (for good reason), but on the ground, the question of what tariffs mean on actual products or imports has left everyone befuddled. (Some products are exempt, but no one is really clear on what…some have been treated as exempt because no one bothered to do the paperwork…or the example the Wall Street Journal gave of a piston crossing a border 7 times (Mex/Can/US) before being sold to a customer – how on earth is that to be tariffed? Or will that piston now be worth $1,000?)
These days, all the analytical inputs are so wild and unpredictable that analysis of what is going to happen feels hopeless, like garbage in, garbage out, and we know our assumptions are garbage before we even input them. People try to process three or four conflicting bits of information and the only way to integrate it into a singular thesis is if the outcome would be regarded as a lunatic’s statement on its own.
There are no simple answers anymore. Not even in the chicken guts. But thankfully, we’re here to talk about energy, and that is mercifully more clear than everything else. Well, that’s not quite true. Things go go any which way at all. But at least with energy, there are a few structures being built that we can reasonably assume will remain, and plan around them.
Ironic as it may seem, given the chaos of tariff wars, one firm element comes from the US. From Canada on the same topic, we have an ominous silence. Or worse. I’m referring to expectations of future energy policy.
In the US, the latest White House energy blast is about as crystal clear as it gets, and is going to send a shock wave through Canada of immense proportions, on the energy front, in a way that is exclusive of tariffs. If you can believe it. What is happening is that the US is dismantling, or looking to dismantle, the vast federal/cultural apparatus that sought to accelerate an energy transition. The policy prescriptions put forward are every bit as engulfing as that sounds.
Let’s walk back in time a bit to five years ago, when Greta Thunberg roamed the land, touching foreheads and curing the lame. It was a wild time for energy. It was particularly hard for energy writers; describing the energy world over the past decade has required ever more bombastic language, which is no fun to use because well who wants to be the next tabloid, but it is an undeniable fact that, compared to decades before, the most recent one has been the wildest by far. Prior cycles were defined by price shocks. Well, we had those, but we also had a new industry arise – one that wanted to obliterate the existing hydrocarbon industry that keeps everyone alive. It was surreal. Short-cycle memories cry out “Oh come on, you’re exaggerating” at that statement, but in 2019, children were indeed marching in the streets, around the world, carrying signs with slogans that they couldn’t possibly understand such as “Fossil fuels are killing the planet” or some such, at the very moment their idealistic but misled little skulls kept from freezing by the very fuels they sought to destroy. A subset of society did indeed make a very public (and well funded) objective to dismantle/defund our existing hydrocarbon energy system. These well-paid groups (e.g., Sierra Club, which calls itself a “charitable organization” and yet proclaims in their annual report such programs as “New Jersey does not need another power plant” which is a very odd charitable activity don’t you think but anyway Sierra Club has annual revenue of nearly $200 million, $84 million of which is spent on “studying and influencing public policy” which again stretches the definition of the word charity by a considerable margin.), with literally nothing else to do, embraced every sort of guerilla tactic imaginable to decimate the hydrocarbon industry, including funding endless lawsuits, public protests, lobbying governments, physically blocking new projects, etc.
They were immensely effective at swaying public opinion, at damaging the hydrocarbon-based energy sector, and at increasing energy prices (no one wanted to talk about that last one out loud, but we could all see it). They made it simple: Hey world, would you rather get your energy 100% organically from the wind and sun, or dirty old oil? And the world, that knows next to nothing about how any of these things happen, said Well of course we’ll take the clean twins. And energy ignorance took over the land. We could see those vectors in the energy world, definitely with a direction, in Canada, in the US, and in the EU. The International Energy Agency added credence, saying in 2020 that, to meet climate goals required for our survival from a climate emergency, there could be no new fossil fuel development/investment after 2021.
All that is now out the window. (This past week, the IEA said that we do indeed need new fossil fuel investment. But that’s not the half of it, and few get worked up about IEA demand projections anyway.) Us poor energy writers must reach again for the hyberbole, because the word bombastic is the most fitting one to describe the new energy program unleashed by the Environmental Protection Agency. The EPA, under new leadership (Trump appointee Lee Zeldin), is literally blowing up almost every facet of restrictive energy policy implemented over the past 10-15 years, the policies that ENGOs such as Sierra Club so carefully crafted and had implemented. Zelda recently announced “31 Historic Actions to Power the Great American Comeback”, in 31 snappy little bullets. Each is a big deal.
Alex Epstein does an excellent job of clarifying what many of Zeldin’s bullet points actually mean (here). There are too many to go through, each with significant energy policy repercussions, but a few are worth noting for their significance.
One of Zeldin’s bullets (sounds like a sci-fi book) is “Reconsideration of the 2009 Endangerment Finding”. The 2009 ruling being reconsidered declared that greenhouse gases qualified as pollutants under the Clean Air Act. This was a massive decision, not just because it made your breath illegal, but because it required that the EPA regulate these pollutants. The 2009 Endangerment Finding therefore became the biggest club you can imagine in the fist of governments and ENGOs that were salivating to use it. It became a pillar of these entities’ objective to dismantle the hydrocarbon industry. We can see how valuable it was to, for example, the aforementioned Sierra Club. From their website: “Climate advocates reacted with rage,” Sierra Club noted in a response that outlined the myriad ways in which $84 million worth of lawyers would soon be marshalling resources to neutralize Zeldin’s bullets. (A previous Sierra Club posting from Feb 2025, in reference to the looming EPA-gutting, ruefully noted: “That is the playbook. They said what they were going to do, and they’re doing it.” The Sierra Club et al don’t want to get into this much notion much, because it highlights what needs to be highlighted: This was indeed a plank upon which Trump ran, and on which he won; a popular revolt against “environmental” overreach. If you hate Trump, no one cares. This was spelled out before the election as a certainty, and it’s happening now.)
Those are US examples and a tangential reference to where the US might go from here, industrial policy wise (you can’t shout “iNVEST HERE” much louder). Attach value judgements as you wish; I can’t even begin to opine on whether, for example, “Reconsideration of Particulate Matter National Ambient Air Quality Standards” is a worthwhile pullback of governmental overreach, or something that will reintroduce smog. The truth is probably somewhere in the middle, but in today’s world, nuance is for weiners. I will let the partisans decide to love it or hate it, the emotionless fact of the matter is: It’s here, and likely to become real, and it (along with all the others) will dramatically tilt the global investment landscape.
Which brings us to Canada. We should all know by now that, as an old Canadian Liberal named Jean Chretien once wisely said, “There is nothing more nervous than a million dollars – it moves very fast, and it doesn’t speak any language.”
Canada’s productivity has been falling relative to other large industrial economies, one of the reasons being insufficient capital investment. Whether anyone likes it or not, Canada is going to have to be competitive with the US to attract capital.
There are many facets to that discussion – ‘how to attract capital’ is a fairly grand strategy statement that touches on a lot of things, and could fill a book – but for the purposes of energy that is as cheap or cheaper than the US as the industrial base, the walking back of all these EPA regulations places a large spotlight on Canada, like an interrogator’s uncomfortably close lamp, and asks the Great White North: What you gonna do about it?
The Conservatives have been running on the plank of “Axe the Tax” for some time now, in reference to the consumer carbon tax, and it was a good tactic because it sure as hell resonated with people. Eventually and bizarrely it even started to resonate with the people that implemented the tax; few saw coming the strategic gambit thrown down by the governing Liberals, to also turn on the tax that they had championed for so long, and then theatrically rip it up in a successful annihilation of a key Conservative platform. (I smell the cleverness of Gerald Butts, but whatever, it seemed to work, somehow…they really have Canadians figured out.)
These actions make sense from a political perspective, because consumers vote and businesses do not. Politics is a simple sport in that dimension.
But thinking heads need to get back to Chretien’s comment, and ask; so…you both now favour axing the consumer carbon tax, what are you going to do about the business carbon tax? And that is a very important question, the answer to which will arguably have far bigger consequences on Canada’s economy (and possibly autonomy) than the tariff brouhaha, which will almost certainly be resolved within half a year.
We know where Mark Carney stands, and where the Liberals will go. Carney has made the ‘climate emergency’ his hill to die on, and we should expect nothing less if he gets elected prime minister. His overall plan is to still go hell-bent-for-leather on climate action, but to have businesses exclusively carry the load. He is all in on the topic. Recall that he tried to orchestrate the actions of the world’s financial and insurance industries to squeeze hydrocarbons out of existence at the fastest pace possible. He didn’t just participate, he spearheaded the entire GFANZ movement. He might have recently joined the Conservatives in denouncing the consumer carbon tax, but his first policy statements indicate that Canada will do it’s part to “save the climate”, but that it will be business alone that will do the job (you don’t need to tell me what happens when costs are added to businesses, I’m well aware, just trying to keep as many voters engaged as possible, because it’s the silent majority that will decide our next election).
It does not take much imagination to see what that will do to our capital-attractiveness relative to the US, which is moving in exactly the opposite direction.
And it would be awesome to have a political alternative to point to, but we do not have one from the Conservatives. The silence is almost equally as alarming. Who knows what they will come up with before the election, but as of today, the Conservatives’ website has this to say on the subject: “Carbon Tax Carney will pause the Liberal tax for a few months to get through the election and then bring in the mother of all carbon taxes—a job-killing, inflationary tax that will drive jobs into the hands of President Trump. The Common Sense Conservative plan will axe the tax for everyone forever. We will also axe the sales tax on home building to save you $50,000 on a new home and cut income taxes so hard work pays off.”
We need to know fairly rapidly what that means. Does “axe the tax for everyone” mean businesses as well? It’s kind of odd (which is why I quoted their political sloganeering) how the Conservatives’ messaging leaps from talking about axing the tax on everyone to talking about cutting sales taxes on home building…with no mention of anything in between, no comment whatsoever on what they will do to industrial carbon pricing. It’s quite strange, actually; repealing the sales tax on home building will save Canada’s home building industry money on the order of magnitude of possibly a few hundred million dollars, or heck let’s even call it a billion. An industrial carbon tax of any stripe, applied to Canada’s energy and energy-intensive, critical industries like steel and aluminum manufacturing, will cost Canada tens of billions, and even more critically will chase away investment capital.
Canada may get creative and force pension funds to invest more in the home land, but take a wild guess at what that will lead to in the longer term – subpar returns by forcing huge funds to invest in a small Canadian market, one that is hobbled by regulation and carbon taxation, will set up future pension challenges. But hey in the world of politics that’s the next leader’s problem.
Go ahead and hate whoever you want, for whatever reason you want. It’s a free country. Sort of. At any rate you can still vote for whomever you want. Just think about this.
Canada faces some enormous challenges at present, obviously. Voters will soon have to decide if the fight against climate change is at the very top of that list. Because when the smoke clears, that will be the clear priority in one outcome, and it will not, in the other.
Regardless, the world is changing rapidly; we are not in 2019, and no matter who is elected, they won’t be in a parade with Greta Thunberg. But what they do after election is critically important. Make a point of understanding energy policy during the campaign.
Energy is the basis for everything. It is the foundation upon which successful industrial bases are built. Particularly in light of what the US is doing – deregulation, encouraging industrial investment, etc. – , Canada’s competitive future is at stake. We need investment. We need to diversify markets for our products, and we need to find ways to add value to products that the world needs, that will secure employment and tax revenue, that will take back control of whatever we can from huge and powerful trading “partners”. In the current round of issues, in the year 2025, we don’t have a strong hand. Over the longer haul, our hand is one of the strongest in the world. We have everything the world needs, including the US (bombast notwithstanding, the US very much needs what Canada has, and will for a very long time – imagine how long it would take the US to develop an aluminum industry, for example…or, what oil price would the US need to replicate Canada’s production? A whole lot higher than it has now, a state that Trump has vowed unacceptable…so we should rest easy on that front if we survive the year). We have the option of playing it as a strong hand, if we buckle down and get to work now, across the country, cooperatively, in a way that attracts global capital and does not repel it.
The chicken guts were very clear about that.
An energy transition is far more challenging than most realized, which is why we are we are where we are. Find out why in The End of Fossil Fuel Insanity – the energy story for those that don’t live in the energy world, but want to find out. And laugh. Available at Amazon.ca, Indigo.ca, or Amazon.com.