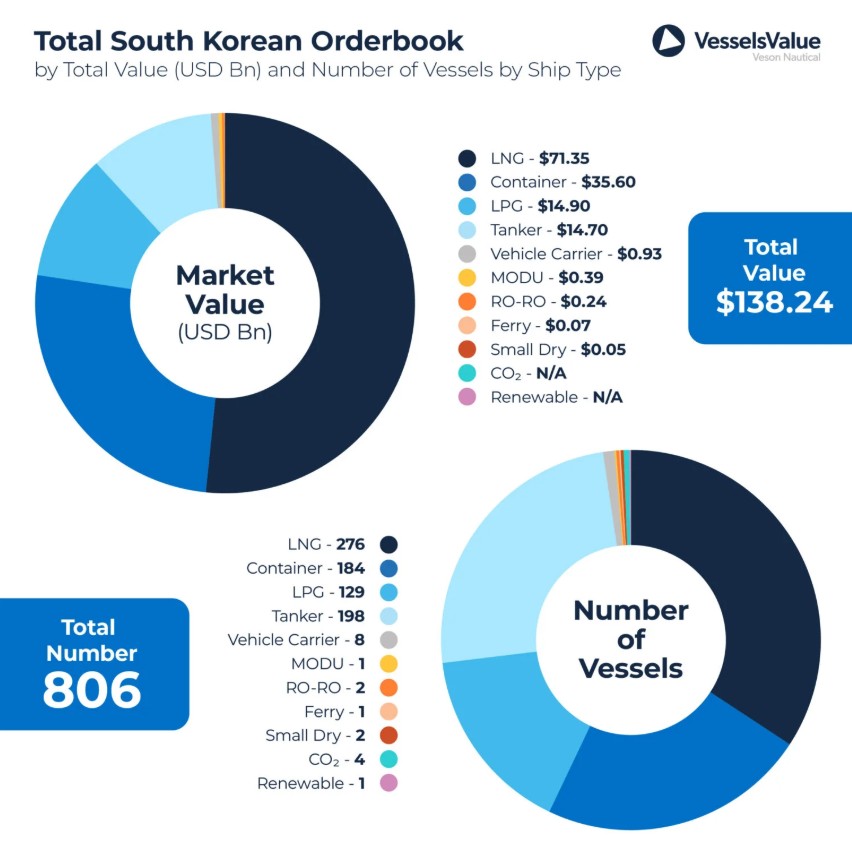
South Korean yards have 276 LNG carriers worth $71.3 billion on order, according to the newest data by Veson Nautical’s VesselsValue.
Within the South Korean orderbook, the LNG sector is the most valuable, accounting for around 52 percent of the total South Korean orderbook value, and this sector also has the highest volume of orders, VesselsValue said.
LNG carrier shipbuilders are Hanwha Ocean, HD Hyundai yards, and Samsung Heavy.
In total, the South Korean orderbook includes 806 vessels worth $138.24 billion, the report shows.
Container vessels rank second with a market value of $35.6 billion—equating to a share of c.26 percent and 184 vessels on order.
Moreover, the LPG sector ranks third with a value of $14.9 billion and 129 vessels on order, closely followed by the tanker orderbook which is valued at $14.7 billion.
Tankers surpass both LPG and container vessels in volume with 185 vessels scheduled to be built, while car carriers rank fifth with a value of $929 million and a total of eight vessels on order.
VesselValue said France’s CMA CGM is in first place with a total of $8.09 billion on order, and they have the highest volume of orders consisting exclusively of 38 container vessels.
In second place, Japan’s NYK has a total of $7.21 billion on order, which includes 26 174,000-cbm LNG vessels and three VLACs of 88,000 CBM.
In addition to these vessels on order in South Korea, NYK has a further 56 vessels on order in Chinese, Japanese, and German yards, including additional orders for LNG, LPG orders, bulkers, and tankers, VesselsValue said.
Qatar Gas Transport, or Nakilat, ranks third in value with an orderbook worth $6.9 billion, consisting of 29 vessels, primarily LNG carriers.
Moreover, VesselsValue said QatarEnergy is ranked fourth with an orderbook value of $6.52 billion, consisting of 25 large LNG vessels.
With a total orderbook value of $6.38 billion, Taiwan’s Evergreen Marine ranks fifth. The 28 vessels on order are all containers of 15,372 – 15,500 TEU or ULCVs of 24,000 TEU.
They are followed by Japan’s MOL with an orderbook value of $5.62 Bn and a total of 26 vessels on order, VesselsValue said.
Of the vessels on order in South Korea, approximately 37 percent are being fitted with dual-fuel capabilities, with a market value of $71.4 billion, the report said.
With the exception of LNG carriers, which will always be dual fuel, this includes all vehicle carriers and Ro-Ro’s, VesselValue said.
Also, the second highest percentage is the container sector, where 148 dual-fuel vessels have been contracted, equating to c.80 percent of the orderbook.
Approximately 50 percent of the LPG orderbook, or 64 vessels, will be built as dual fuel, with a market value of $7.5 billion, the report said.
TG Natural Resources, in which Tokyo Gas America has a 93 percent stake and a unit of Castleton Commodities International holds the rest, has closed on a transaction to purchase a 70 percent interest in the East Texas gas assets from a unit of Chevron.
Tokyo Gas said the deal is in exchange for $75 million paid in cash and $450 million as a capital carry to fund development within the Haynesville formation over multiple years
According to Tokyo Gas, the capital carry allows for staged development and payment within TGNR’s existing cash flow.
This asset is expected to have a high profit margin and contribute to improved return on assets for Tokyo Gas’s US shale gas business, the firm said.
Also, this transaction will extend TGNR’s inventory life beyond 20 years at the current development pace, Tokyo Gas noted.
Tokyo Gas said this agreement, along with the $130 million sale of assets to Shizuoka Gas, is part of its ongoing initiatives to optimize its asset portfolio and improve asset efficiency.
Moreover, the firm will continue optimizing its shale gas assets in the US, strengthening an integrated energy value chain anchored in its shale business.
By concentrating development and operations around TGNR’s core assets, Tokyo Gas aims to drive cost synergies with existing infrastructure and further enhance asset efficiency, and secures a long-term supply of “competitively priced” natural gas.
Tokyo Gas noted that its group vision until 2030 emphasizes the transformation of the LNG value chain.
“By streamlining its US shale gas operations and further developing its natural gas and LNG value chain, including expanding its LNG trading business, Tokyo Gas will contribute to stable energy supply in Japan and other countries,” the firm said,
Tokyo Gas said in its new medium-term management plan last week that it aims to expand its LNG trading business further, including in the US.
In Japan, Tokyo Gas owns four LNG import terminals (Sodegaura, Negishi, Ohgishima, and Hitachi), and it buys LNG from various countries in the world, including the US, Qatar, Malaysia, etc.
In 2020, Tokyo Gas formed its LNG trading unit, TG Global Trading, to boost LNG trading volumes.
The firm said in the medium-term report that it aims to expand LNG trading by leveraging its existing assets such as current supply contracts, and boost value proposition through close communications with its business partners.
The world’s biggest sovereign wealth fund, Norway’s $1.8 trillion oil fund, will buy 49% in two offshore wind farm developments of RWE for a total of $1.5 billion (1.4 billion euros), the fund’s manager, Norges […]
ENB Pub Note: As of recent data, the United States consumes approximately 20 million barrels of oil per day. This figure is based on averages from 2023 and 2024, with the U.S. Energy Information Administration […]
A federal judge has blocked an oil and gas lease sale in Gulf waters off the coast of Louisiana after finding that authorities did not take into account the impact of new offshore drilling on […]
We may slow down, but we still have growth available. At what cost is yet to be determined. Predicting the exact timing of peak oil production in the Permian Basin is complex and depends on […]
Data source: U.S. Energy Information Administration, Natural Gas Monthly In 2024, U.S. natural gas consumption averaged a record 90.3 billion cubic feet per day (Bcf/d) and set new winter and summer monthly records in January and July, […]
Highlights of the Podcast
00:00 – Intro
01:35 – Norway’s Oil Fund to Buy Stakes in Offshore Wind for $1.5 Billion
Stuart Turley: [00:04:02] Let’s take a look at this next story here. US federal judge blocks offshore lease sale over the impact on Rice’s Whales. This is a huge deal, and I know Michael will kind of laugh about it, but I’m kind of glad that a federal judge has blocked an oil and gas lease sale in Gulf waters off of the coast of Louisiana after finding authorities did not take into account. the impact of new offshore drilling on the highly endangered rice’s whale. The ruling from a judge in the U.S. District Court of Columbia will require the Bureau of Ocean and Energy Management to conduct additional environmental reviews. I’m okay, absolutely okay, and if this is going to endanger the whales, if it’s oil and gas, I don’t mind. Let’s take a break and take a look at it. I want the same things done to the wind farm. If the wind farms are going to harm them, we want to judge to stop them as we’re too. So let’s not just say that this is only for oil and gas. Let’s take a look at this for a wind farm as well on the offshore because the offshore wind vibrations are horrific. So and I want to give Steve Reese a shout out. Steve Reese, I’m looking forward to doing an interview with Steve. And we’ve got some great things coming around the corner, but Reese Energy Consulting. is our sponsor for the daily energy newsbeat podcast and I mean they have got a great training program they are great trainers and if you are buying or selling a natural gas or oil you will want to reach out to east reese energy consult and get in there with them and say hey wait a that I want to build an AI data center. we’re your engineering firm to make sure that you get the right amount of power for that data center. They’re the right ones. Steve is working on quite a few data centers right now and they are guaranteeing that those things will be run. [00:06:10][128.3]
Stuart Turley: [00:10:46] So with that like subscribe Share this, read this to your pets, have an absolutely wonderful day. And as we get geared up for Tuesday, this would be Tuesday, but if we get up, get geared for tomorrow’s stories, it’ll be interesting to see what President Trump has on his plate for his big announcements on the April 2nd. for the tariffs and how those will be impacting. I do want to give a shout out to the UK and the EU. I am very saddened by the news that they are putting the front runner for the French runoff in jail for trumped up charges there. It’s almost like what happened to President Trump and you sit back and take a look at The left is pulling all the stops out. NATO is in trouble. The EU is in trouble. And the UK is in trouble. Not a good time for those folks and we’ll be praying for you. Buckle up and have an absolutely wonderful day. [00:10:46][0.0][635.9]
ENB Pub Note: I agree with Amuse from X: President Trump has once again been proven correct. Panama claimed that the Hong Kong-based company, CK Hutchison, which operates the two ports at either end of the Panama Canal, was free from Chinese influence, despite Trump’s assertions to the contrary. China’s recent move to block the sale of these ports to a US company demonstrates its control over them—if China can prevent a sale, it can just as easily restrict access to the canal itself. This effective control by China places Panama in material breach of its treaty obligations. The logical next step is for Panama to end its agreement with CK Hutchison and secure a new operator not under China’s influence.
PANAMA CANAL: President Trump has once again been proven correct. Panama claimed that the Hong Kong-based company, CK Hutchison, which operates the two ports at either end of the Panama Canal, was free from Chinese influence, despite Trump’s assertions to the contrary. China’s… pic.twitter.com/ajGmD64hjx
Beijing has moved to prevent the sale of CK Hutchison’s ports division to BlackRock and Mediterranean Shipping Co (MSC), a transaction that was meant to have gone through tomorrow.
The decision last month by the Li Ka-shing-controlled conglomerate to sell 80% of Hutchison Ports for $22.8bn in a record-breaking ports transaction that covers 43 ports comprising 199 berths in 23 countries has been viewed very poorly by Chinese authorities. Now Beijing has made clear it will try and block the sale.
“The State Administration for Market Regulation has indicated it will conduct a review according to the law to protect fair market competition and safeguard public interest,” Chinese Foreign Ministry spokesman Guo Jiakun said at a press conference in Beijing yesterday.
Guo said Beijing “always firmly opposes using economic coercion and acts of hegemonic bullying that infringe upon and harm the legitimate rights and interests of other countries.”
If the deal goes through, MSC, the world’s largest container line, would also top Drewry’s Global Terminal Operator (GTO) league table.
MSC’s deal with BlackRock to take over Hutchison’s non-China terminals would see the carrier vault over the likes of PSA International, COSCO, APM Terminals and DP World on Drewry’s list to boast a combined volume of 78.3m teu.
Hutchison Ports was the original global terminal operator, moving beyond its Hong Kong origins in the early 1990s to invest initially overseas in Felixstowe and Shenzhen, rapidly building up a portfolio that for many years was the largest network of container terminals in the world to go alongside the conglomerate’s other interests in property, telecoms, and retail. Over the past 20 years, CK Hutchison’s ports dominance has slipped from first to sixth spot among global terminal operators.
The world’s biggest sovereign wealth fund, Norway’s $1.8 trillion oil fund, will buy 49% in two offshore wind farm developments of RWE for a total of $1.5 billion (1.4 billion euros), the fund’s manager, Norges Bank Investment Management, said on Monday.
The agreed price for 49% of the two offshore wind projects, Nordseecluster in the German North Sea and Thor in the Danish North Sea, values the entire projects at around $3.1 billion (2.87 billion euros), the Norwegian fund said.
Germany’s RWE remains in charge of construction and operations throughout the lifecycle of these offshore wind farms, which are currently under construction.
RWE is the developer of the 1.6-gigawatt (GW) Nordseecluster and 1.1-GW Thor offshore wind projects, which are expected to reach commercial operations between 2027 and 2029. Once fully commissioned, the wind farms will produce enough electricity to supply more than 2.6 million households in Germany and Denmark, RWE says.
Closing of the transaction with the Norwegian sovereign wealth fund is subject to customary approvals and expected by the beginning of the third quarter of 2025.
Norway’s wealth fund, which is commonly referred to as ‘Norway’s oil fund’ because it was created with oil and gas revenues, invests in renewable energy assets and real estate and is a shareholder in many large companies in the world, including Big Oil. The giant fund owns, on average, 1.5% of all listed companies globally.
RWE of Germany, on the other hand, has just pledged to slash capital expenditure (capex) for low-carbon energy projects by $10.8 billion (10 billion euros) amid mounting uncertainties about renewable energy policies and profitability.
“The company is responding to regulatory uncertainties, constraints in the supply chain, geopolitical risks and higher interest rates,” RWE said earlier this month.
“Given higher uncertainties in the investment environment, we have raised the requirements for future investments. As a result of stricter risk management and higher return expectations, we will invest less than previously planned through to 2030,” CEO Markus Krebber said.
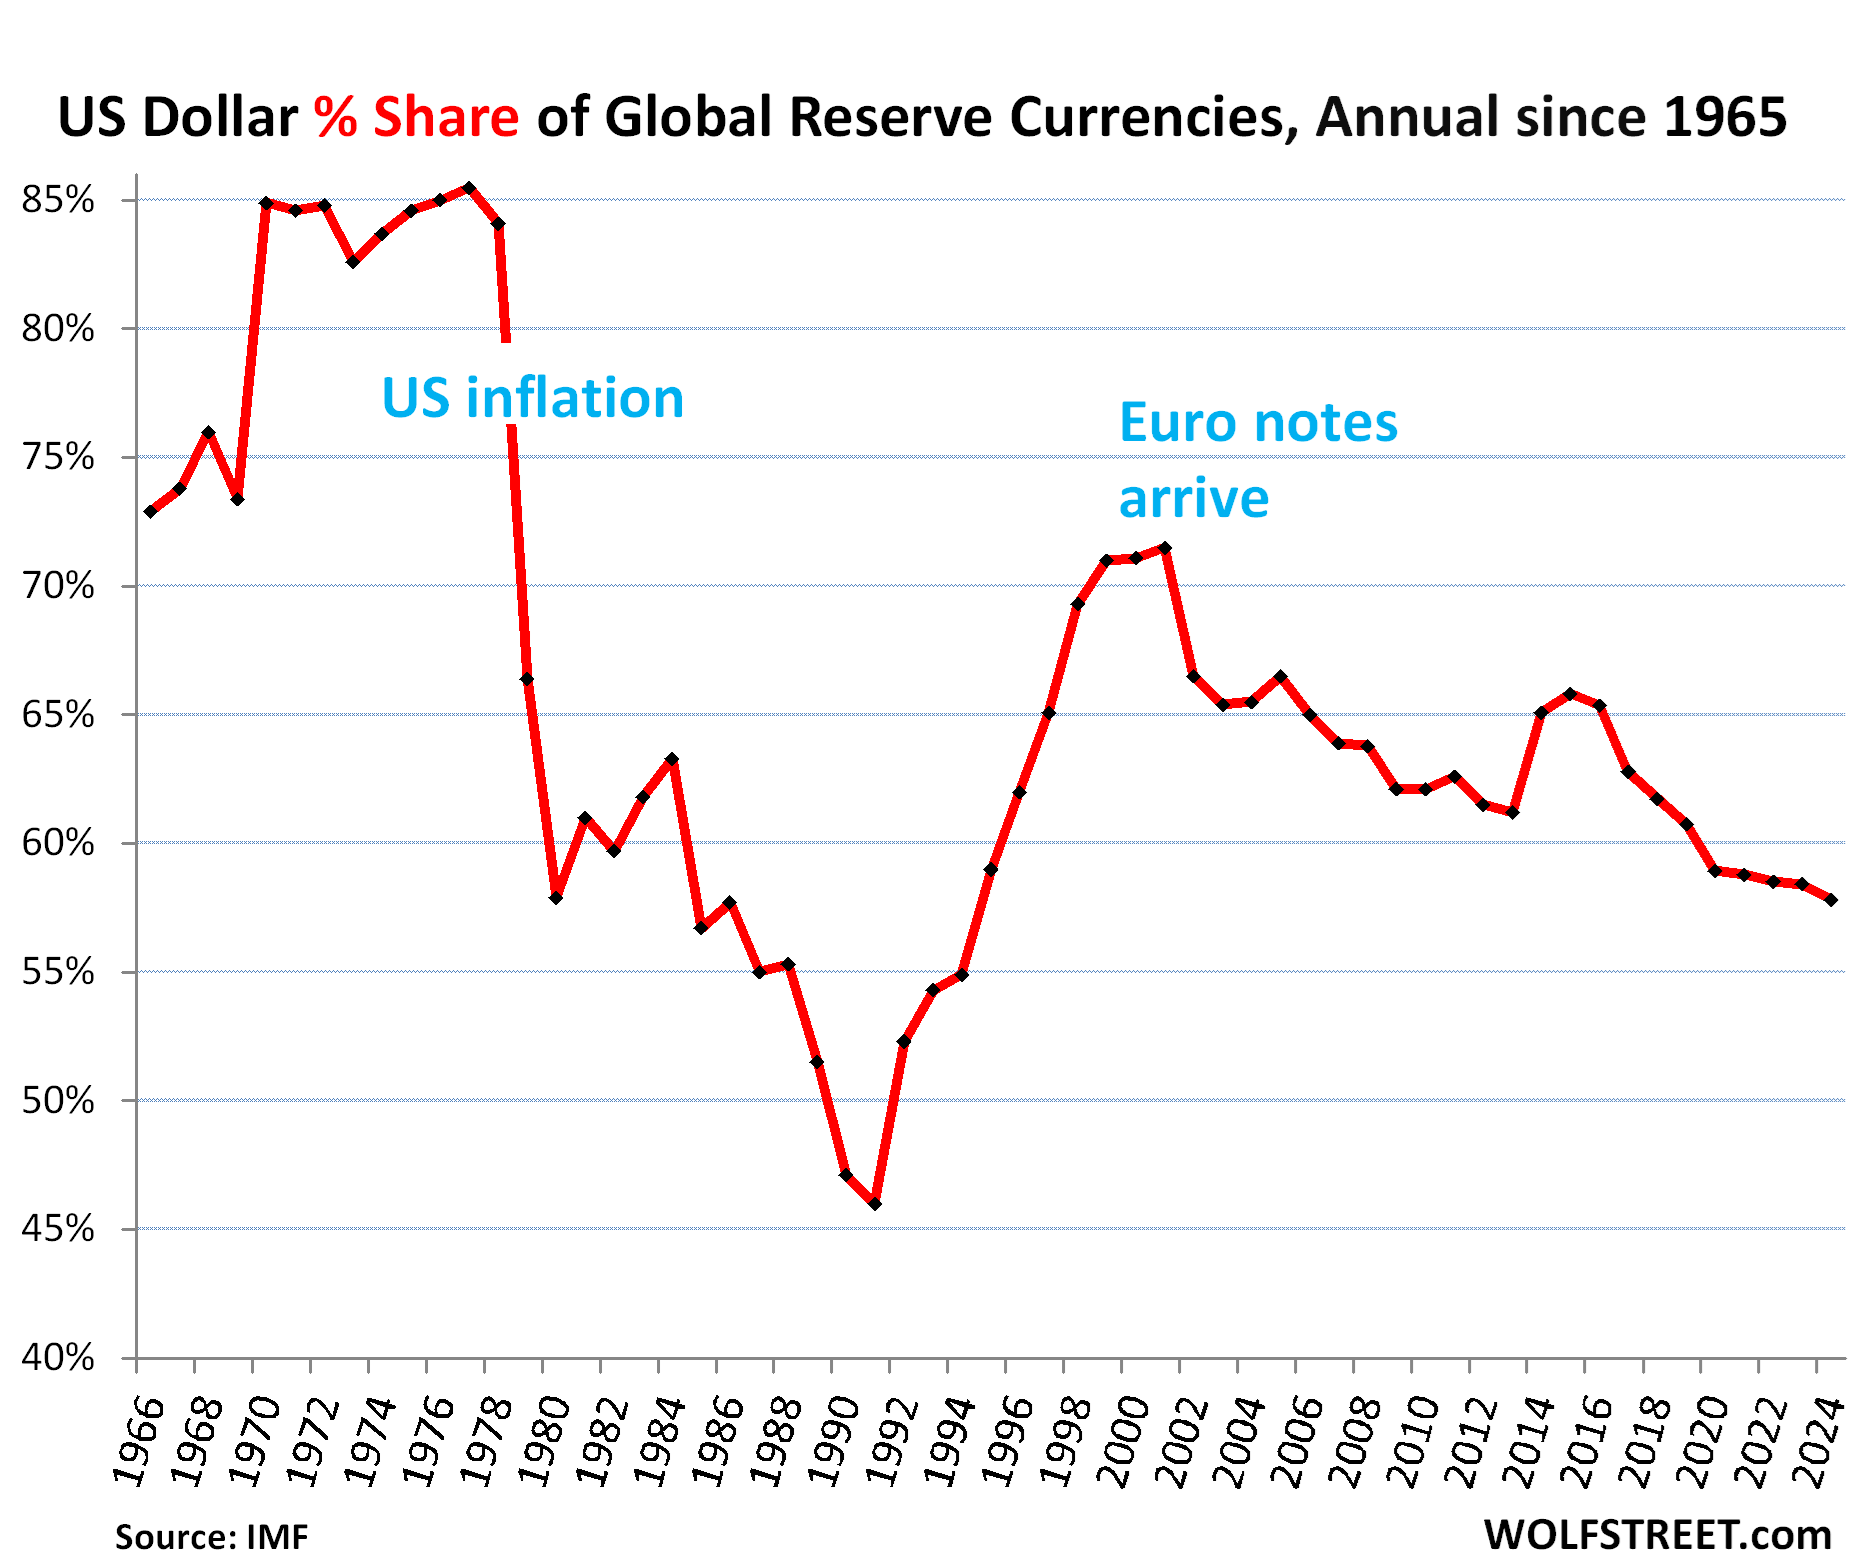
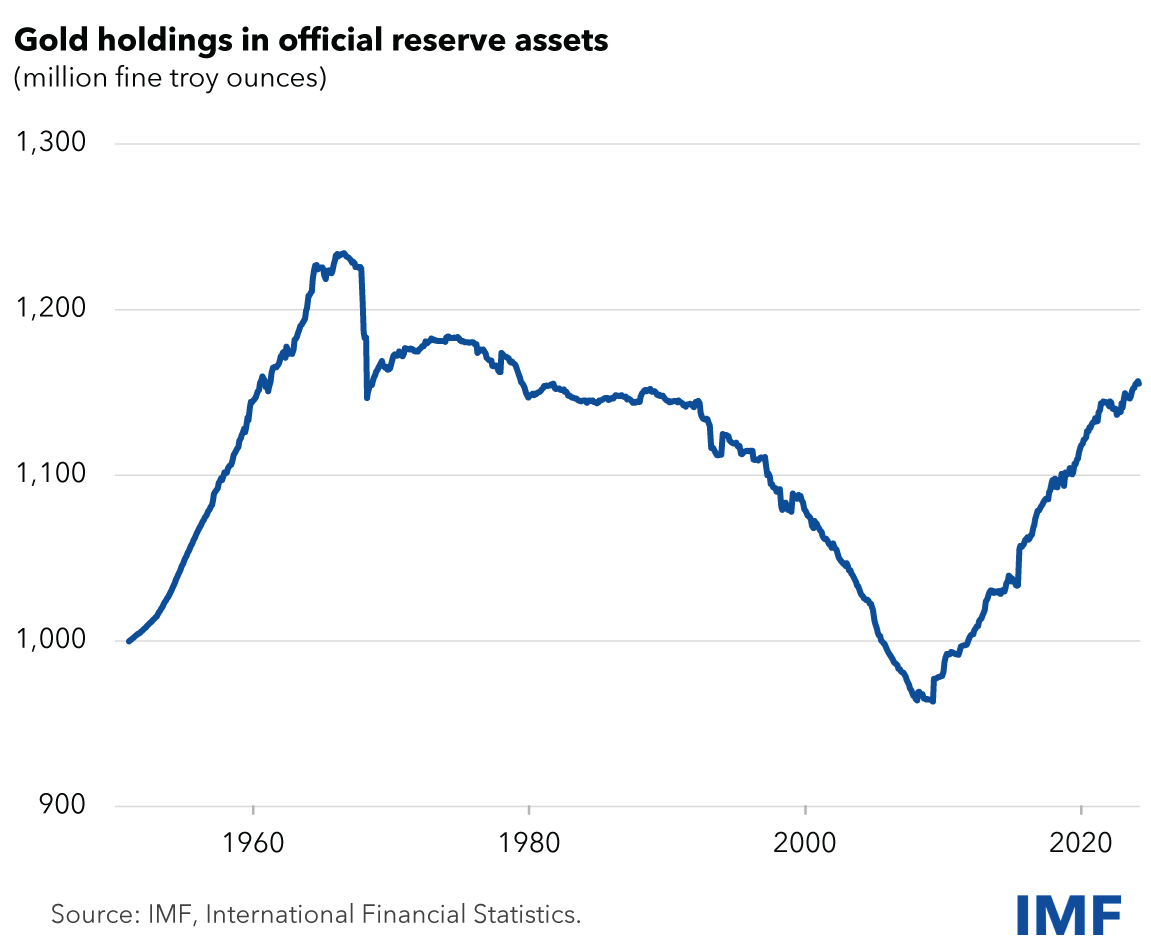
The status of the US dollar as the dominant global reserve currency has helped the US fund its twin deficits, and thereby has enabled them: the huge fiscal deficit every year and the massive trade deficit every year. The reserve currency status comes from other central banks (not the Fed) having purchased trillions of USD-denominated assets such as Treasury securities, other government securities, corporate bonds, and even stocks. The dollar status as the dominant reserve currency has been crucial for the US, and as that dominance declines ever so slowly, risks pile up ever so slowly.
The US dollar lost further ground as top global reserve currency in 2024, according to the IMF’s COFER data released today. Total holdings of USD-denominated securities by other central banks (not the Fed) fell by $59 billion to $6.63 trillion at the end of 2024, from $6.69 trillion at the end of 2023.
And the dollar’s share declined to 57.8% of total allocated exchange reserves at the end of 2024, the lowest since 1994, down by 7.3 percentage points in 10 years, as central banks have been diversifying their holdings for years to assets denominated in currencies other than the dollar, and into gold.
The dollar had already experienced a huge loss of global confidence before: Its share plunged from 85% in 1977 to a share of 46% in 1991, after inflation had exploded in the US in the 1970s and early 1980s. But by the 1990s, as inflation had been brought down and mostly stayed down, central banks loaded up on USD-assets again, and the dollar regained share as a reserve currency until the euro became a full-fledged currency.
USD-denominated foreign exchange reserves include US Treasury securities, US agency securities, US MBS, US corporate bonds, US stocks, and other USD-denominated assets held by central banks other than the Fed.
The major reserve currencies.
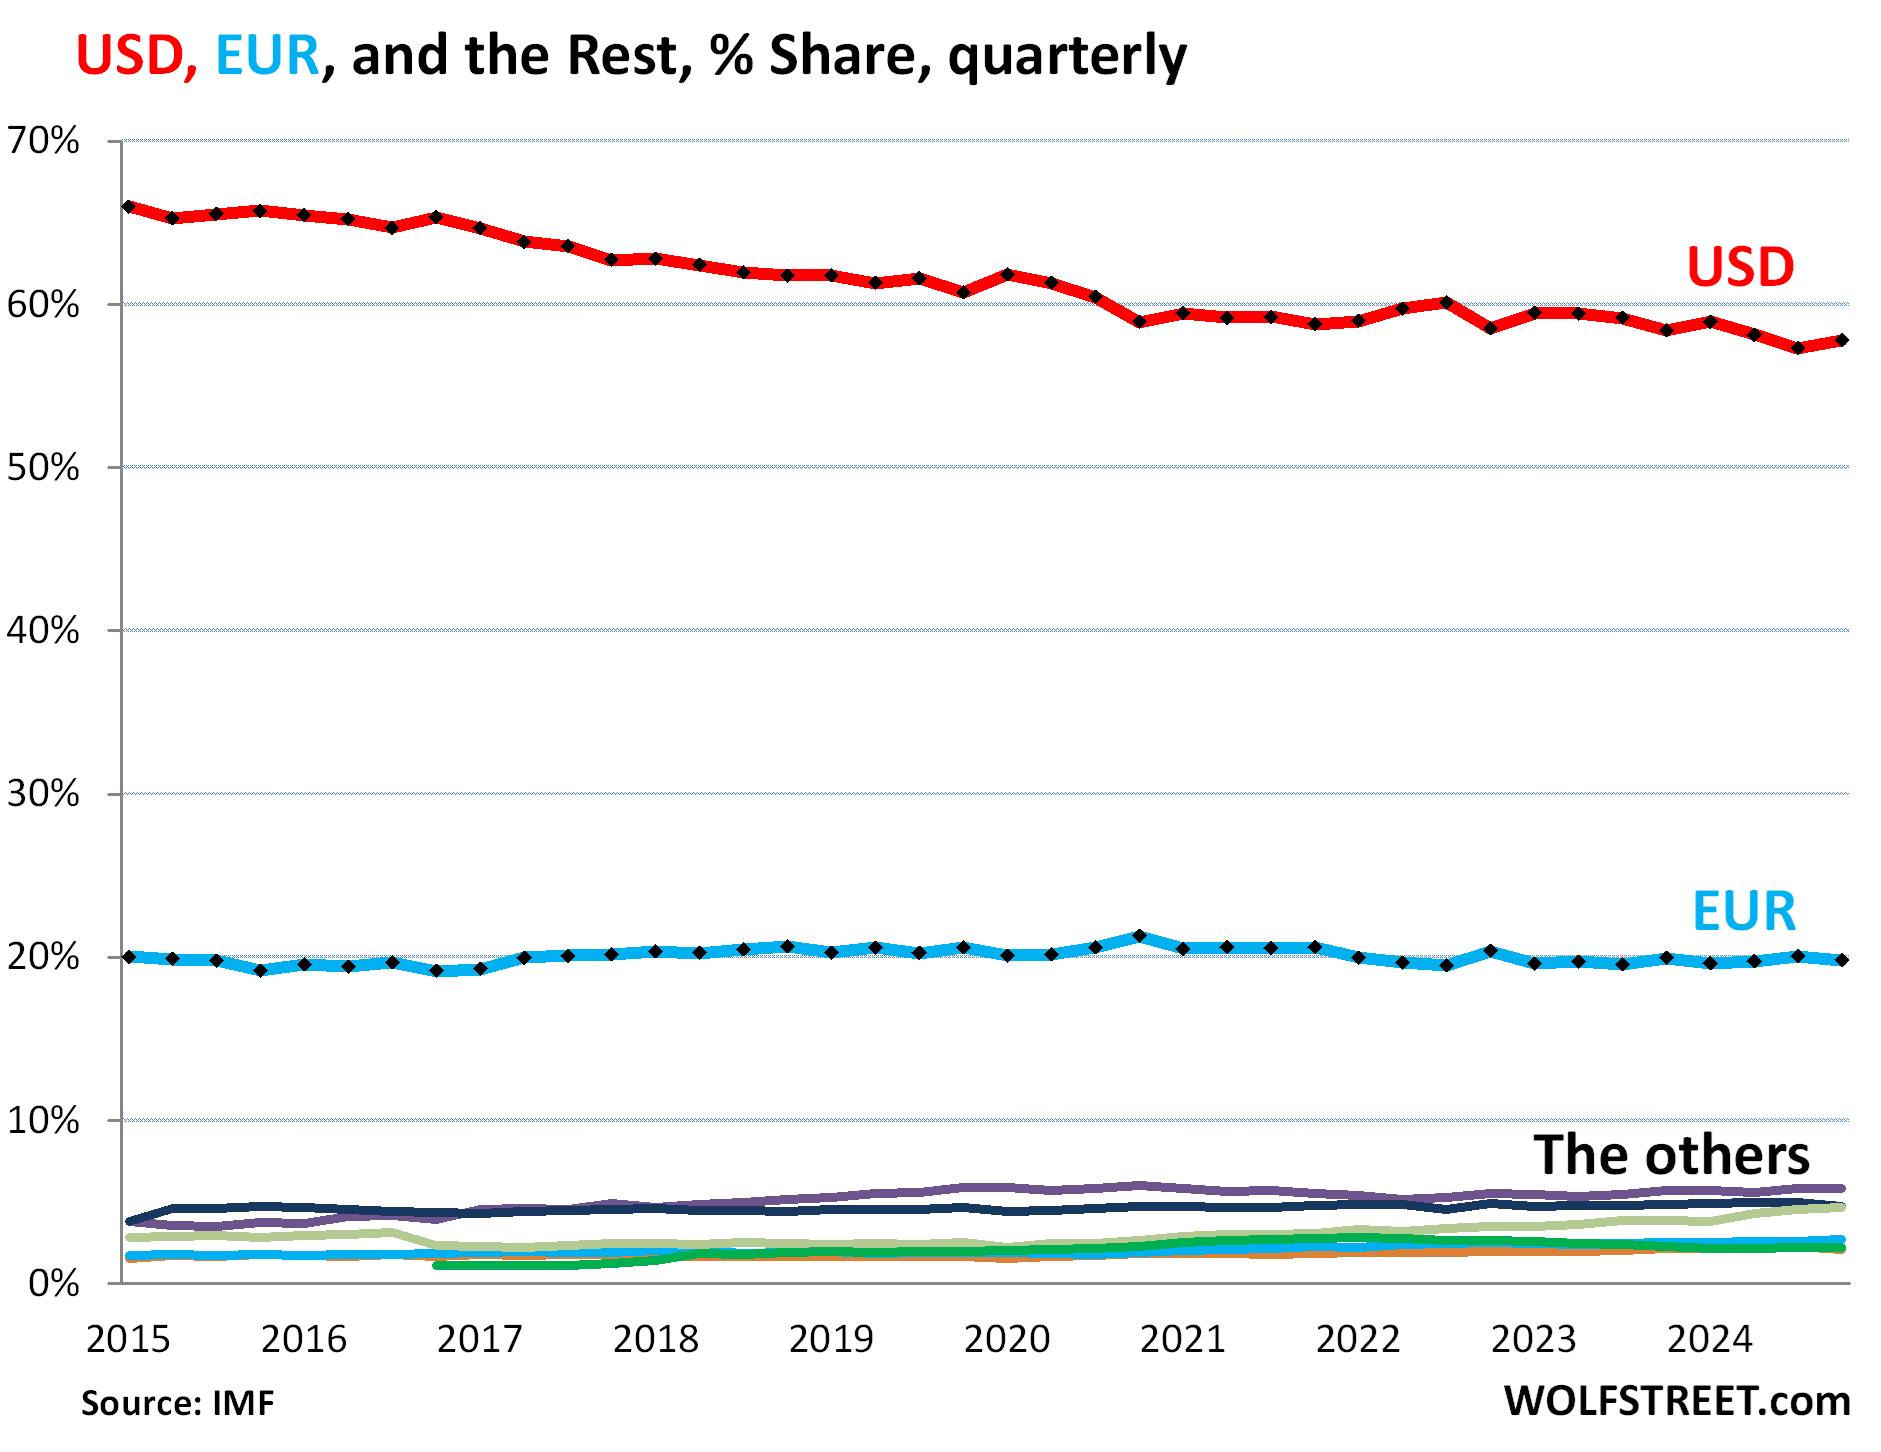
Central banks holdings of foreign exchange reserves denominated in all currencies, including in USD, edged up in 2024 to $12.36 trillion (from $12.35 trillion at the end of 2023).
Excluded from the total are any central bank’s assets denominated in its own currency, such as the Fed’s holdings of Treasury securities and MBS, the ECB’s holdings of euro-denominated bonds, and the Bank of Japan’s holdings of yen-denominated assets.
The USD is not losing share to the euro. The euro has been the #2 global reserve currency, with holdings at $2.27 trillion at the end of 2024. Its share has been around 20% for years, with a low of 19.1% in 2016 and a high of 21.3% in 2020. In Q4, the euro’s share was 19.8% (blue in the chart below).
So over the years, the USD has not lost share to the euro; it lost share to other reserve currencies, including “nontraditional reserve currencies,” as the IMF calls them. The colorful tangle at the bottom of the chart represents the largest of these other reserve currencies. More on those in a moment.
The surge of the “nontraditional reserve currencies.”
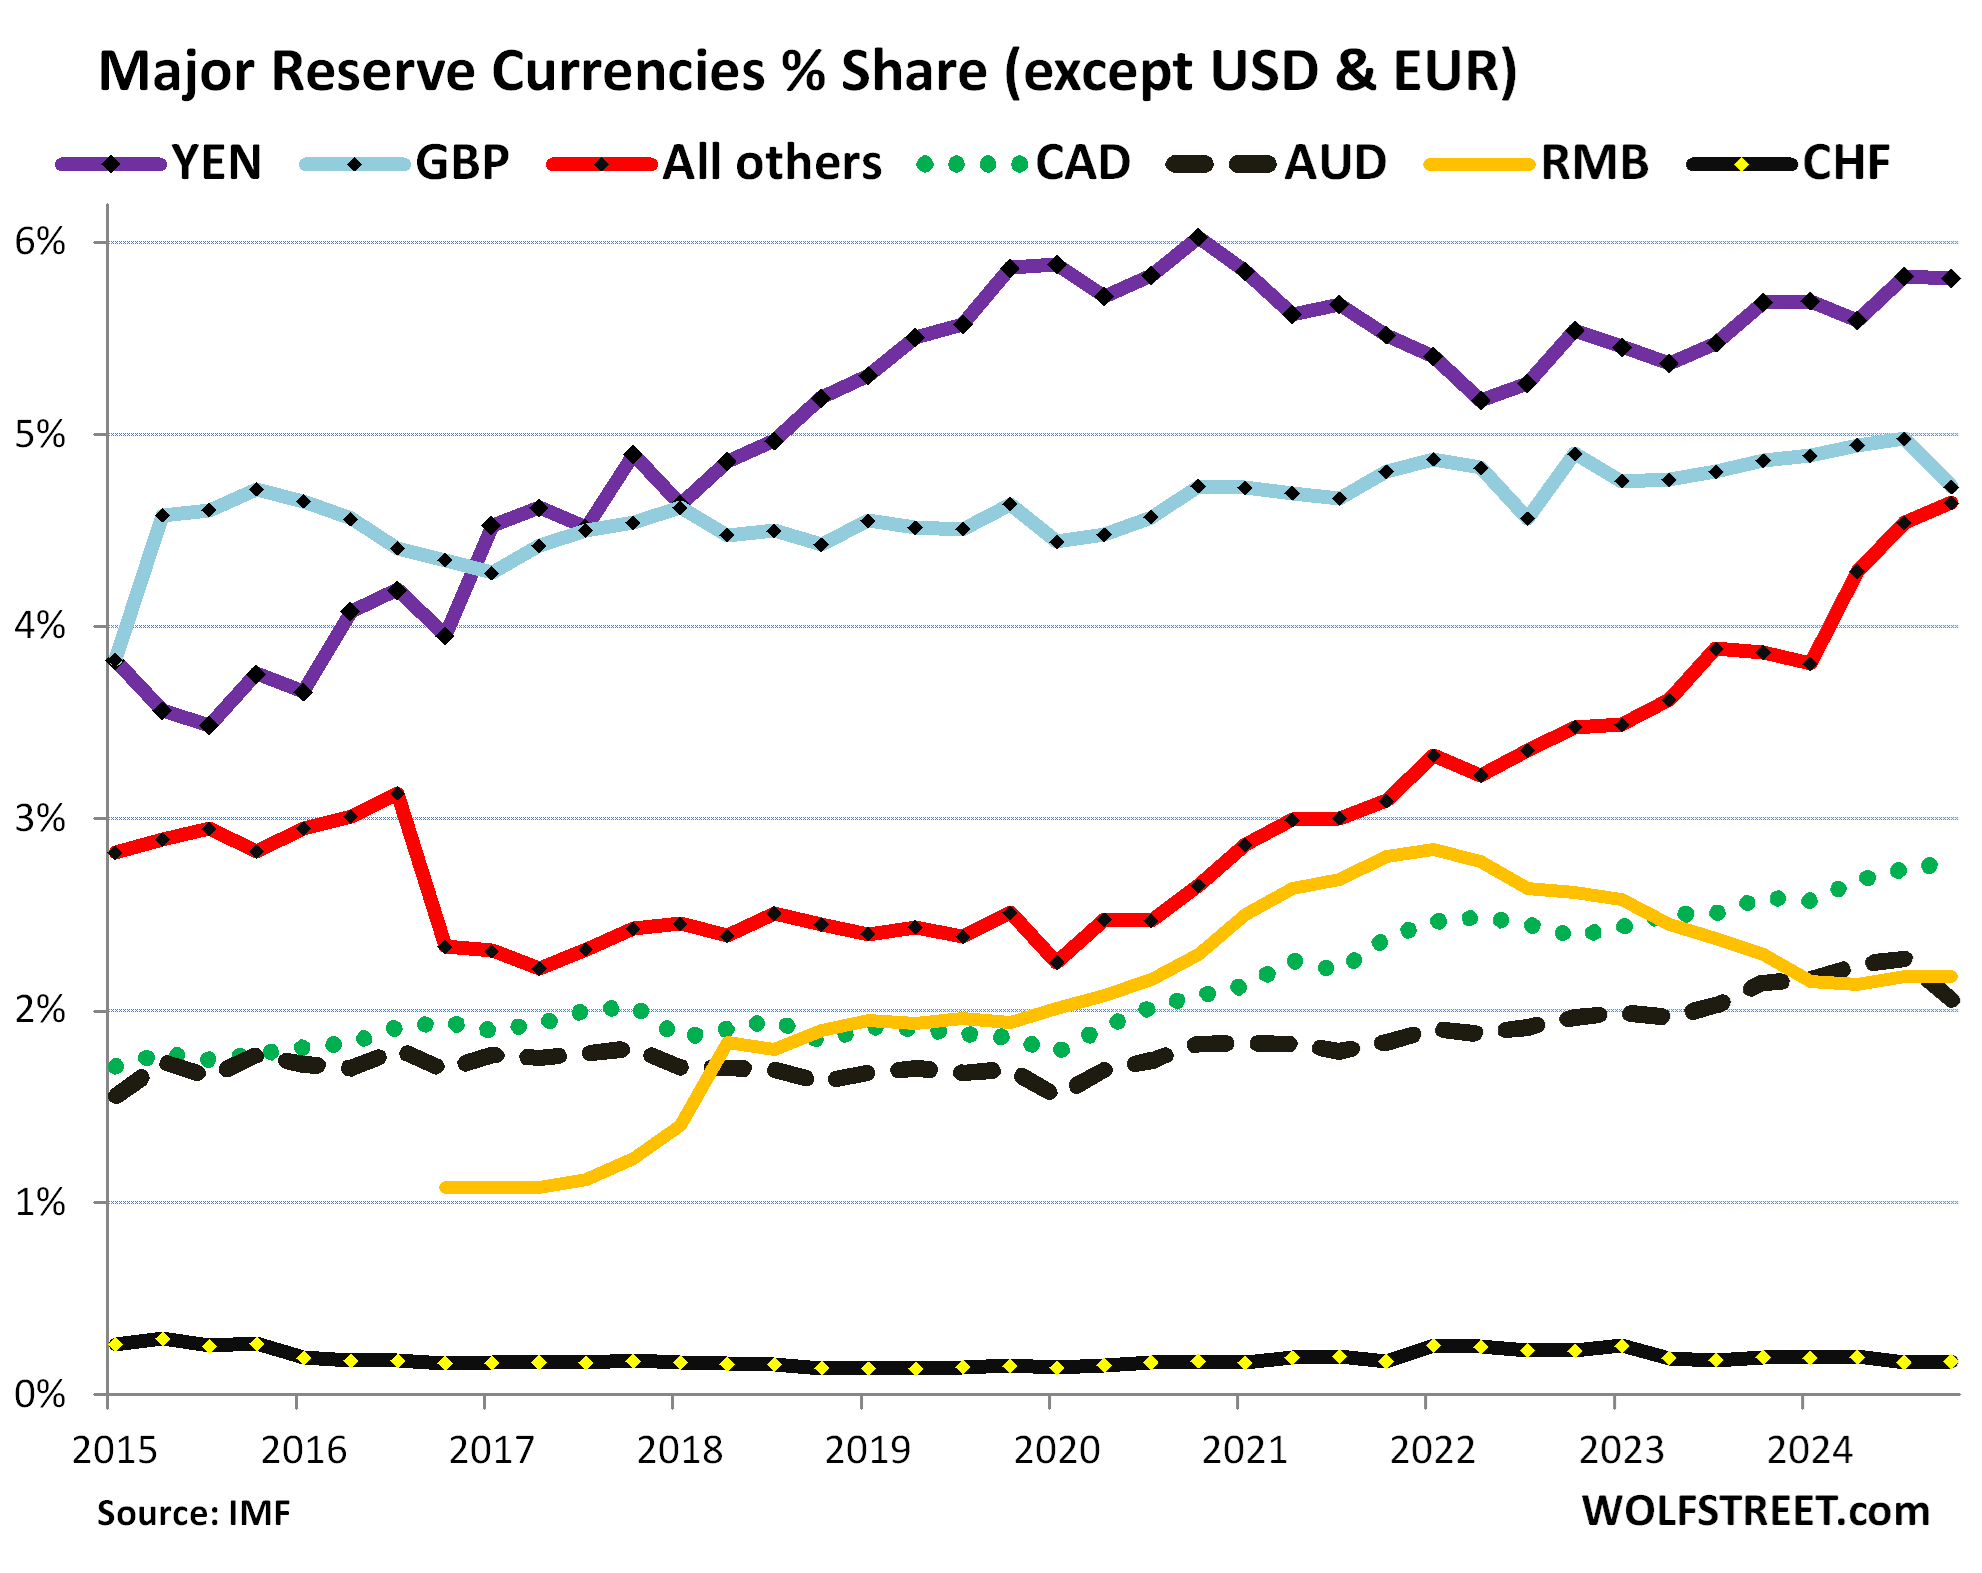
Some of these other reserve currencies have been gaining share at the expense of the dollar, especially the currencies in the basket of the “nontraditional reserve currencies,” that the IMF combines into “All others,” whose combined share has been surging since 2020 (red in the chart below).
But the Chinese renminbi has lost share. China is the second largest economy in the world, but its currency, the renminbi, plays only a small role as a reserve currency. And it has lost ground against the USD and other currencies since 2022. Central banks have not been enamored with RMB-denominated assets due to China’s capital controls, the RMB’s convertibility issues, and other complexities (yellow line).
Note the surge of the nontraditional reserve currencies combined in the “all other currencies” group (yellow).
Japanese yen, 5.8% (YEN, purple).
British pound, 4.7% (GBP, light blue).
“All other currencies,” 4.6% (red).
Canadian dollar, 2.8% (dotted green).
Chinese renminbi, 2.2% (yellow).
Australian dollar, 2.1% (black dotted).
Swiss franc, 0.2% (black).
The other diversification: gold.
Gold bullion is not a “foreign exchange reserve” asset of central banks and is not included in the data above. Gold is a “reserve asset” not involving foreign exchange.
After four decades of unloading their gold holdings, central banks started re-adding gold about 20 years ago.
The top four holders have not changed their gold holdings in at least 20 years (based on IMF data released by the World Gold Council):
US: 8,133 tonnes
Germany: 3,352 tonnes
Italy: 2,452 tonnes
France: 2,437
But there has been a lot of movement below the top four, especially with Russia and China, which are now the #5 and #6 largest holders. And they did move the needle:
Russia: 2,333 tonnes, little changed since Q2 2022. But between 2005 and 2022, Russia, one of the largest gold producers, had added nearly 2,000 tonnes.
China: 2,280 tonnes. In 2024, it added 44 tonnes. It started piling on gold in 2009 and by 2015 had tripled its holdings
Since 2005, Russia and China combined have added 3,626 tonnes to their holdings.
Smaller holders have added large amounts of gold in 2024, such as Poland, India, Kyrgyzstan, Uzbekistan.
According to the IMF figures not updated for 2024, central banks’ gold holdings have surged by roughly 200 million troy ounces (6,221 tonnes) from 2006 to 1.16 billion troy ounces, driven largely by China and Russia. The increases in China and Russia alone represent nearly 60% of the total increase since 2006.
In dollar terms, these gold holdings at today’s price amount to $3.65 trillion. The IMF’s chart has not been updated for 2024, but it shows the historic moves:
Enjoy reading WOLF STREET and want to support it? You can donate. I appreciate it immensely. Click on the mug to find out how:
ENB Pub Note: As of recent data, the United States consumes approximately 20 million barrels of oil per day. This figure is based on averages from 2023 and 2024, with the U.S. Energy Information Administration (EIA) reporting total petroleum consumption at around 20.25 million barrels per day in 2023, including biofuels. Daily consumption can fluctuate slightly due to seasonal demand, economic activity, and other factors, but 20 million barrels per day is a widely accepted estimate for current usage. This includes various petroleum products like gasoline, diesel, jet fuel, and others, with transportation being the largest consuming sector.
United States imports approximately 6.5 million barrels of crude oil per day. This figure is based on 2023 averages from the U.S. Energy Information Administration (EIA), which reported crude oil imports at about 6.48 million barrels per day for the year. When including all petroleum products (such as refined products like gasoline and diesel), total petroleum imports rise to around 8.51 million barrels per day in 2023.
As of recent data, the United States produces approximately 13.3 million barrels of crude oil per day. This figure is based on the U.S. Energy Information Administration (EIA) reports for 2024, with production averaging 13.31 million barrels per day in December 2024, and projections suggesting a slight increase to 13.7 million barrels per day by the end of 2025. This includes output from major regions like the Permian Basin, which contributes nearly half of the total. Production levels can fluctuate due to market conditions, weather events, or operational changes, but 13.3 million barrels per day reflects the current daily output as of late 2024, with a trend toward gradual growth into 2025.
As Oil is priced on a global market, a large demand from the US will impact WTI faster.
Late on Sunday, Trump warned that he could impose secondary sanctions on Russia’s energy sector.
WTI crude gained almost 3% on Monday morning.
Trump threatened to bomb Iran if a new nuclear deal is not agreed.
U.S. benchmark crude oil prices soared 2.65% on Monday, with West Texas Intermediate (WTI) hitting $71.20, up $1.84 at 11:47 a.m. ET on fears Trump will follow through on more tariff threats for buyers of Russian oil, combined with the prospect of a military response to Iran.
Brent crude was also climbing on Monday, up 1.47% to $74.71.
Two geopolitical deals are in play here. The first is a ceasefire deal over Russia-Ukraine, and the second focuses on a new deal over Iran’s nuclear program.
Late on Sunday, Trump warned that he could impose secondary sanctions on Russia’s energy sector if the U.S. and Russia are unable to reach a ceasefire agreement regarding the war in Ukraine.
“If Russia and I are unable to come to an agreement to stop the violence in Ukraine, and if I believe Russia is responsible — which may not be the case — but if I believe they are to blame, I will impose secondary tariffs on all Russian oil exports,” Trump told NBC.
Trump lashed out at remarks made by Putin, who questioned the legitimacy of Ukrainian President Volodymyr Zelensky’s government and suggested that a change in leadership may be necessary for a peace deal to be valid. Putin has consistently emphasized that elections in Ukraine will have to precede any ceasefire deal.
Even more worrying to markets, Trump earlier on Monday threatened to bomb Iran if a new nuclear deal is not agreed.
“If they don’t make a deal, there will be bombing,” Trump said in a telephone interview with NBC. “It will be bombing the likes of which they have never seen before.” The U.S. president said, however, the two sides were engaged in negotiations, which did not prevent him from extending a 25% indirect tariff threat to Tehran.
Trump’s remarks follow Iran’s official refusal to engage in direct negotiations with the U.S. Tehran emphasized that its willingness to negotiate would depend on the actions of the U.S.
In the meantime, oil and gas executives in the Dallas Fed Energy Survey published last week said they expected WTI to average $68 per barrel for the six-month forecast, $70 per barrel for 12 months and $74 for the two-year forecast, reaching $80 in five years.
Energy Will Find A Way – Activist shareholders: good or bad?
With the Just Stop Oil crew claiming victory and shutting down their protests, did they win? Or is there something to the rumor that people are waking up to the realities of energy? This week, David Blackmon, Irina Slav, Tammy Nemeth, and Stu Turley will cover that and several other topics that are changing in real time.
Highlights of the Podcast
00:12 – Introduction & Investor Discussion
05:45 – ESG Investing Impact on US Oil Industry
07:44 – UK Windfall Tax & Political Impact
10:25 – Managed Transition Strategy
14:22 – OPEC+ Supply Easing & Global Market Impact
27:26 – How Russia and China are seizing on Canada’s carelessness in the Arctic
33:02 – Labour launches net zero crackdown on boats
36:58 – Opinion: Is Mark Carney ‘Canada first’ or net zero first?
40:21 – Five Energy Transition Lessons for 2025
41:26 – Commentary: US LNG exporters could hit methane snag in Europe.
45:55 – Peak Permian? Geology and Water Says We’re Close
46:13 – How cheap is Russian natural gas via pipeline compared to LNG imports
48:50 – Most Polls: Most Voters Prioritize U.S. Energy Independence Over Climate Fight
53:30 – Green Policies & Clean Coal Technology
56:27 – Exporting Nuclear Energy as a Service
Irina SlavInternational Author writing about energy, mining, and geopolitical issues. BulgariaDavid BlackmonPrincipal at DB Energy Advisors, energy author, and podcast host.Principal at DB Energy Advisors, energy author, and podcast host.Tammy NemethEnergy Consulting SpecialistStuart TurleyPresident, and CEO, Sandstone Group, Podcast Host
Energy Will Find A Way – Activist shareholders: good or bad?
Irina Slav [00:00:12] Well, hello, everyone. This is the Energy Realities podcast and Tammy Nemeth just disappeared from view. We hope she’ll be coming back because we’re one David Blackmon short today. We hope everything is fine with you, David, and you come back next week. So hi, Tammy. She’s back. So we have Tammy Nemeth in the UK, and Stu Turley in the US South, and me Irina Slav. How is everyone today?
Tammy Nemeth [00:00:43] Good
Stuart Turley [00:00:46] It is Monday morning and I’m ready for Wednesday.
Irina Slav [00:00:53] I’m ready for Saturday, but nobody’s asking us, are they? Now, today we’re talking about the fact that energy will find a way… In the sense that some people in the financial world are waking up to the fact that there are some investments that make money and some investments that don’t make money, and the investments that make money seem to be in oil and gas, which is why we’ve had one activist investor group, Elliott Management, short some European big oil mages and build stakes in other European Oil majors, but they’re not touching the US majors. Tammy, what do you think about all this?
Tammy Nemeth [00:01:38] Well, I think Elliott had targeted some American major companies before. I think they were involved with Hess, maybe, and Marathon. And a couple years ago, they had taken an activist position with Suncor, which is one of Canada’s largest oil producers and completely changed. the management and governance and direction or whatever. Under the previous CEO of Suncor, Mark Little, they were really going down the ESG climate route, investing in, well, Canada sort of, they had to invest in different carbon capture, but they were, really. um supporting a lot of the ESG groups and whatnot and um so when Elliott came in they took a position like okay you need to be focusing on your core function as an oil producer and only engage in things like carbon capture if you have to and if it’s profitable and so I think that’s an interesting element of um of of what Elliott’s been doing at least in the oil and gas space end. There is, I think, a distinction there between different kinds of investors, right? So you have activist ones that want to take a more activist position, engaging with things to change how the company operates in order to increase shareholder value and to make sure they’re doing fiduciary duty. And then there’s the other kind of activist investor that maybe we’ve I’ve heard a lot of. over the past few years which have sustainability or climate or ESG measures as the as the primary thing and so you can kind of do a pro and con you know which is activist investing a good thing is it a bad thing do we only like it when it’s actually making oil and gas companies do what they’re supposed to do or do you know do we not like it when it’s something like engine number one where they come in to change the purpose really of what a company is is supposed to do or what their what their core value is um i don’t know i think that’s that’s an interesting element of the discussion, what do you guys think?
Irina Slav [00:04:03] investors by definition want to get some money out of their holdings in various corporations and well follow this which is a climate activist investor group is not about this it makes money from donations because it invests on behalf of a lot of individuals. So it makes money from the dividends it gets from big oil mages, while pressuring these oil magers into stopping to be oil magists. But it seems that’s what Elliott Management is doing. And there was another one, Blue Bell Capital, I think, they were… I can’t remember the supermajor they invested in, but they wanted the same thing, go back to what you do best. oil and gas, talking about and trying to do an energy transition. So for these activists like Elliot and Bluebell, it’s all about the money, as it should be, I think. I mean, if you’re investing, that’s the definition of investment. You put some money into something and you want to get money out of it. It’s not about morality or upholding some values. That’s a very different kind of thing.
Tammy Nemeth [00:05:24] which is more like what you would call impact investing, where they’re trying to have.
Irina Slav [00:05:28] It’s not investing though.
Tammy Nemeth [00:05:29] It’s no investing then,.
Irina Slav [00:05:31] Yeah. You’re funding something to something that reflects your moral values, or whatever. Stu, what do you think?
Stuart Turley [00:05:45] I think that there’s a couple things that have impacted the U.S. oil major, all oil companies, because 50% of the oil and gas in the United States is done by privately held organizations as opposed to publicly held ballpark. And ESG Investing has done a great thing to the United States oil and gas uh, companies that they are fiscally, uh, more responsible, like I, to Irena’s point, giving back to investors, their, their money. So when president Trump is saying, I want to drill baby drill and drive prices down to $50 oil, well, president Trump kind of forgets it’s a global market. and that the US oil and gas folks are more interested in giving their money back to their investors and shareholders. So ESG has done a good thing with the environment, social, and governance aspect to the US. I think it’s kind of ironic that the BP and Shell in the UK are are looking seriously at. at there’s rumors that they are going to be listed on the US Stock Exchange, is the UK energy policies driving them out of the UK. And if they do leave the UK, that’s a lot of revenue that they’re going to Be losing from profitability and tax. So it’s kind of silly to throw away a tax base, in my opinion. at the sacrificial of what keeps your lights on.
Irina Slav [00:07:44] Well, there was some report recently, I think it was in the Financial Times about the UK, some industry lobby group saying that the windfall profit tax must be removed otherwise the industry is going to up and leave.
Tammy Nemeth [00:08:01] I don’t think they care. I think that the labor government would be happy to see them go, as ridiculous and stupid as that is, because they’re ideologically driven. They’re ideologically driven. And when that’s the case, then what the business sense is or what that means for national security, they don’t care.
Irina Slav [00:08:26] They will start pouring when the money stops flowing in. I mean, I’ve made this argument before. We’ve all made it. You can’t tax them and expect them to stay, to be taxed to the death.
Tammy Nemeth [00:08:42] I know.
Stuart Turley [00:08:45] I want to ask this question as we sit here and take a look at energy security and energy will find a way and so if it’s almost kind of like BP and Shell will energy will find a way they’re going to survive and give money back to their their stakeholders. I mean it’s like those science fiction you know where life will find away Jeff Goldblum in dinosaur movies, you know, life will find a way. And I think companies are going to find a way to survive, if at all possible. is the look at Norway. Norway is a perfect example years ago, Irina, when they were trying to shut down the Norway gas fields and all of a sudden the Ukraine war starts. Now Norway is the number one producer for natural gas in the EU. You take a look, and suddenly it’s okay.
Irina Slav [00:09:46] and yet their sovereign wealth fund which became the world’s biggest sovereign wealth fund thanks to oil and gas money is now so very green it wants to divest from oil and which is absurd, but then happens, yeah.
Tammy Nemeth [00:10:04] They haven’t, they’re close. I think they’re maintaining some of the old ones, but they will not invest in anything new, is my understanding. But you know-
Irina Slav [00:10:15] to change their minds soon enough.
Tammy Nemeth [00:10:20] Probably. Um, I wonder
Tammy Nemeth [00:10:25] I wanted to comment about the impact investing. So if you have these, some of these sustainable activist investors, if you read what advocates of this approach are saying, people like Mark Carney, for example, what they want to do is have investments in high emitting companies like oil and gas companies. And then, basically… siphon off the money to carbon offset companies that the investors will also own and to phase out the operations of the oil and gas companies. And this is what they refer to as a managed transition so that you can slowly, year by year, suck the value out of the emitting company and then pay it into say an offset company that you also own and therefore it shifts that wealth and value from the high emitters to these other groups until you can just phase them out, which is like winding down the company. I mean, that’s the whole point of transition plans for companies. It’s a plan to be put out of business. It’s like when people… Corporate vampirism. Yeah it is and and if you think of it in in those terms because it’s on this trajectory right so we’re we’re gonna put that company out of business by 2040 or 2050 and that’s a fair distance down the road and then people aren’t really they’re like oh they’ll never do that you know things will change or they can’t be serious but that’s the point of having the transition plan to to show and demonstrate to these activist shareholders how they’re putting that company out of business over a period of time. By sucking its money out. By sucking it’s money out and you know when you have groups or jurisdictions like the European Union where they’re saying this is the target 2050 net zero, well what is net zero mean. And so if that means that your emissions have to balance to zero, how do you get them to zero? So which is why they say the hard-to-abate aspects will be, you’ll get to net zero by purchasing these carbon offsets, whether they’re nature-related or some other means, like you’re sucking the CO2 out of the atmosphere or whatever. So then you end up shifting the money to those organizations. out of the profitable company and until it’s no longer viable and the company folds, which is in contrast to what Elliott’s doing, right? Which is, you know, we want to create more value out of this company and get back to its core operations.
Stuart Turley [00:13:19] How is the rest of the world looking at the United States right now with president Trump’s, uh, uh department of, um, Lee’s Zeldin redefining CO2 pollution as not a pollution.
Irina Slav [00:13:39] It doesn’t really really matter on a global level because that was your thing guys you you you I Say your thing. I mean the government not you regular Americans I I really don’t see what change this will make on a local level
Stuart Turley [00:14:00] I agree, except the United…
Irina Slav [00:14:04] in the US, because you can’t rub companies’ noses into your pollutant with carbon dioxide, because it’s not a pollutant. That’s a very good question from Fereydoun Barkeshli. who’s reading it.
Stuart Turley [00:14:22] May I please, this is from, and I apologize for butchering your name. I am so bad being from the South for, yes, his name, Barkeshli. May I, please divert from your main topic today and ask how you expect the market reactions to the April one supply easing of OPEC plus. I mean, releasing the voluntary cuts.
Irina Slav [00:14:49] This point I don’t think there will be any strong-minded reaction because as we learned this week Trump is pissed off With Putin and is threatening secondary sanctions He was also threatening Iran with bombs the likes of which they haven’t seen before So, you know easing the cuts by a measly 138 thousand barrels daily. It’s nothing compared to the risk of losing millions of barrels daily in Russian and Iranian supply. I’m not sure this is going to happen. Actually, I don’t think this is going to happened, but we know that oil traders read the news and base their decisions on the news.
Stuart Turley [00:15:35] That is a good question. The dark fleet is what? Between 700 and 900 ships. And with the dark fleet, President Trump’s sanctions on Venezuela, anybody in additional tariffs on Venezuelan oil is going to be fairly interesting. Because if China continues to buy Venezuelian oil, That is a huge uh, impact in per string. So Wednesday’s announcements of the final tariffs and his plans on Wednesday for president Trump, I think will be some Please question whether or not OPEC and OPEc Plus have the pricing controls and mechanisms that they used to have because of the Dart fleet. I mean, you take a look at 900 tankers, that’s a lot of oil that Russia has been selling and Russia has had actually a 4% GDP growth year on year last year. uh, as sanctions don’t work as intended and all they did was enforce the fact that president Putin no longer needs the EU, uh, in order to do business. And that is why president Trump is so frustrated at president Putin because president Trump actually has the wrong team in place, trying to figure out what’s going on. So
Irina Slav [00:17:17] I think he just wants to end this whole Ukraine affair as quickly as possible. I couldn’t agree more. Yeah, but the Russians want elections.
Stuart Turley [00:17:29] Yes, and I kind of agree with.
Irina Slav [00:17:33] Yeah, they want to make sure that whatever deal is signed is signed with an actually legitimate government and not an unelected president who could have held elections. If you can have parties, you can also have elections.
Stuart Turley [00:17:49] And unfortunately, I think that…
Irina Slav [00:17:51] I need elections.
Stuart Turley [00:17:55] I think President Trump’s team is missing your point, Irina. I think they should listen to you.
Irina Slav [00:18:01] Oh sh- no, no, I’m sure they can do their. They just need a little patience. No, we have nothing else to say about activist investors.
Stuart Turley [00:18:21] I think that I had the opportunity last week to actually go out to the field. I’m gonna bring the video up and turn the video down. Let me stop that. And I really enjoyed going out to field and only in Oklahoma can I walk a field for my investment. I’ve got an investment in oil and gas. And I, well, I can’t find the video here. Let’s see if this is it. Yep. And come over here. Where are you? It is not working. Figures. Anyway, I’ll just describe it. Here I am on an oil pad. We have our drilling rig over here, drilling. We are walking out three other oil well spots. and I have completed wells over here, and then I have wind farm behind me. And only in Texas will you see wind farm, the wind is so strong, it barely keeps my hat on, and so my cowboy hat. But the oil and gas private investors are giving back to their shareholder and the amount of drilling activity is. There’s a lot of going around about the Permian being peeked out. And in fact, your friend wrote a great article on that. But activist investors in the majors, I think have had some good things that they’ve done. And I think ESG investing is a prime example of that. But I think, Tammy, to your point of activist investors changing the focus of the business. is derogatory and contrary to giving shareholder value back. It’s actually bad.
Tammy Nemeth [00:20:21] Yeah, well, I think one of the interesting things about Elliott management is that they’re really ESG agnostic. So if there’s money to be made in pursuing a certain sustainability strategy within a company, then they will promote that and do that. But BP was spending a lot of money on wind projects, on solar projects, and so on, that were draining money out of the company. and reducing its value, which means therefore that shareholders don’t receive such a good return on their investment. But there’s other things that BP is doing, such as its partnering in doing a carbon capture project, which enables it to keep operating in the UK. And that, you know, they’re not backing away from that element of the company. So. I think if an activist investor truly cares about getting a return on investment, it becomes a matter of is this about helping shareholders get a return or is it about, as Irina had And people will embrace one side or another these days, unfortunately. So I think it’s interesting that these developments are happening, particularly in the oil and gas space, which may have been sort of diverging and trying to cover all their bases, as it were, with respect to the different climate and sustainability things that have been happening in, at least in the Western world.
Irina Slav [00:22:00] But then we have, I just wrote an article today for Substack about pension funds and the ESG drive among them. And I was really surprised to learn that CalPERS, the California pension fund, the huge big California pension funds, which is so very green, actually has a lot of stakes in oil companies and it classifies them as climate friendly.
Tammy Nemeth [00:22:26] I think it depends on what their transition plans are. So sometimes they’ll invest in a gas company.
Irina Slav [00:22:36] So I find it difficult to call this moral in any way, or even moral justice.
Tammy Nemeth [00:22:45] You had mentioned in your substack about some of these pension funds doing the big PR thing, we’re pulling out of State Street or whatever because, you know, and then switching over to a Mundy or these other ones that are more sustainable apparently. And so sometimes they do that just to embarrass the large institutional investor to try to that peer pressure and bad PR. because the PR actually counts against a company’s, even an investment firm’s score, you know, whether it’s an ESG score or how shareholders examine these things. PR sometimes matters.
Irina Slav [00:23:28] But what amazes me is that this only works among people with a mental age of below 18. Let me put it this way. So what amaze me is there are so many people in responsible corporate positions that have the mental age below 18 and even below 15. The business world should not be like that, but it is, apparently. Yeah,
Stuart Turley [00:23:59] Unfortunately, my wife, Irena, says I have a mental age in capacity of a 12 year old. So, you know, it’s.
Irina Slav [00:24:06] 12 year olds are great, but you’re not ideologically indoctrinated, you were raised right as a 12 year old.
Stuart Turley [00:24:15] There you go, yes, I had my own job when I’m mowing yards and worked, got out of college and didn’t owe any money. So yes, it’s a whole different animal.
Tammy Nemeth [00:24:29] If I can just kind of weave something into this conversation is that, you know, in the United States, the House Judiciary Committee had done an investigation into some of these ESG activist shareholders. And they had released two interim reports, one back in June last year and one in December. And I think the latest one was called sustainability shakedown. And they were describing how. the Glasgow Financial Alliance for Net Zero, or GFANS, which is the baby of Mark Carney, Climate Action 100 Plus, which is another one of these kind of peer pressure organizations, and engine number one, we’re using their activism in order to undermine the fiduciary duty and shareholder value of oil and gas companies, and they use the example of ExxonMobil in particular. and how engine number one had succeeded in replacing board members and basically forced Exxon to start doing some investments into renewable projects, which they didn’t really want to do, but they felt like they were being pressured to do so. And then explaining how this was actually an antitrust behavior, because that was using these different peer pressures. You had to sign up, be part of this G-Fans club, and then. you would commit to these different elements of transitioning your company and you would they would use this peer pressure in order to force companies to change their core their core principal values and so I think that’s an interesting contrast to what Elliott has been doing Elliott management in order, to try and have companies comply with fiduciary duty as they’re intended. rather than this other thing, but I wanted to put in the House Judiciary Committee reports because they’re really important and you can read all of the interviews that they did, including Mark Carney from GFANS, Mary Shapiro with GFans, and they’re quite eye-opening.
Stuart Turley [00:26:45] I think if you overlay DOGE spending and impact of USAID and climate activism on top of that report, you will get air sick.
Tammy Nemeth [00:26:58] For sure. Yeah.
Irina Slav [00:27:03] Okay, shall we go to the stories and the headlines?
Stuart Turley [00:27:11] And let’s see here. first out of the block.
Tammy Nemeth [00:27:18] Okay, so there was a really great article in The Telegraph about how Russia and China are seizing on Canada’s carelessness in the Arctic. One of the complaints that Donald Trump has had about Canada is that we’re freeloaders on, especially when it comes to defense, because Canada’s military is a shambles. We keep saying we’re going to build stuff, and then we don’t build anything, we throw money at stuff and nothing, we get very little from it. And one of the big things is the Arctic. Canada claims all this different territory in the Arctic, but we have very little to actually defend it. And the previous government, the conservative government of Stephen Harper, had tried to build different things to defend the Arctic and always ran into roadblocks and When Justin Trudeau was elected, he decided to slow things down and not want to spend that money on that kind of defense. But there’s been all of these developments between Russia and China in building icebreakers, creating different routes through the Arctic, building bases on Russian territory throughout the Arctic. and Canada has really sat back and not done anything. And so this article is really great in describing how this is a security issue and one of the things that Moscow and Beijing are taking advantage of Canada’s negligence. So it’ll be interesting to see what happens after the election with respect to that.
Irina Slav [00:28:58] How are they taking advantage of Canada? I mean they all have their respective territories I mean Canada and Russia. Russia’s not building anything on Canadian territory, is it?
Tammy Nemeth [00:29:09] But I think one of the points of the article is that they’re taking advantage of Canada’s absence because Canada’s not building anything to sort of compete against it. I don’t know. I mean,
Irina Slav [00:29:24] No, the telegraph is rapidly anti-Russian, so this doesn’t surprise me, but it is, it is. I mean, one of the first ones who suggested it was put behind the Heathrow outage. Right, right. I mean you have Arctic territory. use it.
Tammy Nemeth [00:29:42] Right, and so one of the things is that there’s a lot of oil and gas resources, there’s lot of other minerals and whatever that are in the Arctic, and Russia is building bases in which to exploit that and Canada’s not. And so it’s like, well, Russia will do its thing, it’ll become prosperous from those resources and Canada will do nothing. up there. We have very few icebreakers, they’re old. We wanted to participate with the United States to build new ones because apparently Canada can’t do anything on its own. It always has to partner with someone.
Stuart Turley [00:30:19] And Russia has six nuclear icebreakers. They have the way for transporting oil to, they have the Arctic 2 LNG train that came online. The only problem is that the sanctions did work against Russia on LNG. as because there was not as big of a dark fleet available to Russia at that time. But now that tankers are coming out of service and becoming available, you will see a larger dark fleet of LNG even over the next year or so. So I think that there is a big change there going on.
Irina Slav [00:31:14] It’s a bit like watching, sorry Tammy, just a quick note on your first story, it’s like age vampires, I don’t know if you’ve played age vampires but essentially we have two cultures, two civilizations fighting and then using their own resources, putting their resources to the best use so what we have with Canada is someone blaming the other competing civilization for the faults of the first civilization. I mean, Canada, from what you say, it tells me that they really dropped the ball on, you know, national security, resource security, and resource development, relying on the big neighbor to the south. And then Mark Carney comes out and says, This relationship is over. We’re going to have a new relationship. With what?
Tammy Nemeth [00:32:14] Well, okay, so the other element and how it’s linked to the second article in the first one is that the Russia-China seizing Canada’s carelessness in the Arctic article suggests that Mark Carney went to Paris and London right away soon as he was selected as leader because he wants to get in on the EU rearmament and to somehow have Canada participate in that. And it mentions that the UK has a 10-nation Arctic patrol group, which I haven’t heard of, but okay. And when they mean Arctic patrol, do they mean North Sea? And that maybe Canada wants to participate in this group. I’m like, okay, I haven’t really heard of that. So then it segues to this second article, which is, labour, which is the current government in the United Kingdom, launches a net zero crackdown on boats. So by a certain period of time, probably like 2035, you know, these, these deadlines are always shifting. Um, the boats have to be electric. So. So electric engines on boats, they have to get rid of the diesel engines, they have to rid of petrol or diesel generators. It all has to be electric motors with batteries and extra shore power hookups. So I’m like, okay, does that apply to all boats? which, which, what size of boat?
Stuart Turley [00:33:49] Wow
Tammy Nemeth [00:33:49] Are they actually, I’m thinking, how are they going to bring net zero into NATO, as they were talking about before? Does that mean only having electric ships? I mean, it’s one of these sort of, like the subhead here is maritime bosses warn nonsensical measures could sink the British fishing industry overnight, because it would apply not just to pleasure boats or whatever, but to fishing boats and commercial boats and whatnot, so.
Stuart Turley [00:34:18] Electric boats don’t work. If you think that the Canadian government has not spent money, take a look at the Biden administration spending what, seven to ten billion dollars and got seven chargers installed, you’re not going to be able to do it. The number one maritime ship change was the the output that they were the co2 outputs in the changing in the pollution regulatory issues. And what is the result of that for all these years? The number one thing is LNG fueled shipping containers. And that is reducing the emissions out of the maritime industry. How can you change from the regulatory issues in the maritime agencies right now and put it on electrification? you don’t have the distance. you don’t have you cannot do it this is just unbelievable physics matter at this point
Tammy Nemeth [00:35:28] I know, I was thinking, okay, so every port and harbor where ships are will have to have these charging stations.
Stuart Turley [00:35:36] and they’re going to be pounded by coal.
Tammy Nemeth [00:35:39] Well, not in the UK, because they shut all the coal down.
Stuart Turley [00:35:44] They have interconnects to Scotland which took down 14 million trees to run diesel to turn the generators on those wind farms. This is absolutely nuts.
Tammy Nemeth [00:35:55] And what’s the salt water, what does salt water do to charging stations? Ding! I’m sure it wouldn’t do anything bad to
Stuart Turley [00:36:05] It’s worse, salt water is worse than the criminals stealing all of the copper.
Tammy Nemeth [00:36:12] Right.
Irina Slav [00:36:13] They’re being so ingenious. I’m truly impressed with the Star Wars government. Really, do you think they cannot come up with anything more ridiculous?
Stuart Turley [00:36:24] There’s a worldwide move for energy security and where there’s not energy security there is high prices of energy and I’ve said for a long time when you have high electric prices regimes change or fall or fail.
Irina Slav [00:36:44] You will never find it out.
Tammy Nemeth [00:36:47] Yeah, I don’t know.
Stuart Turley [00:36:48] You had one more here.
Tammy Nemeth [00:36:50] Right, so I just want to give a shout out to Gina Papano. She wrote this great piece in the Financial Post, and the title is, is Mark Carney Canada first or net zero first? And of course her conclusion is that he’s net zero. Just because everything that he said, everything that he represents, his book values outlines precisely how he’s Net Zero first. Last week, he said he would not put forward the emissions cap on the oil and gas production in Canada. And he’s flip-flopped and now said, oh, yeah, we’re going to keep the emissions gap on oil and production. So it’s like one of these contradictions where, yes, conventional energy, we are going to be a superpower and then in the next breath, but we’re gonna have an emissions cap. And then the audacity to say that there’s no linkage between the emissions, the emissions cap is not a production cap. Because, oh, well, they’ll just have to invest in carbon capture. So it’ll be interesting to see what happens after the election if he’s elected.
Stuart Turley [00:38:01] I think it’s going to be really bad, especially when he gets on a phone call with President Trump and says, President Trump says he had a great call and within 15 nanoseconds after that call, Carney says, we are abandoning the U.S. and we will have nothing to do with their military. I personally think that he is a world economic forum problem waiting to happen.
Tammy Nemeth [00:38:28] Well, I mean, he was he was one of the top people on the World Economic Forum board, and it wasn’t until he decided he was going to enter Canadian politics that he resigned that position. So, yeah. But, you know, honestly, to be fair, Stu, he said this stuff about separating from UK or sorry, US defense before his phone call with Trump. And Trump always says he’s had good conversations with people. So I don’t know if that really means much.
Stuart Turley [00:39:02] I don’t know, but I’m not a trusting, if he’s been giving advice to Trudeau over these past years, I don’ know, I don”t trust him. Just a personal opinion.
Tammy Nemeth [00:39:18] Yeah, you can find me on Substack at TheNemethReport.substack.com. My latest one was called Sea Bamalam and that was on the carbon border adjustment mechanism of the European Union, what it actually means versus what people think it means. And I’ve also written about Mark Carney’s climate plan and some other things on there. So please check it out.
Stuart Turley [00:39:47] And David is not here, but he had, in fact, it’s kind of funny we mentioned Scotland. This was a year ago for his article. That was absolutely a great thing. And I just, I really love all of David’s work. So shout out to David and he’s got things going on. So you can find him on the Energy Transition or Blackmon.substack.com.
Tammy Nemeth [00:40:14] I love his energy absurdities, they’re so great.
Irina Slav [00:40:21] Refreshing. Okay, five energy transition lessons for 2025. It’s a classic spin of what’s been happening in energy transition space from Bloomberg and EF, of course. Basically, the messaging goes like this. Yes, there is a certain perception of a slowdown in the transition, but that’s not really true because in the EU when EV sales declined, It followed a very big surge in EV sales before Germany ran out of money for subsidies. And what does that tell me? Nothing at all. But essentially, they keep repeating the same message that the transition is unstoppable. And even if it looks like it is stopping, it’s not. Don’t believe your lying eyes Basically, yes. If anyone bases any kind of important decisions on Bloomberg NEF, don’t. The other one is just pure fun. That US LNG exporters could hit methane snag in Europe. I can’t remember the names of the authors, but basically they’re trying to argue that the I’m happy I’m here now because… make trouble for US LNG exporters with its methane rule that they approved last year, and that demands that all the LNG that enters the European Union complies with certain high standards of low methane emissions. Because you see, it’s US LNG exporters that need the EU market more than the EU market needs any kind of LNG, which is why the second biggest LNG supplier to the European Union last year was Russia, who doesn’t care about methane emissions. But, you know, they’re totally going to implement this rule and they’re going to hold LNG suppliers to their high standards. Incidentally, the US LNG produces… were forced to cut their methane emissions by the previous administration and reportedly they’re going to keep cutting their methane missions because it makes sense to me. I mean they’ve already invested the money in tracking on it but ultimately it’s impossible to keep track of animations and to actually reliably verify. that these emissions have been reduced because as someone cited in the Reuters report, some industry insiders said, you can’t talk every molecule. Is that what it comes down to? And if you can talk every molecules because it’s impossible, physically impossible, then this methane rule is nothing. But yeah, let’s have some more scaremongering and. a full story about the economic and regulatory might of the European Union, well it slowly dies and that’s that’s all.
Tammy Nemeth [00:43:37] So what what did the did the article talk about Qatar and what they think of this rule?
Irina Slav [00:43:45] They’re mostly talking about the US, because it’s convenient, because the US exporters have had to deal with these methane regulations at home as well. I don’t think Qatar cares, I don’ think anyone cares, even if the EU tries to make it seem like they’re going to force everyone to feel their, you know, conditions. We had a taste of this. Remember the deforestation rule about coffee and cocoa and all these commodities coming into the EU? They were going to force everyone to verify and track and monitor and fill thousands of pages of documents to make sure there was no deforestation involved in the production of the cocoa or the sugar or the coffee. Yes, so they’re backtracking on that because they know this will make the commodities a lot more expensive and a lot of producers that we should care about poorer. So they’re going to pretend it doesn’t apply to Qatar, for example, or African LNG producers because they need the gas.
Tammy Nemeth [00:45:07] that yeah because because I recall last year in December Qatar said that they will stop gas shipments if the EU enforces the legislation so exactly okay
Irina Slav [00:45:26] right, EU? It’s really sad. It’s really sad Yeah.
Stuart Turley [00:45:34] and your Substack
Irina Slav [00:45:36] My Substack is Irina Slav On Energy and I write too much. So you’ve won.
Stuart Turley [00:45:44] An outstanding Substack. I highly recommend it. It is very entertaining.
Tammy Nemeth [00:45:50] It is. I love it.
Stuart Turley [00:45:52] I love this article from your friend, peak Permian geology and water says we’re close. I’ve got about five interviews coming up on this. I’m visiting with folks about this, about peak Permia oil and everything else. But for today’s story, how cheap is Russian natural gas via pipeline compared to LNG? Do you guys have an idea about the price difference between LNG? Because everybody that I talked to just throws LNG versus a pipeline out there.
Irina Slav [00:46:31] Pipeline is always cheaper
Stuart Turley [00:46:33] Exactly. Russian pipeline gas. In fact, years ago, I talked to one of the head persons at Novotek Gas and it was very cheap for them to manufacture and Russian pipeline 2025 is between six and eight dollars MMBTU or 20 to 27 dollar euros depending on the buyer and round. LNG imports, which is a very important topic for President Trump trying to say, hey, buy my LNG and avoid tariffs, right? That’s what he’s trying to run around out there doing. I can’t do the President Putin and I can do President Trump imitation. So it’s between $10 and $15 MMBTU or $33 and $50 euros, depending on route and who and where it comes in. So you’re talking more than double the cost of natural gas versus LNG. And if you want to talk about the cost without the pipelines amateurized in, it’s around 17 cents. So that they cost them to manufacture or drill out. And when you take a Look at the cheap Russian natural gas, it’s falling out of the many of the formations that they have so even though you can say hey yeah we’ll take all the LNG only until you take a look at it as buying LNG wipes out your other trade tariffs does it become affordable if you don’t do that regimes change when electricity prices go high and that’s what’s going to happen.
Irina Slav [00:48:29] Stop reminding them that. Let them fall. Don’t call them a lifeline.
Stuart Turley [00:48:37] Personally, I think NATO will not be in the current position that it is in with the United States pulling out because I don’t want to see World War III and we’ll move on to the next one. Most polls, I found this one very interesting in the United States, most voters in the United States take energy independence over climate now. And I really think that the rest of the world will get to this point. But I think, Irina, you are spot on with this. At what point does everybody fail?
Tammy Nemeth [00:49:15] It depends who you’re polling also. I mean, it depends how you word the question. So if you, what’s your priority here, making sure that you can keep the lights on and the heat on, or fighting climate at some point by 2100. You know, there’s that famous episode of Yes Minister where they talking about how you can manipulate a polling response based on how you word the questions and everything. And that’s. That’s really, really significant, which is also kind of the reason why I don’t pay much attention to polls, because it’s like how are people being manipulated based on the question that’s being asked.
Stuart Turley [00:49:55] I think we also brought it up with the USAID actually going away and becoming merged up into the US State Department. Stacey Abrams got, I believe, several billion dollars to climate aid that was fictitious and false. And so were those people, Brian, when you see the drying up of funds, we’re going to see opinions change.
Tammy Nemeth [00:50:23] Possibly. Yeah, I like Jeff’s I like just comment here Where he put he said the discussion about peak anything is interesting and all past declarations have proven to be incorrect
Irina Slav [00:50:42] Are we at peak stupid? No, no, we’re not.
Irina Slav [00:50:45] Even that we’re
Stuart Turley [00:50:48] No, we’re not a big stupid yet. I have yet to grow up. My granddad was one of the chief geologists. In fact, he was attributed for discovery of the North Slope in Alaska. And I loved all of my trips to Alaska. I actually sold a lot of equipment to the Aliesca Pipeline Corporation up there and love Alaska. Alaska. has just talked about and they’re thrilled with the increased investments from South Korea and a few others of billions of dollars of creating the Alaskan LNG export facility and that is absolutely wonderful. It helps the economy and US EMP operators do it absolutely better than anybody else on the planet with lower emissions and taking care of it. In fact, the caribou never minded the Aliaska pipeline. they just kind of like go along their scooby-doo and along in their own business. They don’t care about how elastic it does. They’ve got caribou migration paths for it and it does great. In fact, it’s operating at I believe 10% capacity. We could really use the oil. So if Peak Permian is coming around, I’ve got all these interviews and podcasts and everything that I’m going to doing on Peak Permit. Uh, and is it, do we care? I’m of the opinion there is a lot of oil out there that we have yet to unearth.
Irina Slav [00:52:24] And we will when the price is right, as we have done repeatedly in the past.
Stuart Turley [00:52:30] Exactly. So with that, you can always find me at energynewsbeat.co and energy newsbeat, the energy news beat dot substack.com. And I want to give a shout out to all the hackers out there. Right now we’re averaging about 100,000 people a day to the site and we’re getting about 7000 denial of service attacks on our site a day and I’m really tired of these knuckleheads and they don’t realize that unless they’re spoofing I can tell where you live. So it’s really kind of irritating but a shout out to all the hackers in the world that try to take me down.
Irina Slav [00:53:15] Stop trying, guys.
Stuart Turley [00:53:17] Yeah, I get irritated. I’ll ask Ali ask a pipeline Hill Corp assets and territory now. Not sure I’ll have to take a look at that.
Tammy Nemeth [00:53:27] Good question, we’ll have to look into that.
Stuart Turley [00:53:30] But you know, I think that today’s discussion kind of brings it up weight lift. I think the green policy politicians think that they’re muscled up like bodybuilders and I think they can, they think that can control the world. And I’ve got a video that can really demonstrate. Take a look at this bodybuilder.
Stuart Turley [00:53:55] And who’s over there? Who is that thing? Oh man, you’re on the
Stuart Turley [00:54:44] Anatoly is a famous weightlifter and he goes around to gyms and impersonates and he’s normally got like a 32 kilo broom mop and he hands it to them and they drop it. He is phenomenal and I think it does bring up a fantastic point and that is the green policies don’t work. Now, do we need to go after pollution? Yes. If it is particulate matters in the coal generation, the US has clean technology and coal is not as dirty as it used to be with that clean technology. Why doesn’t the US really get after and export that technology? That would be better for Africa. Right now, there’s a war going on in Africa. for corruption. We need to help end it.
Tammy Nemeth [00:55:40] Well, you know, China says that all their new coal plants utilize that technology. They don’t. And Alberta was one of the first places, jurisdictions to, um, to develop it and try to export it.
Irina Slav [00:55:54] They had a problem with actual pollution, so it makes sense they would develop cleaning, scrubbing technology.
Tammy Nemeth [00:56:03] Well, for sure. And it makes sense, right? Do you really want your people to have to wear masks all the time because of the particulate matter? So, you know, and if we have the technology to do it, then then deploy it.
Stuart Turley [00:56:16] You bet.
Tammy Nemeth [00:56:18] It’s an energy reality.
Stuart Turley [00:56:20] It is,
Irina Slav [00:56:23] What are your last words?
Stuart Turley [00:56:27] I think President Trump’s missing the boat and I applaud him for President Zelensky evidently allegedly was giving away the mineral rights to the EU and the UK before and so the mineral rights to Ukraine are probably worthless. But I did not have on my bingo card that President Trump would possibly take a Russian nuclear power plant. and manage it as a service. So exporting energy as a services, not necessarily a bad thing. I think it could be a good thing. Imagine if we would export nuclear reactors to Africa and do what Russia is doing. Russia has done a great job in building energy as an export service. Oh, their GDP is growing. Germany has had two years of decline, the EU is declining, so maybe there is something to exporting energy as a service. Just a thought.
Tammy Nemeth [00:57:32] Depends on who’s going to be the employees and maintaining those facilities.
Stuart Turley [00:57:40] I think local jobs in a factory, if you take a look at micro reactors and you take a look, at the CEO of the founder of nano nuclear, I’ve got a podcast, I’ve just going out with the CEO there as well as the CEO of Copenhagen Electronics Nuclear. They are putting out modular nuclear reactors and they are going to be able to ship those things in. So they’re sealed units. And so that you make these things in a controlled environment and then the rest of the local talent can have jobs. And when my interviews with NJ Anouk, who is the director of the African Energy Chamber, a fantastic man, he says, end the subsidies. Subsidies don’t work because they’re handouts. Let’s work with jobs, create a grid, get electricity to the house. and create local jobs so they can make products and buy those products and trade. That’s how you build long-term partners.
Irina Slav [00:58:50] Good point.
Tammy Nemeth [00:58:50] That’s a great point. Great point.
Stuart Turley [00:58:53] I like long-term partners.
Irina Slav [00:58:57] Yeah, the EU can learn from you. Well, shall we have a great week, everyone? I think so. Thanks for the comments.
Stuart Turley [00:59:08] All right, see you guys.
Tammy Nemeth [00:59:09] See you next week, Bye.
Irina Slav [00:59:12] Bye
Sponsorships are available or get your own corporate brand produced by Sandstone Media.
In 2024, U.S. natural gas consumption averaged a record 90.3 billion cubic feet per day (Bcf/d) and set new winter and summer monthly records in January and July, according to data in our Natural Gas Monthly. Overall, U.S. consumption last year increased 1% (0.9 Bcf/d) from 2023. In January, natural gas consumption was up 12% (12.5 Bcf/d) compared with January 2023 consumption, and in July, consumption increased by 3% (2.5 Bcf/d) compared with July 2023.
Weather has a significant effect on natural gas consumption patterns. Natural gas consumption peaks in the United States in both the winter and summer. In winter, the most natural gas is consumed in January or February, when demand for space heating in the residential and commercial sectors peaks. In the summer, electricity generation increases in July and August to meet air-conditioning demand, driving more natural gas consumption.
Despite the record in January, from February through April 2024, mild weather led to less consumption of natural gas compared with the same months in 2023. In each month from May through September 2024, natural gas consumption surpassed the previous year’s monthly records. Historic low natural gas prices in 2024 meant that natural gas was more competitive in the electric power sector, especially compared with coal, contributing to increased use of natural gas for electricity generation.
Annual consumption in the combined residential and commercial sectors declined by an average of 2% (0.4 Bcf/d) last year compared with 2023, despite a cold January that resulted in record-high natural gas consumption in these sectors. Natural gas consumed in the industrial sector held steady from the year before, while consumption in the electric power sector, which accounted for 41% of U.S. natural gas consumption in 2024, increased by 4% (1.6 Bcf/d).
Data source: U.S. Energy Information Administration, Natural Gas Monthly Note: Other=natural gas volumes consumed as transportation fuel, as lease and plant fuel, and in pipeline and distribution use
The summer of 2024 (June–August) ranked as the fourth-warmest on record in the U.S. Lower 48 states, leading to strong demand for air conditioning and resulting in new daily records for electricity generation in July and August. As a result, natural gas consumption in the electric power sector rose in July and August to be the highest ever recorded for the summer.