Energy News Beat
Daily Standup Top Stories
Trump Seizes Wartime Powers in Battle for More Fossil Fuels
Obscure laws to be marshaled to build pipelines, power plants ‘God Squad’ to weigh projects that threaten endangered species President Donald Trump’s declaration of an energy emergency opens the door to wield sweeping Cold War-era powers and […]
Europe doesn’t need US gas, but might buy it anyway
Donald Trump wants EU countries to buy more US-shipped gas. There are reasons for Europeans to consider taking the bait, but each comes at a price. At first glance, US supply and European demand for […]
Halliburton Posts Quarter-on-Quarter Income Rise
Energy industry services provider Halliburton Co. has reported a net income of $615 million for the fourth quarter of 2024, compared to $571 million for the third quarter of the year. However, it is below […]
Highlights of the Podcast
00:00 – Intro
01:30 – Trump Seizes Wartime Powers in Battle for More Fossil Fuels
04:43 – Europe doesn’t need US gas, but might buy it anyway
10:30 – Markets Update
14:26 – Halliburton Posts Quarter-on-Quarter Income Rise
16:40 – Outro
Follow Stuart On LinkedIn and Twitter
Follow Michael On LinkedIn and Twitter
– Get in Contact With The Show –
Video Transcription edited for grammar. We disavow any errors unless they make us look better or smarter.
Michael Tanner: [00:00:10] What’s going on, everybody? Welcome into the Tuesday, January 28th, 2025. Addition of the daily energy news beat Stand up. Here are today’s top headlines. First up, Trump seizes wartime powers in battle for more fossil fuels. If you are a fan of The Office, this is equivalent to the meeting of the five families, so we got to love it. Next up, Europe. Does it need U.S. gas? But it might buy it anyway. A very interesting deep dive into the LNG market there in Europe. I will then jump over and quickly cover what happened in the oil and gas markets today. And holy smokes. If you ever thought China wasn’t in the news until today. Deep sea absolutely crushing. Stocks theoretically could be impacting prices on the oil side. But I think there’s some other factors in there. And then we have our first earnings beginning to drop for Q4 2024. First up, oilfield service. We’ll talk Halliburton, which post quarter on quarter income rise. But there is some detail together moving forward from there. But Stu is out on assignment. He’s actually in route to the great state of Texas. We’re doing a little in-person team. We’ve got our other team member sitting in the other room right there, so we are fired up. But I am rocking a solo show today, guys. Let’s go ahead and dive on in. All right. [00:01:30][80.0]
Michael Tanner: [00:01:30] First up, Trump seizes wartime powers in battle for more fossil fuels. This is pretty interesting, as we all know. You know, in the first week of the president, Donald Trump’s second term, he declared an energy emergency, which really what that does is that opens up the door to basically little known authorities and, you know, really Cold War era powers that were set way back when. Which allows both fast tracking of pipelines, power grids and to save struggling coal plants. I point out that in that first paragraph that I just read from a little bit, okay, never did it mention increasing oil and gas rush, which has been my drumbeat the whole time. Drill, baby, drill is not necessarily increased production, but increased transportation. Okay. That’s okay. Basically what he’s done is that he’s told all of these agencies, the EPA, the Department of Interior, know that to basically scour all different statutes and regulations in an attempt to find obscure rules which do allow him to facilitate the production of more oil, natural gas and electricity also, as well as approve construction of pipelines and power lines that are needed to move that to its end consumers. So, you know, yes, there is a little bit of, hey, we’ve got to increase oil production. But I think he’s realizing and it’s only been a week now, so we’ll see where we are a month. But I think what he’s realizing is it’s going to be a little bit harder than I think to actually increase production. But what I can do is get new pipelines, new electrical lines, and I can get these LNG export facilities approved, which you talk about a little bit in the next. Here’s a quote from Kevin book. He’s the managing director of a Washington lobbyist from Clearview Energy Partners. This is power politics in an era of power, not rules. Super interesting quote there again, a lot of this does come down to politics, you know, and really the reason why, you know, and this is the other thing he’s ordered the keep going back to if you’re in office, the meeting of the five families. Trump has ordered quarterly meetings of a committee of cabinet level officials that’s authorized to greenlight ventures even when the survival of species is at stake. And when they mean species, they mean like the occasional rodent that ran that’s running through your backyard. Right now, this panel, which is known as the God squad, has actually only met a handful of times over the past four decades. Again, a meeting of the five families. I absolutely love it. You know, we’ve all we’ve all known that industry leaders have complained for years now that these conservationists have weaponized the Endangered Species Act. I think that’s also part of the thing here. You know, Ellen talked about it with having to put headphones on seals, just the test. I mean, again, I think that seal was more kilometers than he would be with the take off. It’s pretty unbelievable. You know, most of these emergency powers that are in federal law are designed to rapidly halt action, which is interesting. So the question is, are we going to be able to use it to kick start? You know, again, the president is allowed strong emergency powers. So it’s going to be very interesting to see The final quote here from the article. Dina Wiggins, president of the Natural Gas Supply Association, mean there’s these lobbies from all over the place. We desperately need more pipeline infrastructure to the northeast. There’s quite a bit of gas. We can’t get it through the state of New York. So, again, I think what he’s realizing, something that I’ve been screaming out from the top of my lungs, this is a transportation issue, not necessarily a production problem. But speaking of transportation,. [00:04:42][192.2]
Michael Tanner: [00:04:43] Let’s jump to the next article. Europe doesn’t need U.S. gas, but it might anyway. Interesting. So what Donald Trump here is talking about is pushing EU countries to buy more U.S. ship gas. There are reasons that Europe is this article says is considering taking the bait, but each of them come at the price high lock. You know, top line is, you know basically it’s a price that could be you know, it’s a way for smoother relations with the United States. I kind of read the. Topline. The big bullets and we’ll dive in each one. So one there saying that this is a price Europe’s willing to pay for smoother relations. Interesting. They’re also saying that new dependencies and the lessening climate concern has led them to this and also their de reliance on de reliance on specifically piped gas from Russia. So, you know, you know, at a top line, I think what they’re saying is, hey, yes, Europe would love to take us. Natural gas. And there are reasons for that. But at the end here, what it basically says is, well, there may be more at play than just that because they may not actually need the LNG and that U.S.. And specifically EU demand for LNG may have already peaked. So, guys, give you an idea. You know, to this day, the U.S. currently exports about 50% of its LNG that flows through its export facilities to Europe, and imports of U.S. LNG has filled all of the factories and allowed them to kind of stay up and running since the 2022 invasion. But the EU gas consumption since 2022 has tumbled 13.3% and 7.4%. You know, leading an analyst to wonder, is this are we seeing peak gas demand in Europe? I actually take the other side of the argument and say, well, it’s because prices have risen so much to where people are cutting back. I mean, you know, it’s so cheap. Energy is so cheap here. Specifically in Texas. I leave my lights on when I leave. I you know, I keep my aircon or my heat on, depending on what time of year it is. But that’s because I’m paying, you know, $0.06, $0.08 a kilowatt hour. There’s been a dollar per kilowatt hour. Yeah. I’d probably have things shut down. I wouldn’t have nine screens in front of me TV going in the back seat on a, you know, flipping the AC and heat back and forth. You know, I would again, the free market, the supply and demand curve, when prices rise so high, we see demand fall, which then shifts price or which then shifts supply down, a.k.a. falling gas consumption. So I don’t necessarily know if this is a trend. I think we need more than two years of data, especially since in 2022 it’s been a little crazy with the war. But we did see in 2020 for the U.S. that LNG imports to the EU did decline to the previous year, which basically there was a network of LNG terminals along Europeans western coastline that went fairly underutilized. We also did see a warm winter in a weakened economy, again, a weakened economy. I come back to the warm weather, some of that’s out of control. So maybe we just two warmer winters that we need. It was actually a little cold back 24, but in 23 and 22 is really cold. So again, interesting counterpoints here, you know, again, you know, and then, you know, the other side of this article points out is the supply side. We talked about the demand side, but the supply side of that, you know, if the IEA is correct, they’re predicting a global glut of gas, which is 50% more LNG. That should be than will be needed around the world by 2030, which is mainly driven by the expansion both in the United States, but also Qatar. So very interesting there. It goes on to talked about I mentioned the counterpoint to the rising demand or the lowering of demand and rising of supply, which is, you know, both highly signals that they may just go back to U.S. LNG specifically for smoother relations with not just the Trump administration, but with the United States, and also the lessening effect of climate and climate concerns. And we’ve known about these LNG deliveries for long. Batteries sign in 30, 50, 100 year deals to supply gas. So I think this is very interesting. It’s a great breakdown in my opinion of yes, the EU probably does want US gas, but will they need it and for how long? And you know, obviously things change and you need to be planning 30 years in the future. So, you know, some of this stuff taking a lot of the short term data and trying to extrapolate it I think can be interesting. But we will see that. [00:08:44][241.3]
Michael Tanner: [00:08:45] Let’s go ahead and jump over to finance. Lots to talk about there. Before we do that, guys, we got to go ahead and pay the bills. As always, thank you for checking us out here on the world’s greatest website. www.energy news beat.com Stu in the team do a tremendous job making sure that site stays up to speed. Everything you need to know to be the tip of the spear when it comes to the energy and the oil and gas business. Go ahead and hit that description below for all the links to the timestamps, links to the articles. Also, check us out on substack the energy news Beat that substack.com. It’s the best place. If you want to support the show, give us a follow there. Sign up for a paid subscription for access to all of our exclusive content that we only put there is not available in energy news. Be only available via substack. Go ahead and sign up for scoops that we appreciate all of our current subscribers and paid subscribers there. You guys are really the ones that are keeping this ship afloat. As always, guys, if you are interested in becoming Billy Bob Thornton from Landman and you are and I say that tongue in cheek, really what you should be doing is slightly becoming Billy Bob Thornton from Lamont. But you should be planning your 2025 cash flow and tax board and you can do that via oil and gas. We have some great resources if you want to learn more about how to do that, go to invest in Oil Dot Energy Newsweek.com and you can sign up for all of our info. One of our one of our partners is sit in the other room. He’s got a great, great e-book that he has coauthored with a few other people. Are me being one of them. That gives you a quick overview of about what’s going on and then some of the nuances of investing in the business. And this is mainly designed for non oil into. Experts. So if you’ve never invested in oil and gas, it’s great if you have invested in oil and gas. We have some other resources. Specifically our Deal Spotlight podcast, which kind of talks about how we think about due diligence and how you might need to think about due diligence as you’re looking at other projects. Again, that’s invest in oil that energy has become. Save money on taxes, increase some cash flow, and ultimately become Billy Bob Thornton from Land Man. [00:10:30][105.4]
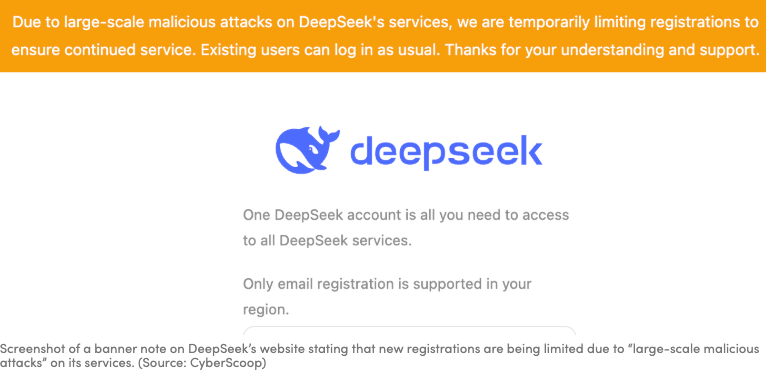
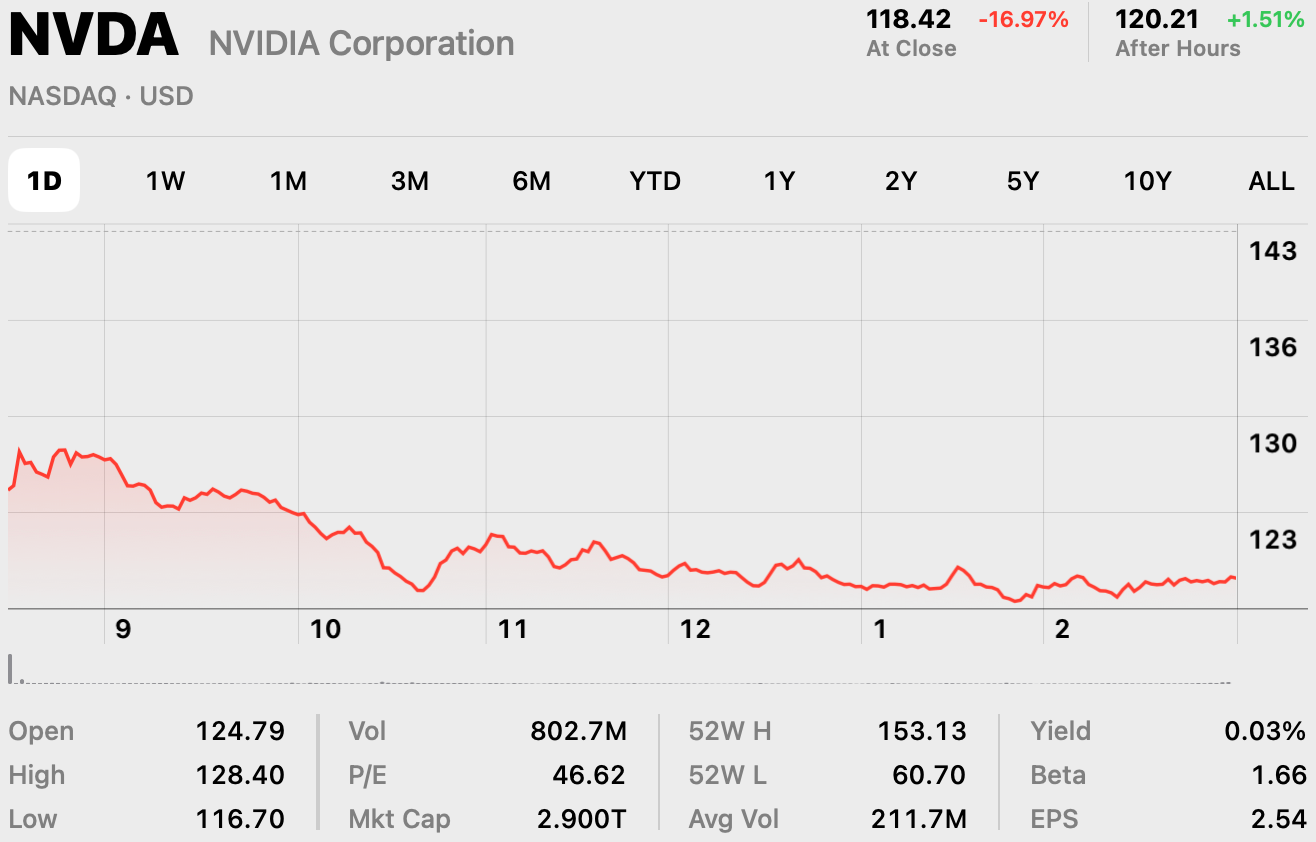
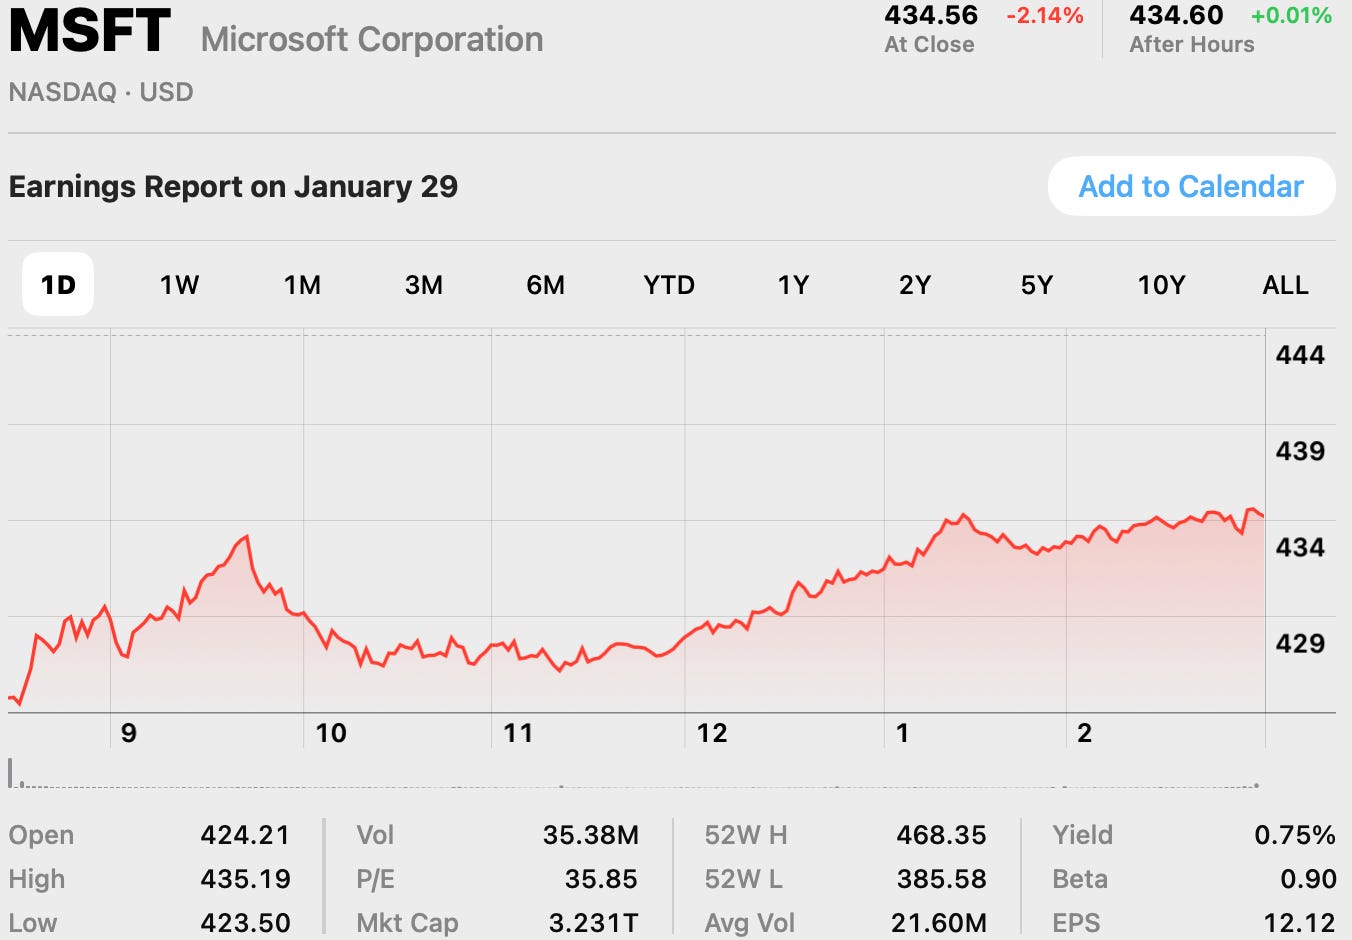
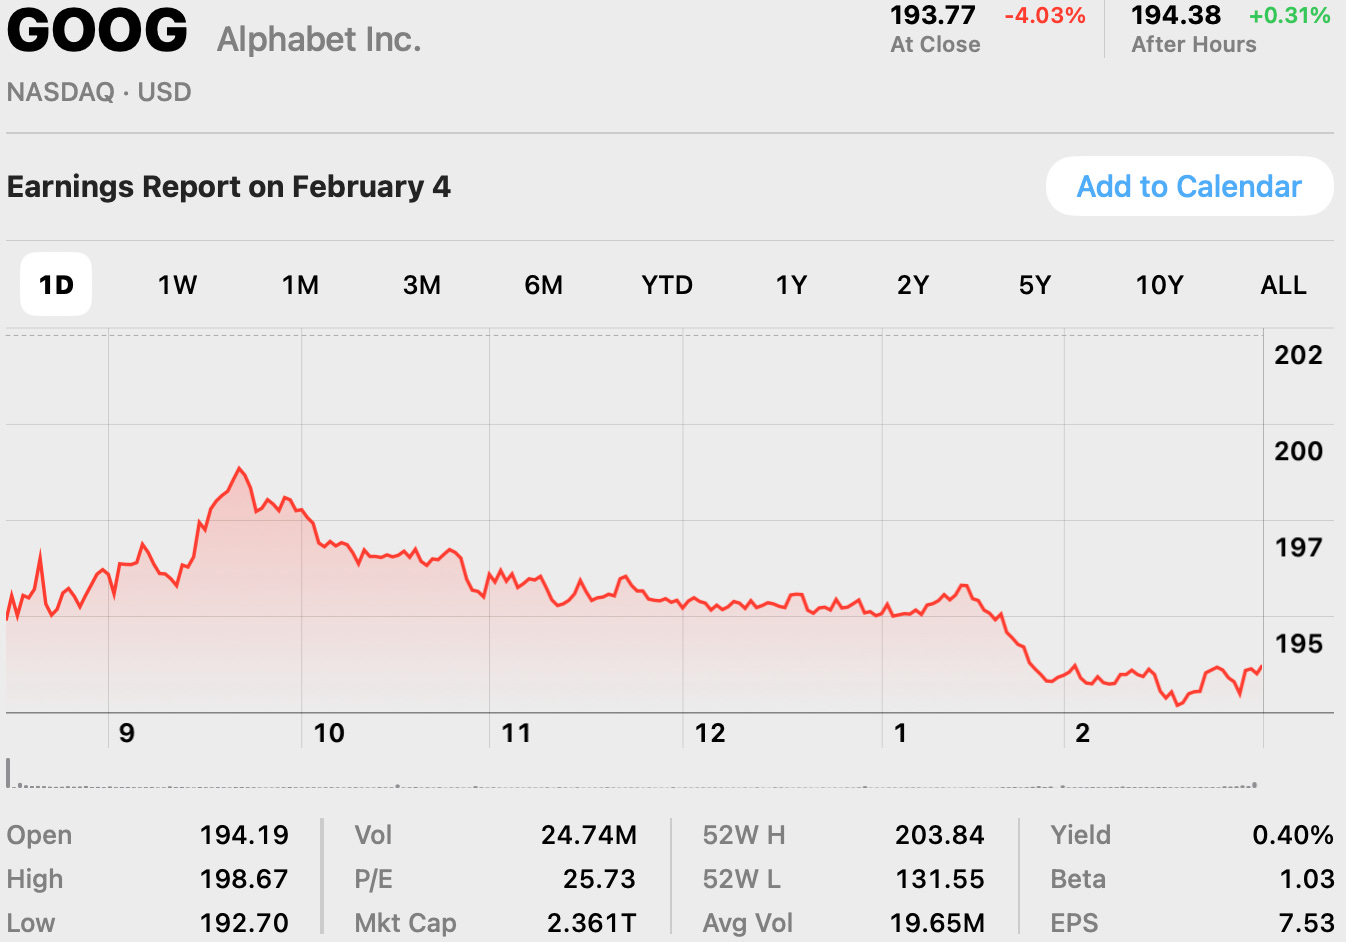
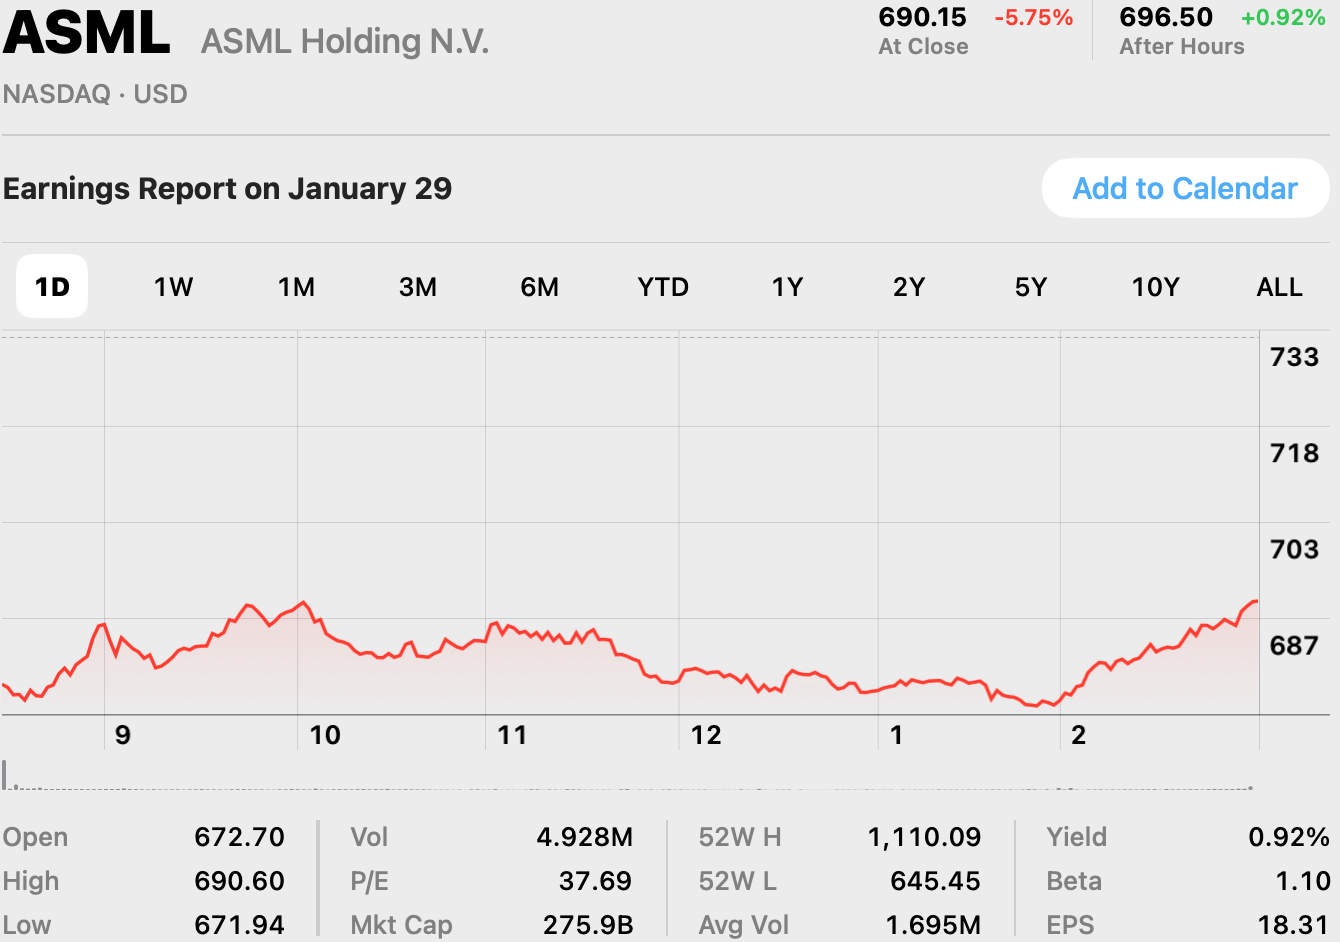
Michael Tanner: [00:10:30] I mean, let’s look at the marketing of fossil. Absolutely. Read across the board. I’m looking at the tickers in it’s you know, my eyes are starting to bleed by how much red I see S&P 500 down 1.8 percentage points. Nasdaq down a whopping 3.28 percentage points. Don’t look at your 41K folks. You see two year treasuries now 1.4 percentage points. US ten year Treasuries down 1.8 percentage points. Dollar index, oddly, is actually fairly flat. Bitcoin down 3.8 percentage points. It’s below 100,000. Not sure if that how correlated that is to what we’ll talk about specifically in the next upcoming year. But crude oil down 2.3 percentage points, just above $73. That 7306 Brant oil only down about 8/10 of a percentage point 7698. Natural gas down 9.4 percentage points, a whopping $0.37 out of $3.64. Our actual P, which our EMP security contract 2.2% down on the day I’m down to 31 3756. Unbelievable. You know top line you know articles will tell you and what’s really going on in the broader stock market is this this this news out of China that deep sea which is a chat open API. You know competitor basically has dropped a new model that basically allows is like 100 times cheaper than open I they only spent a couple million dollars building it when you know billions have been spent on U.S. infrastructure. We’ve been talking about the Stargate program all last week and they basically drop one for a dollar and said, yo, look what we do. And it’s beating all benchmarks. They it was so well searched, they blocked new users from saying I couldn’t sign up this morning. I tried. I was like, I need to see what this news is on deep sea. See how good it is. Tried to sign up couldn’t because they’re just having issues with it has absolutely tank the economy and part of what that shows me is that the economy has been run up by the fact that eight is going to change the world. And we’ve all been under this assumption that it’s a huge, huge CapEx problem. I mean, look, they’re talking about it on CNBC right now. Big tech cap backs worries. I mean, you couldn’t have timed that any better. I promise you, I didn’t time that. But seriously, guys, the CapEx problem that’s going on right now in the United States or I don’t want to say problem, I wouldn’t classify as a problem, but the assumption that you just need to spend hundreds of billions of dollars in order to train these models have kind of been blown out of the water with deep. So that’s what’s going on in the broader economy in terms of oil and gas. You know, the real big issue is, is is what was going on at the World Economic Forum last week where Trump has basically outwardly said, OPEC, I need you to reduce oil and gas or I need you to increase oil and gas production. You know, as as you know, on top of that, we’re also seeing some weaker economic data from China and tariffs. You know, we went back and forth on Friday, as you mentioned, with Columbia talking, refusing a plane and not refusing a plane and more tariffs and some tariffs than no tariffs. We haven’t seen OPEC plus yet respond to Trump. And the assumption is they’re going to keep it the same. You know, but you know, the quote from Bob? Yeah, he’s energy director of energy futures at Mizuho. President Trump continue to put pressure on OPEC, calling on the producer group to lower price help end the Russian war in Ukraine. Not sure if that’s why if that would help end the war, but it definitely might. You know, to give you guys an idea, Colombia, speaking of the the Colombian tariff, Colombia did set about 41% of its seaborne crude to the U.S. So that’s kind of interesting there. Here’s another quote from I’m going to butcher this name bazaar. I shall drop Chief as chief Commodities in CB. There’s broad based negative sentiment on the market. Even if sanctions in place take place, this is still nervousness that Trump will bully whoever he needs to get his way. Another Citibank reports. As this week, readings highlight the need for more policy efforts to stabilize economic growth. That’s talking specifically about manufacturing data coming in weaker in China. So all in all markets just having a thrashing today, mostly again, on this deep seek news, but also I think some of the fundamentals, or at least the potential of fundamentals changing from a supply demand point for what Trump is doing is starting to head ahead here and we’re seeing prices fall as we speak. [00:14:25][234.8]
Michael Tanner: [00:14:26] We got to jump in and start earnings. Q4 earnings are here. We always start with oilfield service and today we get Halliburton. They post order on quarter income rise on a net income of $615 million for the fourth quarter. That was actually compared to 571. For the third quarter of the year, though, it was actually below at $667 million quarter reported from a year ago. So they’re actually down year over year, but up quarter over quarter. Usually I like comparing a year to year quarters versus, you know, Q3 to Q4 because cyclical in terms of, you know, companies maybe, you know, in the oil and gas space tend to spend more in Q4 than they do in Q3, especially because they find out if there’s a surplus or low on budget. Or they’re trying to hit production targets. There’s a lot of that said there. So generally, you’ll see Q3 softer than Q4. The fact that Q4 2024 was down from Q4 2023 shows me that things have softened a little bit. Total revenue for the year was 22.9, which is actually for 22.8 billion with a B, that was actually flat year over year. Operating income was 2.8 billion. Compare that to 2023 on a full year at 4.1 billion. Net income attributable to Halliburton for the full year landed at 2.5 billion, which was below the 2.64 billion that was reported in 2023. CEO President Chairman Jeff Miller I’m pleased with our performance in 2024. We generated 2.6 billion of free cash flow on a return of 1.6 billion of cash to our shareholders. While we expect 2025 to be sequentially softer in North America. We began the second half of this decade in great position with transformed balance sheet leading returns and strong cash flow. So again, I take out of this oilfield service does a better job of predicting demand than oil and gas operators because their revenue in the oil field services absolutely depends on it. Yeah. Oil and gas company. You know, they’re what they do this year really affects next year. They aren’t as accurate as somebody who is in the oilfield service space. So, you know, it’s pretty interesting. Halliburton coming in there, they did drop a little bit in terms of price, in terms of their stock. They’re down about a quarter of a percentage point is the time recording here. So obviously, they’re taking it in the shorts here. But it’ll be interesting to see how they jump in. And obviously, with that softer 20, 25, we will see. [00:16:39][133.2]
Michael Tanner: [00:16:40] But with that, guys, I’m going to go ahead and let you get out of here. Get back to work. Start your day. As always, thank you for making us part of your Tuesday. For Stuart Turley, I’m Michael Tanner. We will see you tomorrow. [00:16:40][0.0][986.9]
The post Europe’s US Gas Deal appeared first on Energy News Beat.