Marine seismic specialist SeaBird Exploration and Singapore’s tender drilling rig specialist Energy Drilling are set to merge in a share-for-share deal creating a diversified offshore oil and gas services player.
Under a letter of intent, the transaction will be carried out by issuing about 651m new SeaBird shares to Energy Drilling shareholders. The company will change its name and be listed on the stock exchange, while the seismic and drilling businesses will continue to operate as Seabird Exploration and Energy Drilling.
Oslo-listed SeaBird said that based on its latest closing share price of NOK5.89 ($0.52), currency ratio, net debt and backlog, the combined company would have a pro forma market cap of $381m, net debt of about $44m and an estimated asset EBITDA backlog of more than $320m.
SeaBird has two seismic vessels in its fleet, while the Pioneer Logistics-backed Energy Drilling counts six tender rig assets in Southeast Asia, or about 38% of the world’s actively marketed units, and approximately 80% of available days contracted for 2025 and 2026.
The agreed exchange ratio will result in Energy Drilling shareholders owning 89% of the combined company. The equity value of Energy Drilling in the transaction, which has been backed by board of directors of both companies, is estimated at nearly $400m. SeaBird’s five largest shareholders, including Magnus Halvorsen’s MH Capital, have also supported the transaction. The board and these five shareholders hold about 39% of outstanding shares in SeaBird.
The deal should close in the second quarter of this year, pending satisfaction of certain closing conditions.
“This merger represents a transformative opportunity for our shareholders and other stakeholders. By joining forces with SeaBird, we are creating a publicly listed company uniquely positioned to deliver industry-leading shareholder returns through distributions and accretive growth, while retaining our robust financial position and flexibility,” said Alf Thorkildsen, chairman of Energy Drilling.
Aframaxes sales are filling up broking reports at an increasing rate as sanctions rain in.
So far this year, about 10 ships have been reported sold in the aframax segment, tankers that reportedly are being sold charter-free, based on prompt delivery.
One of the latest sales involves Greek account IMS, which is reportedly more than doubling its money selling their 2008-built, 106,00 dwt Nemo, noted sold for $37m to Chinese buyers, $7m more than pricing portal VesselsValue sets the market value for this ship. The ship was added for $16m four years ago from Teekay Tankers.
Speculation surrounds the sale status of several deals booked in reports. Ships connected to Singapore’s Synergy Marine and advertised for sale with early charter-free delivery are two Korean-built tankers, the 116,100 dwt tankers, Amax Anthem (built 2011) and Amax Avenue (built 2010). These ships have reportedly been sold for $39.5m each.
Another famous player working out of Singapore is Idan Ofer. His Eastern Pacific Shipping is reported attempting to offload the 15-year-old scrubber-fitted Kara Sea for $37m.
Another significant player selling is Harry Vafias’s Stealth Maritime who is widely reported letting go of the 17-year-old, Chinese-built, 113,000 dwt Crude Centurion for $33 m.
Chatter also surrounds a string of Japanese-built units, the 105,400 dwt Sofia II (2008), selling for $31m, sold by Flynn Ventures, while the slightly bigger one year older 110,000 dwt Mitsui-built Sea Falcon is noted sold for $30.5m. This ship was sold by Pantheon Tankers.
Spring Marine has also reportedly sold its second aframax in months, finding a Chinese buyer for the 2013-built, 104,000 dwt Lambada with a price tag of $30.3m attached to this deal.
The first aframax sale reported this year was between Kyklades Maritime and Dhaka-listed MJL Bangladesh. MJL Bangladesh tabled $45.3m for the 12-year-old Nissos Delos.
India’s finance minister Nirmala Sitharaman announced on Saturday the creation of a $2.9bn maritime development fund for the long-term financing of the country’s shipbuilding and repair industry, the latest in a series of measures the Narendra Modi administration is taking to make the world’s most populous nation a top 10 shipyard country by the end of the decade.
The government will contribute 49% of the fund and seek the remainder from ports and the private sector, with plenty of overtures made to Korean and Japanese shipyards to come and invest in recent months.
“By leveraging the PPP model, the scheme is designed to attract private investment, promote modernisation, and advance green technologies. These efforts will enhance India’s global competitiveness, drive sustainable growth, and solidify its position as a leading global maritime hub,” said minister of shipping, ports and waterways Sarbananda Sonowal.
On top of this the existing Shipbuilding Financial Assistance (SBF) policy will be revamped with Indian owners given financial perks to scrap ageing vessels and rejuvenate their fleets.
The dire start to the year for LNG carriers has hit new low benchmarks with some ship types now in negative territory in the Atlantic basin.
Spark Commodities, which tracks LNG rates, is reporting 160,000 cu m TFDE vessels were assessed at minus $2,250 per day at the end of last week, a negative round trip LNG freight rate. More standard 174,000 cu m tonnage was assessed a $3,500 a day, also a record low.
“As a result of record low rates, many market participants are looking at ways to optimise their operations, however it remains unclear whether these optimisations will be sufficient to absorb the surplus of modern 2-stroke vessels expected to remain open in the Atlantic over the next two months, especially as Europe’s demand for gas continues to draw Atlantic cargoes inward,” Clarksons Research noted in its latest weekly report.
Denmark’s MB Shipbrokers suggested spot rates have now hit “rock bottom” while many brokers have listed an increasingly number of ageing gas tankers heading for demolition in South Asia.
Looking ahead, broker SSY noted in a market outlook the LNG shipping market fundamentals appear bearish despite a ramp-up in production from under construction projects expected this year and next as over 150 newbuildings are expected to be delivered.
Elon Musk’s Department of Government Efficiency (DOGE) has been granted full access to the US Treasury Department’s payment system, according to reports from The New York Times and The Wall Street Journal. Historically, access to this system has been restricted to a small group of career civil servants due to its sensitivity.
The newly-appointed Treasury Secretary Scott Bessent authorized DOGE representatives, including Tom Krause, CEO of Cloud Software Group, to access the system, which manages over $6 trillion annually in federal payments, including Social Security, Medicare benefits, and tax refunds.
David Lebryk, a career official who had been acting as Treasury Secretary until Bessent’s confirmation, retired on Friday after reportedly resisting requests from Musk’s team for access to the payment system. Asked why a career bureaucrat would retire rather than comply with an audit request, Musk wrote on X that Treasury officials “literally never denied a payment in their entire career.”
“The DOGE team discovered, among other things, that payment approval officers at Treasury were instructed always to approve payments, even to known fraudulent or terrorist groups,” Musk said.
The Department of Government Efficiency, established by President Donald Trump and led by Musk, aims to identify and eliminate wasteful government spending. Musk has set a goal of reducing the federal deficit by at least $1 trillion, which would require daily cuts averaging $4 billion.
“That would still result in a ~$1T deficit, but economic growth should be able to match that number, which would mean no inflation in 2026,” Musk wrote, adding that he was “cautiously optimistic” about reaching this target.
DOGE’s access has sparked concerns among former Treasury officials and lawmakers over the security of the federal payment system. Senator Ron Wyden, the top Democrat on the Senate Finance Committee, warned of potential political interference: “I can think of no good reason why political operators who have demonstrated a blatant disregard for the law would need access to these sensitive, mission-critical systems.”
“Obviously, there will be EXTREME opposition from the grifters!! And they will make it sound like we’re cutting funding to save baby pandas when we’re actually cutting funding to fraudsters, wastrels & terrorists,” Musk said in another post Saturday.
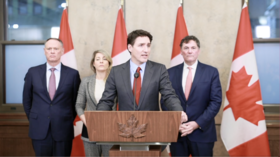
Prime Minister Justin Trudeau has said Canada must stand up for itself and protect its national interests amid US trade restrictions
Canadian Prime Minister Justin Trudeau has announced retaliatory 25% tariffs on American goods, hours after US President Donald Trump imposed sweeping trade restrictions on Canadian imports.
“Tonight, I am announcing Canada will be responding to the US trade action with 25% trade tariffs against $155 billion worth of American goods,” Trudeau said at a news conference on Saturday.
The first wave of tariffs, covering $30 billion worth of US goods, will take effect on Tuesday, with broader measures following in 21 days to allow Canadian companies to adjust.
“These tariffs will be far-reaching and include everyday items,” the Canadian leader said, listing alcohol, fruits, vegetables, clothing, and shoes. In addition to direct tariffs, Ottawa is exploring “several non-tariff measures,” which could include restrictions on critical minerals, energy procurement, and other trade partnerships.
“We will stand strong for Canada,” Trudeau said. “We will stand strong to ensure our countries continue to be the best neighbors in the world,” he added, urging citizens to support domestic businesses.
Trump’s 25% tariffs on nearly all Canadian goods were announced earlier on Saturday, with the White House citing concerns over illegal drug trafficking and immigration.
“The extraordinary threat posed by illegal aliens and drugs, including deadly fentanyl, constitutes a national emergency,” a White House fact sheet read. “President Trump is taking bold action to hold Mexico, Canada, and China accountable to their promises of halting illegal immigration and stopping poisonous fentanyl and other drugs from flowing into our country.”
The US president claimed that Canada has played “a central role” in America’s fentanyl crisis and failed to “devote sufficient attention and resources” to combat the flow of illicit drugs.
In an effort to avert the tariffs, Ottawa introduced a $1.3 billion spending plan aimed at strengthening border surveillance and tackling drug trafficking. Trump said on Friday, however, that there is “nothing Canada can do right now” to avoid the new tariffs.
Economists warn that the escalating trade dispute could lead to rising consumer prices and economic disruptions in both countries.
The US president has placed restrictions on Chinese goods in what he said was retaliation for failing to stem the flow of migrants and drugs into America
China will file a lawsuit at the World Trade Organization (WTO) and take other retaliatory measures against US President Donald Trump’s new tariffs on its goods, the Commerce Ministry said in a statement on Sunday. According to the statement, Beijing sees Washington’s unilateral tariff increase as “seriously violating” WTO rules.
Trump announced new tariffs on China, Mexico, and Canada on Saturday, citing concerns over the three countries’ failures in stemming the flow of migrants and illegal drugs, such as fentanyl, into the US. In order to hike the tariffs, Trump declared a national economic emergency, invoking the International Emergency Economic Powers Act (IEEPA), which authorizes the president to unilaterally manage imports.
The tariffs, set to enter into effect on February 4, will amount to a 25% tax on all imports from Mexico and most goods from Canada, and a 10% tariff on Chinese goods. According to a fact sheet published by the White House, the tariffs will be in place with no exemptions “until the crisis is alleviated.”
China’s Commerce Ministry said Beijing is “strongly dissatisfied” with Washington’s action and “firmly opposes” it.
“It is not only unhelpful in solving [Washington’s] own problems, but also undermines the normal economic and trade cooperation between China and the US,” the ministry stated, adding that Beijing “will take corresponding countermeasures to firmly safeguard its own rights and interests,” without disclosing details. It added that the US should “objectively and rationally view and deal with its own problems” such as illegal drug imports, instead of “threatening other countries with tariffs.”
The ministry said Beijing will file a formal complaint over the new tariffs with the WTO, which has legal power to permit a country suffering from another country’s tariffs to respond with its own. As both the US and China are WTO members, they are required to abide by its decisions when in dispute.
China’s Foreign Affairs Ministry called the tariffs “not constructive,” warning that this could reignite a trade war.
“China’s position is firm and consistent. Trade and tariff wars have no winners… This move cannot solve the US’s problems at home and more importantly, does not benefit either side, still less the world,” the ministry said in a statement late Saturday. It also warned that the new tariffs will “harm the counternarcotics cooperation between the two sides in the future.”
Canada and Mexico have already lashed out against Trump’s accusations and tariffs. Hours after the announcement, Canada slapped 25% tariffs on US goods, which will be “far-reaching and include everyday items,” according to Prime Minister Justin Trudeau. Mexican President Claudia Sheinbaum instructed the Economy Ministry on Saturday to implement “Plan B,” which involves tariff and non-tariff retaliatory measures against Washington. While details have not been disclosed, sources claim that Mexico aims to impose measures on US industries such as agriculture.
Six workers have been injured as a result of a fire at California’s Martinez Refining Company
A massive fire broke out at a refinery in Martinez, California on Saturday, prompting a shelter-in-place order for surrounding neighborhoods due to concerns about air quality. The order has since been lifted.
The blaze erupted after a hydrocarbon leak triggered an an explosion, local media outlet Mercury News reported. The fire was “burning ferociously,” with an unknown amount of fuel remaining, the news site cited Contra Costa County Fire Protection District Battalion Chief Bob Atlas as saying. He added that the smoke would become toxic at some point.
A video shared on social media shows the production facility operated by Martinez Refining Company on fire with plumes of black smoke swirling across neighboring areas.
The company said in a statement that a total of six injuries have been recorded, adding that four people were transported away from the scene, and two were treated on site and released.
Martinez Refining Company reported the fire at 1:47pm local time, stressing that it may affect people with respiratory issues in nearby neighborhoods. The company added that its HAZMAT team is investigating whether there will be community health impacts.
The local health authorities later said that air quality in areas near the refining facility has improved, adding that a Public Health Advisory remained for Martinez, parts of Pacheco, and Clyde as of 2:45pm.
The San Francisco Chronicle reported, citing the state’s Office of Emergency Services, that the fire resulted in the release of at least 500 pounds (227kg) of sulfur dioxide into the atmosphere. Contra Costa said, as cited by the news outlet, that the refinery, which is run by PBF Energy, will be required to produce a report analyzing the root causes of the fire in accordance with Martinez’s Industrial Safety Ordinance.
Firefighters rushed to the Martinez Refining Company but couldn’t get inside right away. Thick smoke filled the air, and officials had no idea what chemicals might be burning. A public health advisory is now in effect for Martinez and Pacheco. Air quality inspectors are on-site, warning that the smoke plume could impact nearby cities. People with respiratory issues are especially at risk. Residents were told to stay indoors as crews battle the fire. Source: Police Frequency, CBS News,
BREAKING: EXPLOSIVE FIRE AT CALIFORNIA REFINERY—TOXIC SMOKE WARNING ISSUED
Firefighters rushed to the Martinez Refining Company but couldn’t get inside right away.
Thick smoke filled the air, and officials had no idea what chemicals might be burning.
Britain risks being left more vulnerable to blackouts as a political row in Norway over power exports escalates.
The Norwegian government collapsed this week following a row over EU green energy laws. A junior coalition partner in the government quit in protest at plans to implement the policies, amid a broader rise in energy nationalism in the country.
Experts said the collapse raised questions over Britain’s reliance on Norwegian energy imports to keep the lights on. Last weekend, Norway accounted for 4pc of the UK’s power, coming via cables that run under the North Sea.
Kathryn Porter, an energy consultant at Watt-Logic, said there was “increasing pressure” on Oslo to reevaluate its relationship with the UK on electricity.
Before the Norwegian coalition’s collapse, both governing parties had signalled they wanted to end a deal to supply Denmark with electricity and renegotiate deals with the UK and Germany.
Norway is a key source of electricity for Britain when the nation’s own power supplies dip. Norway generates energy from its hydroelectric power facilities, which offer a stable source of electricity in contrast to intermittent solar and wind.
Britain is expected to become increasingly reliant on electricity imports under Ed Miliband’s net zero push as Labour seeks to decarbonise the grid by switching to intermittent renewables, with wind power forming a crucial pillar of its plans.
Politicians have warned that this strategy risks leaves Britain reliant on neighbours to safeguard its energy security. Nick Timothy, a Conservative MP, said the row in Norway “demonstrates the danger of becoming over-reliant on imports to provide our electricity, and the danger in rushing to decarbonise the grid by 2030”.
He said: “Whatever Ed Miliband wishes, policy cannot move faster than technology. Ignoring this obvious truth risks our energy security, our international competitiveness and the well-being of the public.”
Ms Porter said there was no imminent risk to power supplies, stressing that Norway would not simply turn off of the inter-connector cable that supplies electricity and would be more likely to want to renegotiate to potentially bring in tariffs.
However, she said the collapse of the Norwegian coalition did raise questions for Britain’s energy security. Ms Porter said: “If we continue along the trajectory that Ed Miliband wants the UK on, we’ll rely on inter-connectors a lot more, but they’re not necessarily going to be available.”
Electricity exports have become a flashpoint in Norway, where the public has been facing soaring energy prices in recent years. Critics have claimed the undersea interconnector cables force prices higher.
In December, prices in southern Norway were almost 20 times higher from one week to the next, when a lack of wind in Germany led to a surge in electricity exports.
In 2022, when Norway opened inter-connectors to Britain and Germany, prices in the south of the country – where the cables connect to – soared by a factor of 10.
A backlash over high energy prices in the country has increased pressure to cut electricity links into Europe. The country is set to go to the polls in September, with the issue expected to be front and centre of debates.
Norway’s two-party coalition broke up on Thursday after the centre party leader said he could not accept three EU directives on increasing renewable energy sources and efficiency.
Following the collapse of the coalition, the centre-Left Labour party will govern alone for the first time in 25 years until elections later this year.
Britain was struck by tight supplies of energy earlier this month when there was a plunge in wind speeds. Experts had said the country came “within a whisker” of blackouts, with grid operators scrambling to keep the lights on.
The National Energy System Operator (Neso) has pushed back against these claims, saying it had been holding around 1.4 gigawatts in emergency reserves that went unused. These are held back for a worst-case scenario in which a major generator suddenly fails.
However, the tight margin shed light on the potential risks of relying so heavily on wind and solar farms.
A Department for Energy Security and Net Zero spokesman said: “It is categorically untrue that our electricity or gas supplies have been at risk this winter. We are confident we will have sufficient energy supply to meet demand, due to our diverse and resilient energy system.
“Last year, the Prime Minister and his Norwegian counterpart signed a joint declaration to deepen this strong and long-standing partnership – including on energy security – and we have comprehensive arrangements on interconnectors to provide mutually beneficial trade in electricity.”


 BREAKING: EXPLOSIVE FIRE AT CALIFORNIA REFINERY—TOXIC SMOKE WARNING ISSUED

