Energy News Beat
Where inflation hit in April: Rent, motor vehicle insurance & maintenance, eating out, medical care services, rental cars, utility natural gas, electricity… But prices of apparel & shoes fell.
By Wolf Richter for WOLF STREET.
On a month-to-month basis, inflation bounced back in April, driven by core services and to a lesser extent by utility natural gas and electricity, according to data from the Bureau of Labor Statistics today. Food prices dipped. Prices of apparel and footwear also dipped.
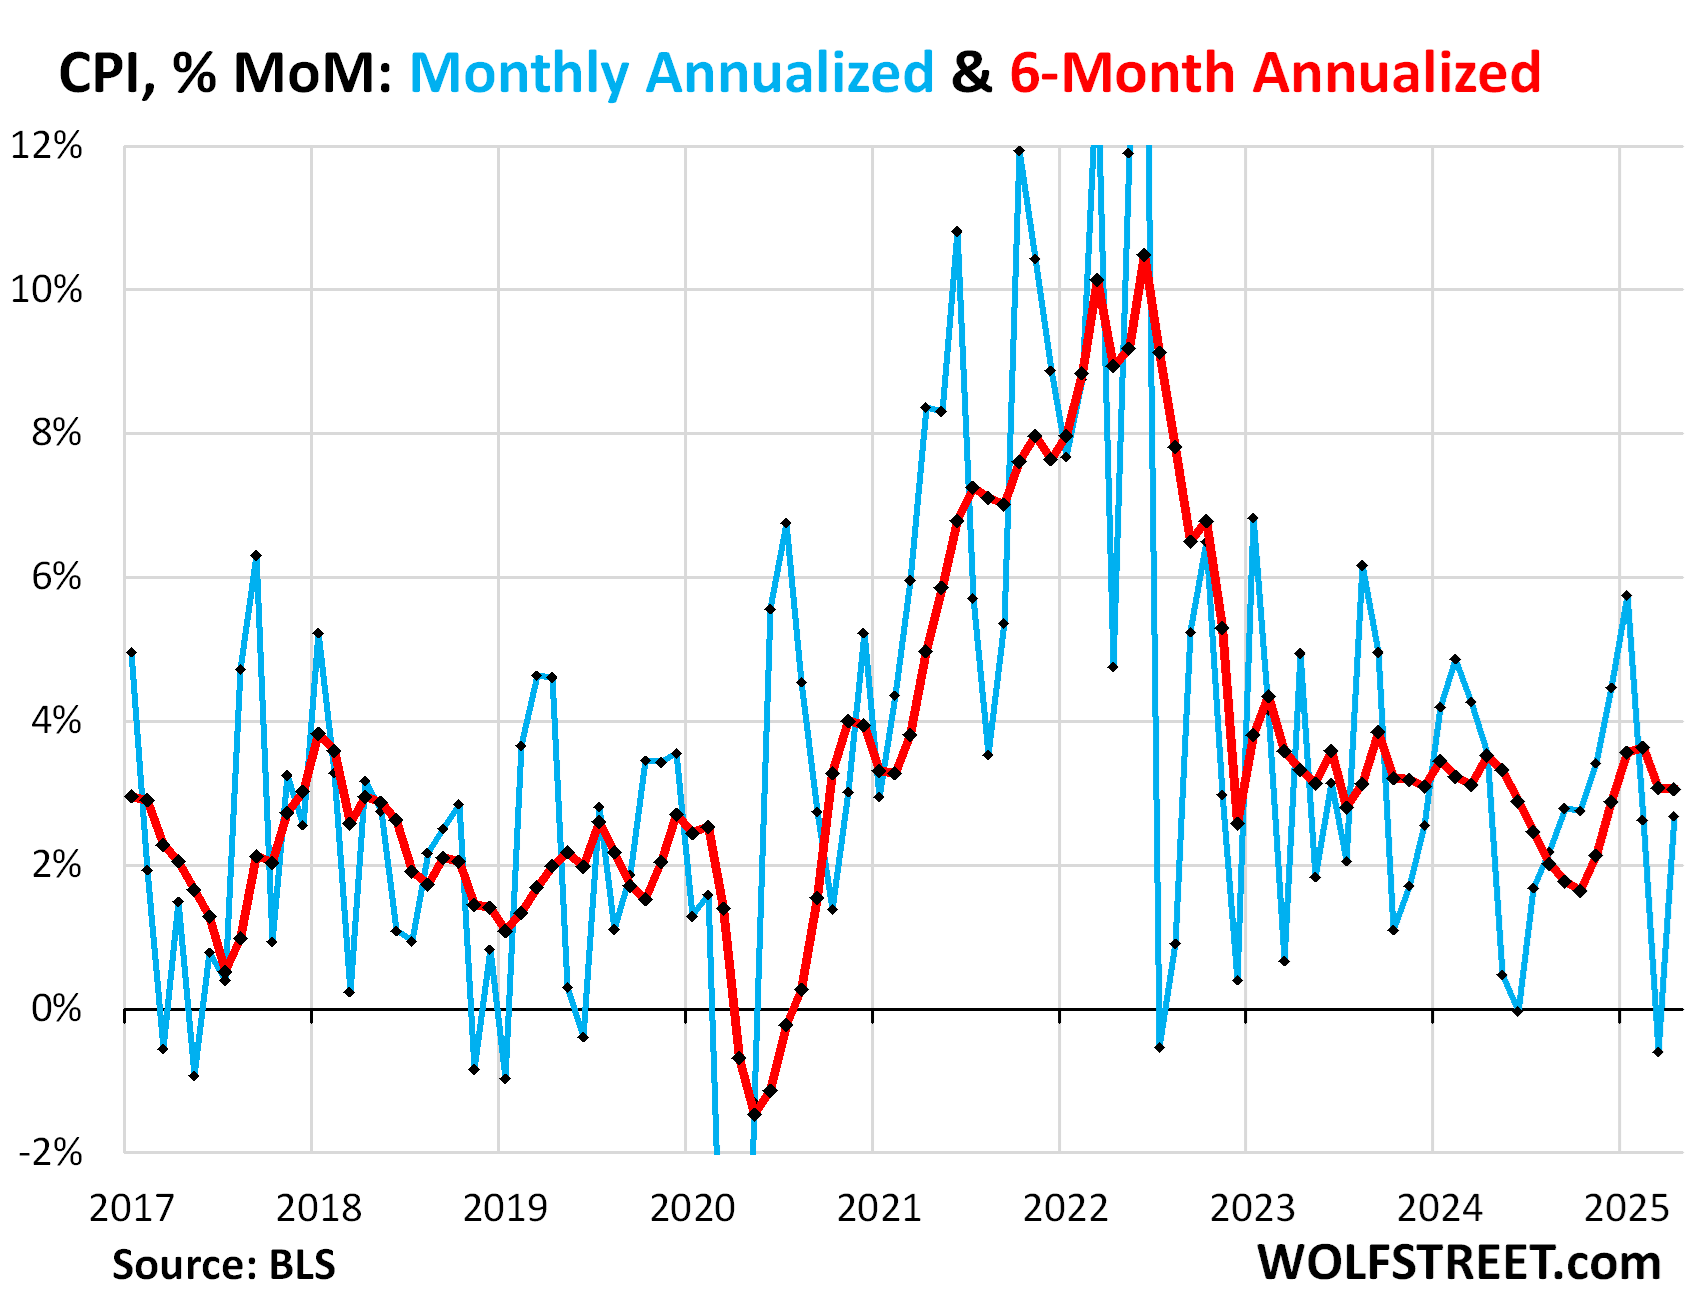
The Consumer Price Index bounced back and rose by 0.22% (+2.7% annualized) in April from March, after the 0.05% dip (-0.6% annualized) in March (blue in the chart below). There was no evidence of tariffs getting passed through to consumers. The inflation came from services, and also from utility natural gas and electricity.
This bounce-back from the drop caused the 6-month CPI to rise by 3.1% annualized, same as in March (red in the chart):
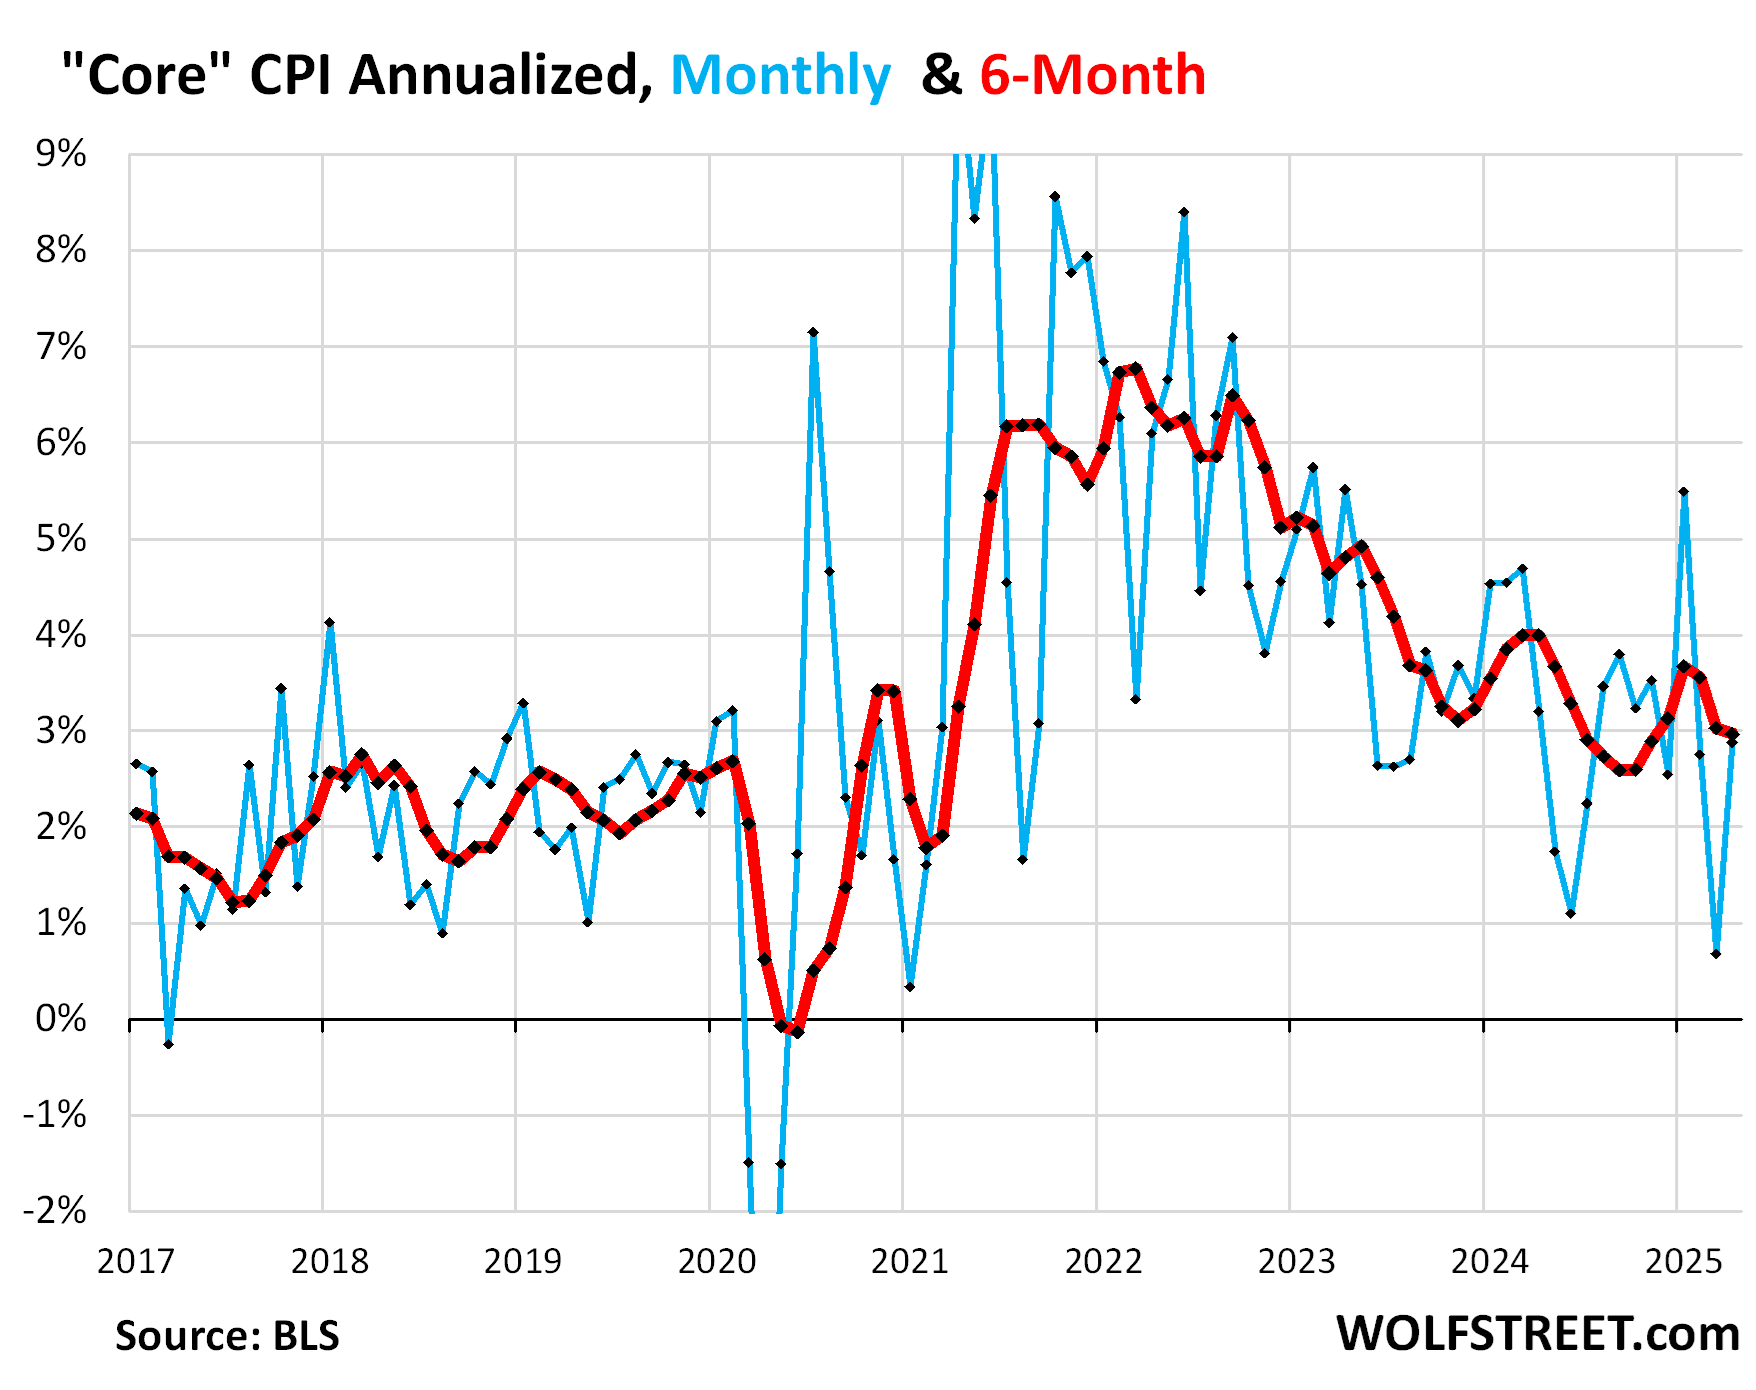
“Core” CPI, which excludes food and energy components to track underlying inflation, also bounced back, driven by core services, and rose by 0.24% (2.9% annualized) in April from March (blue in the chart below).
The 6-month “core” CPI rose by 3.0% annualized, essentially the same as in the prior month (red).
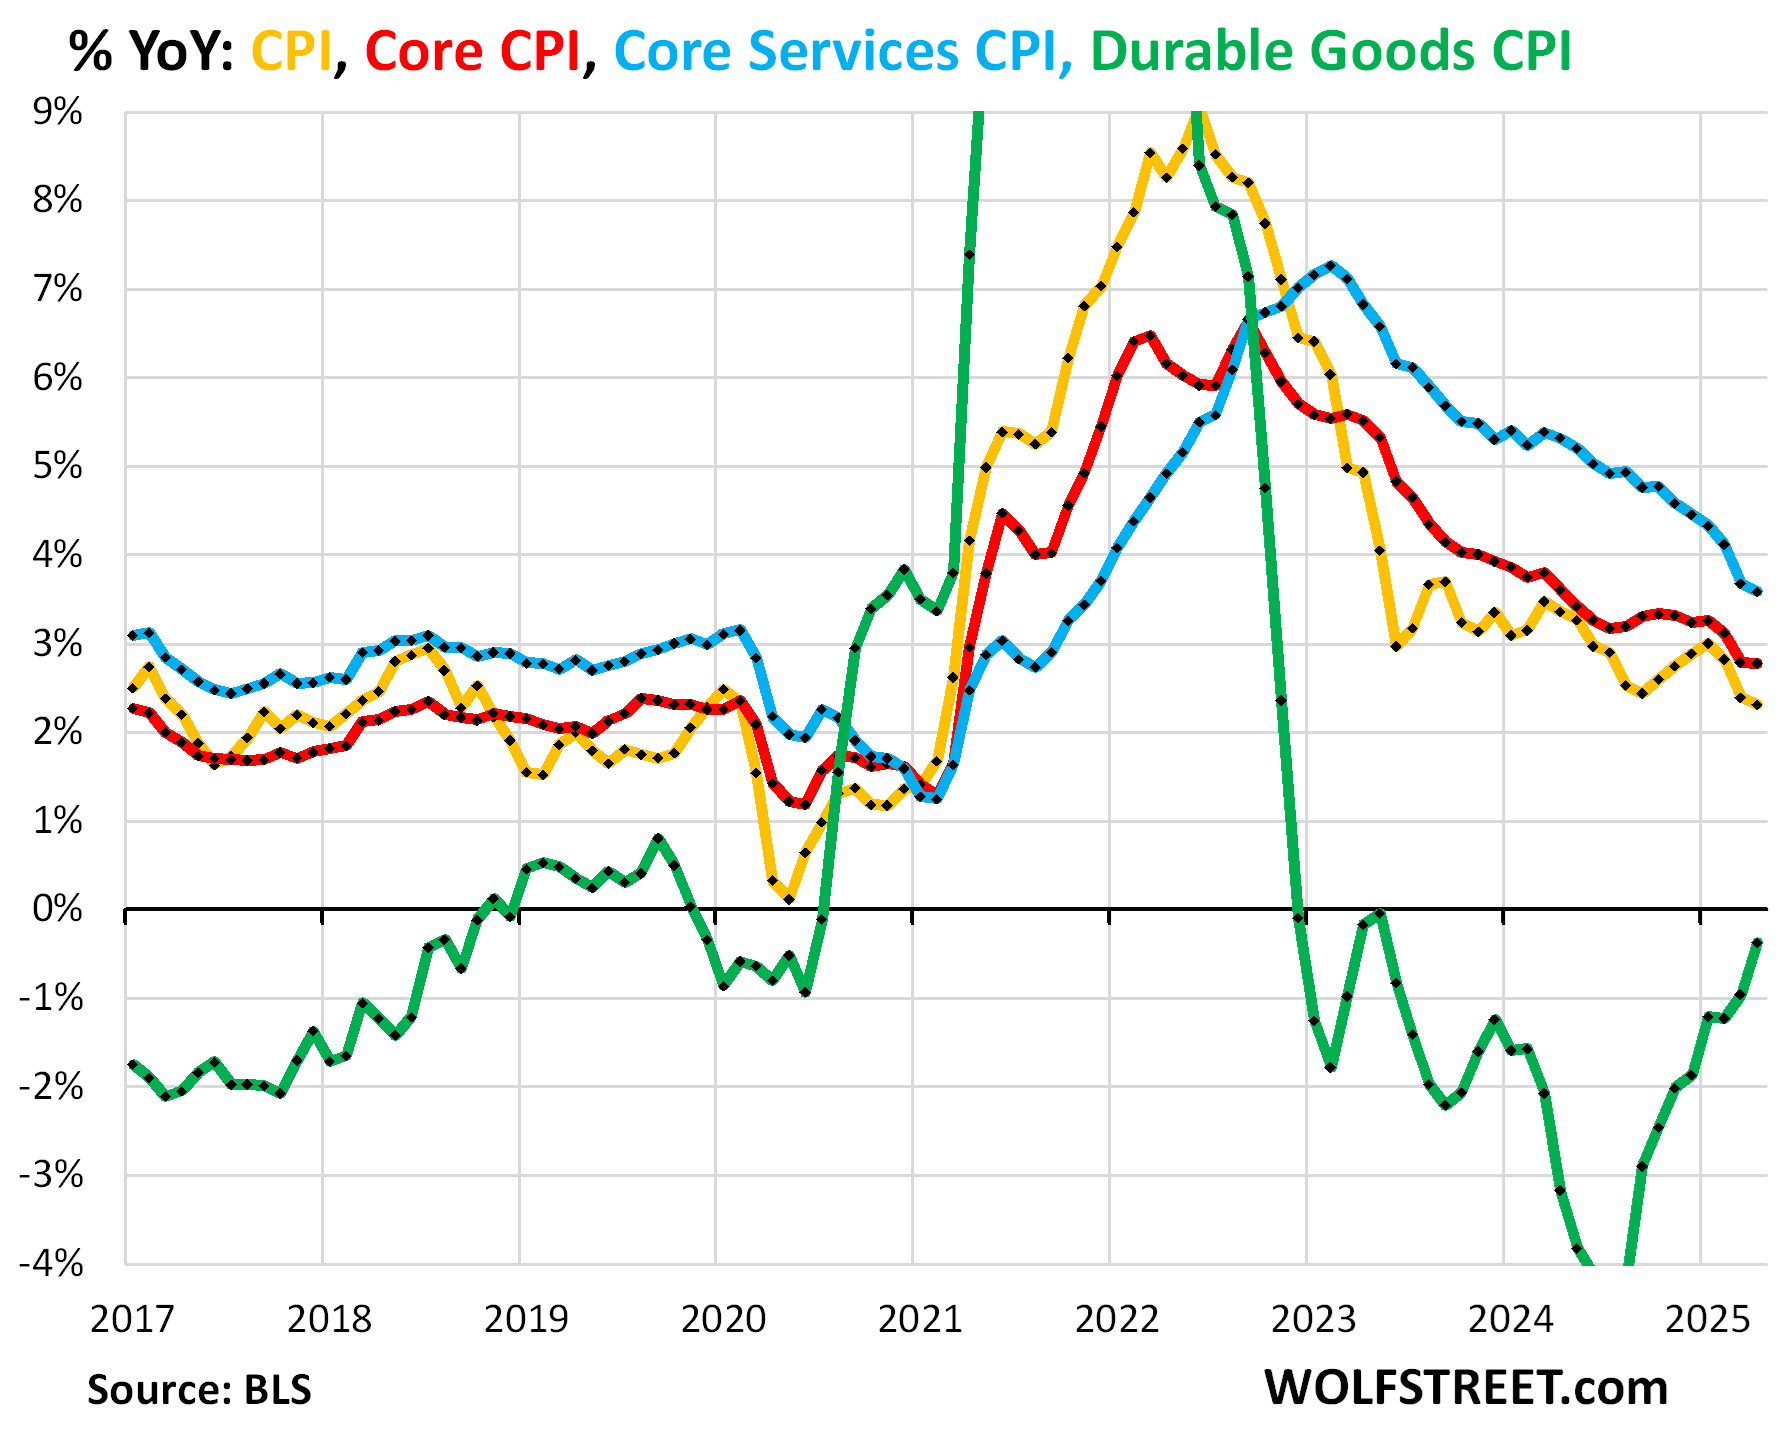
The major components of inflation, year-over-year price changes:
- Overall CPI: +2.3% (yellow), a slight deceleration from March.
- Core CPI +2.8% (red), essentially unchanged from March.
- Core Services CPI: +3.6% (blue), a slight deceleration from March.
- Durable goods CPI: -0.4% (green), continuing the trend of ever smaller year-over-year declines.
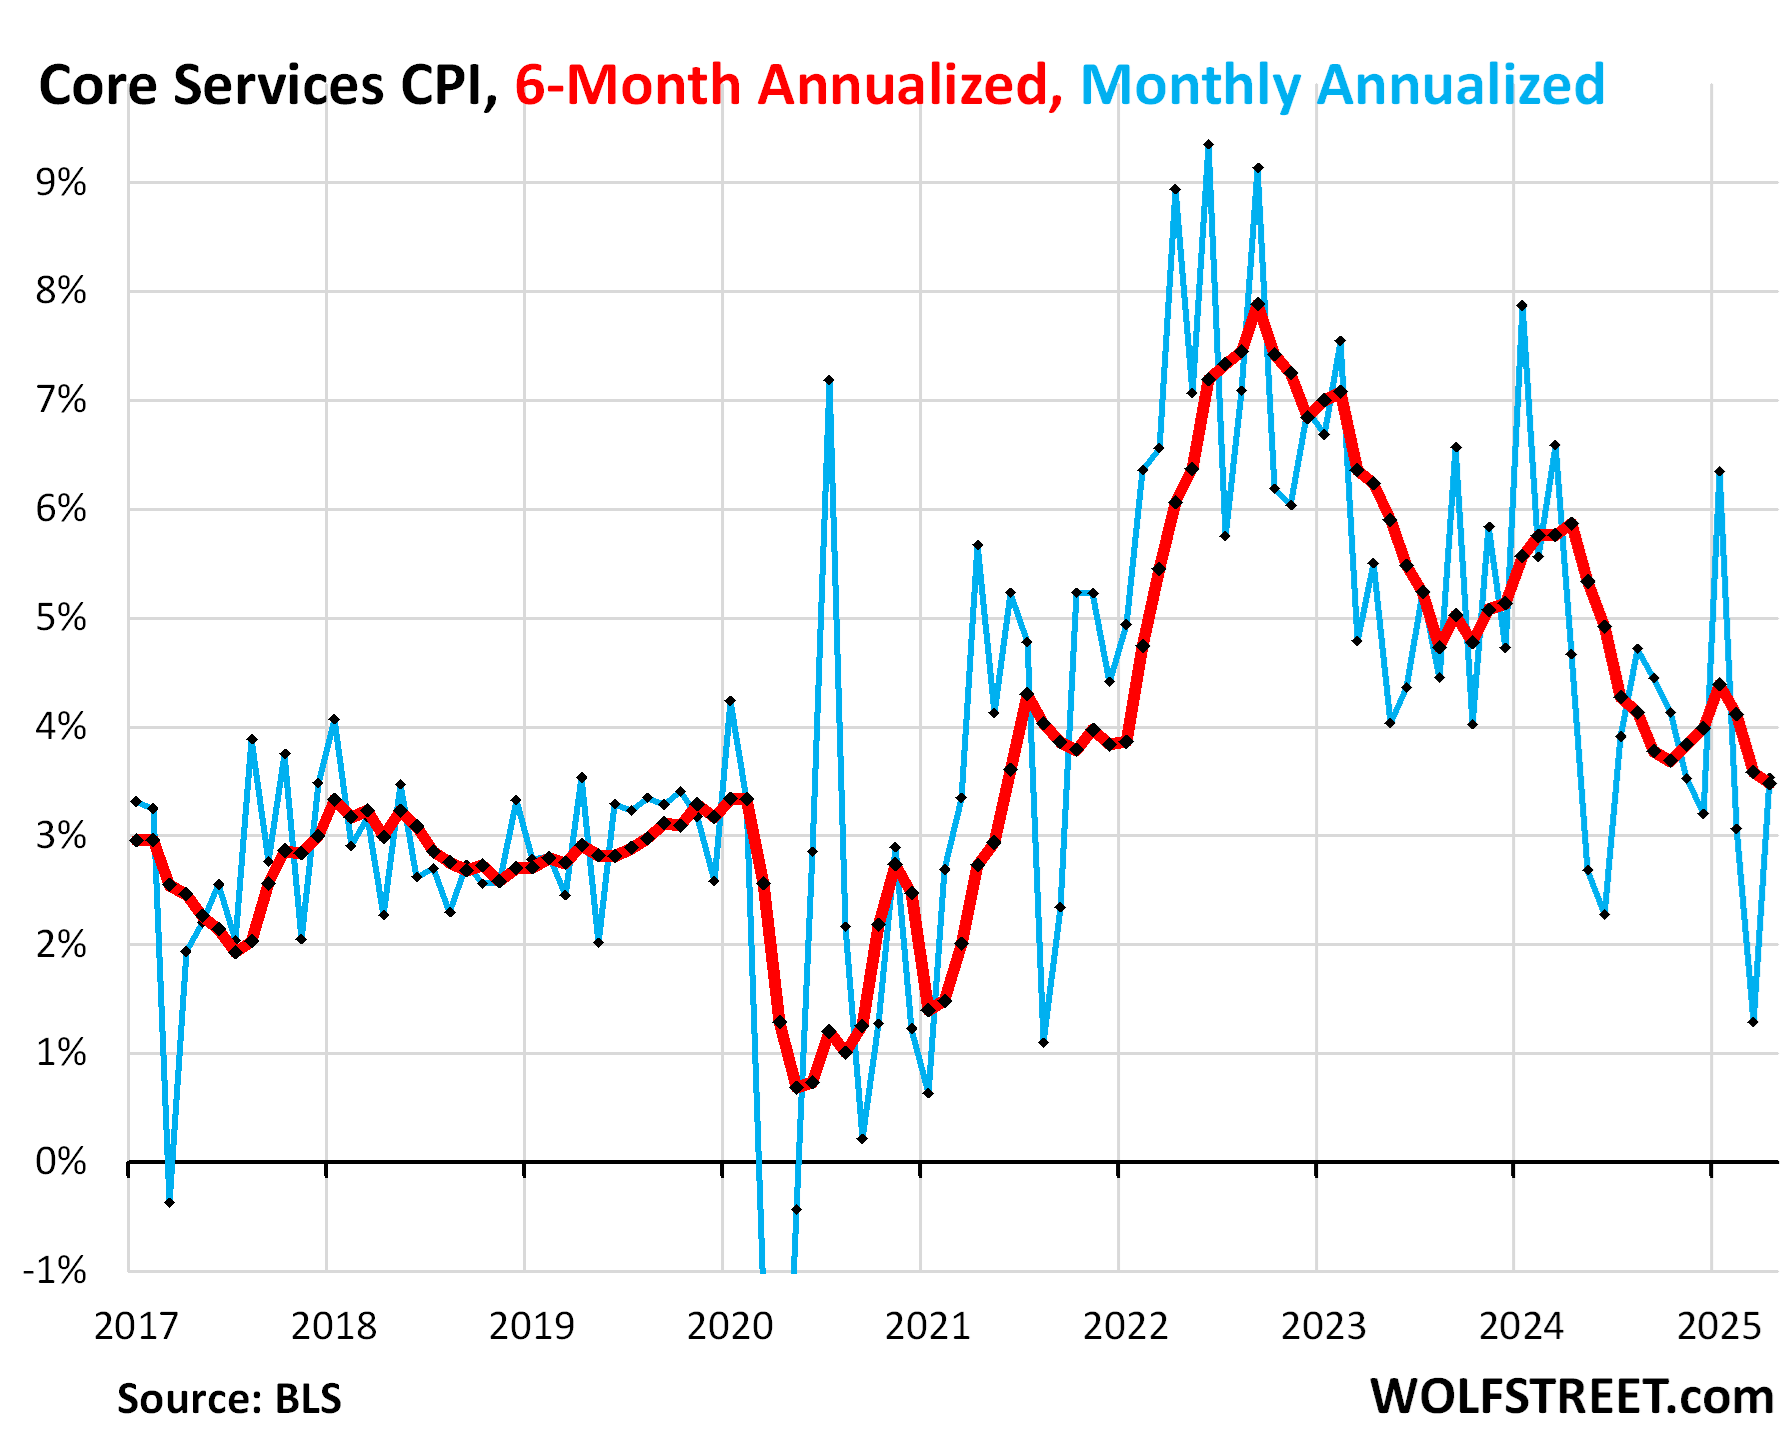
“Core services” CPI.
Core services CPI accelerated to +0.29% (+3.5% annualized) in April from March, the biggest month-to-month increase since January.
The 6-month core services CPI rose by 3.5% annualized, a slight deceleration from March (red).
Core services include all services except energy services and account for about two-thirds of the overall CPI.
Housing components of core services.
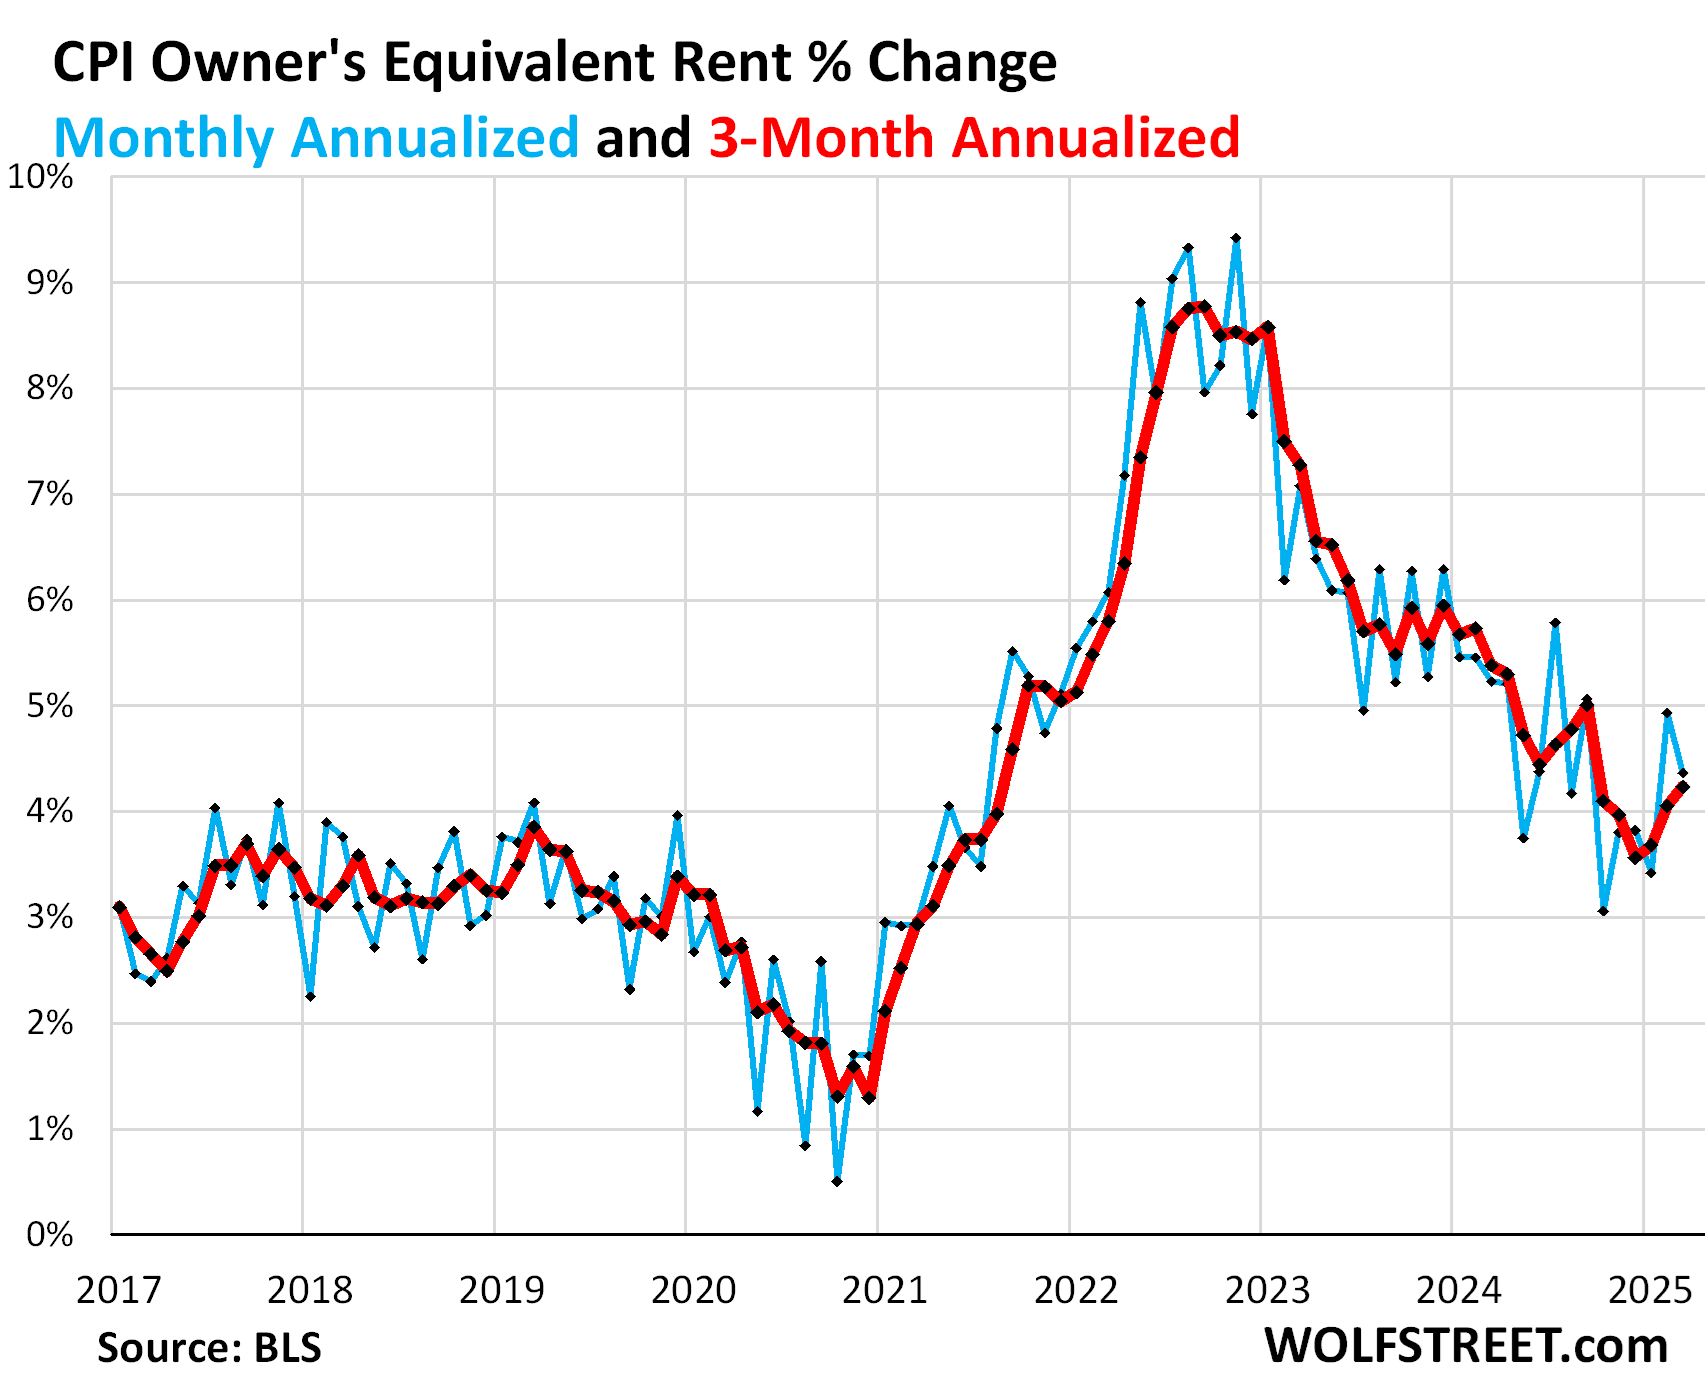
Owners’ Equivalent of Rent CPI rose by 0.36% (+4.4% annualized) in April from March, a deceleration from the jump in March (worst since October).
The three-month average accelerated further to +4.2% annualized, the worst increase since October.
OER indirectly reflects the expenses of homeownership: homeowners’ insurance, HOA fees, property taxes, and maintenance. It’s the only measure for those expenses in the CPI. It is based on what a large group of homeowners estimates their home would rent for, with the assumption that a homeowner would want to recoup their cost increases by raising the rent.
As a stand-in for homeowners’ insurance, HOA fees, property taxes, and maintenance costs, OER accounts for 26.1% of overall CPI and estimates inflation of shelter as a service for homeowners.
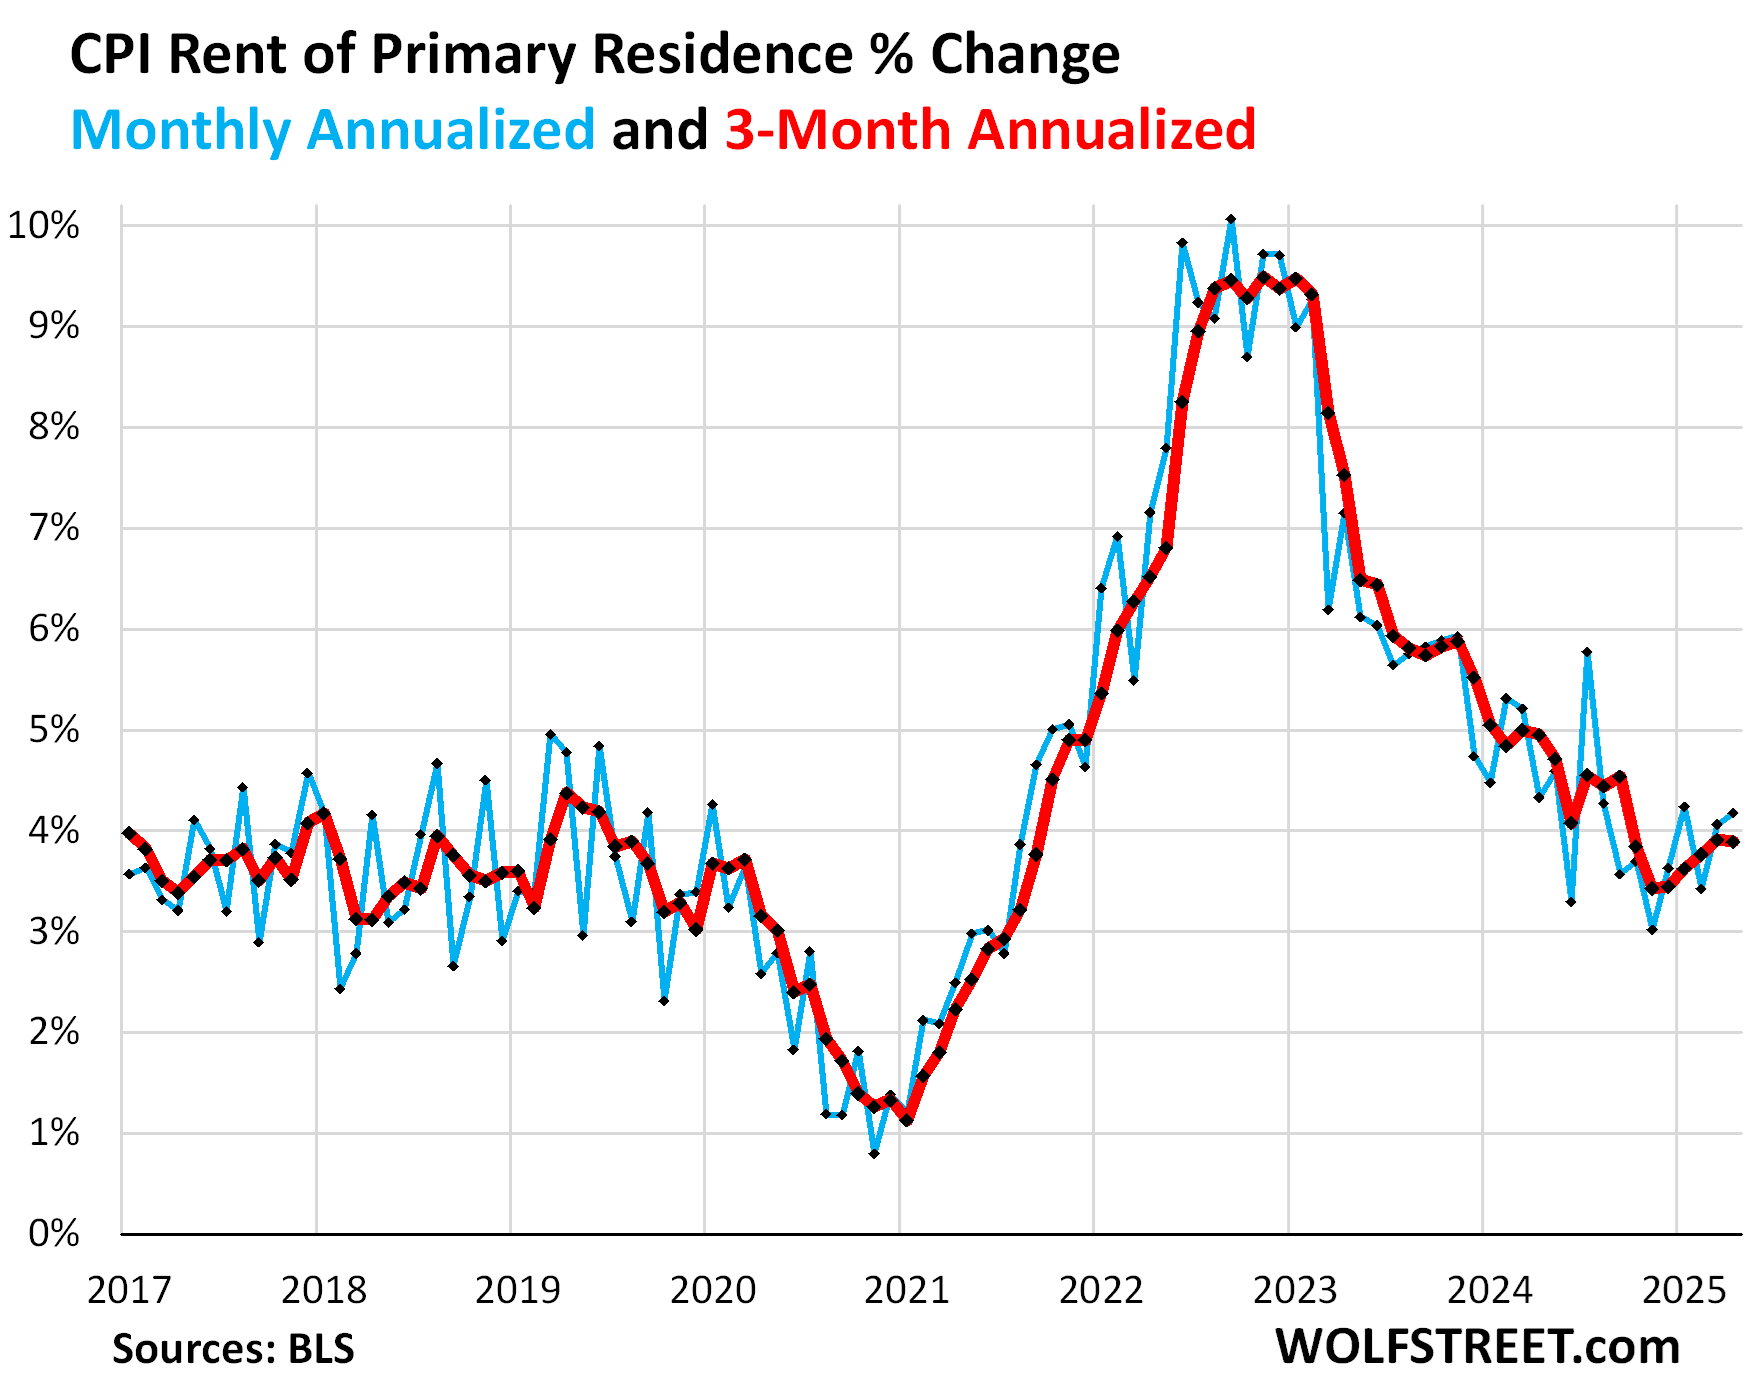
Rent of Primary Residence CPI rose by 0.34% (+4.2% annualized) in April from March, the second acceleration in a row.
The 3-month rate rose by 3.9% annualized, roughly the same rate as in March, and both were the worst increases since September.
Rent CPI accounts for 7.5% of overall CPI. It is based on rents that tenants actually paid, not on asking rents of advertised vacant units for rent. The survey follows the same large group of rental houses and apartments over time and tracks the rents that the current tenants, who come and go, pay in rent for these units.
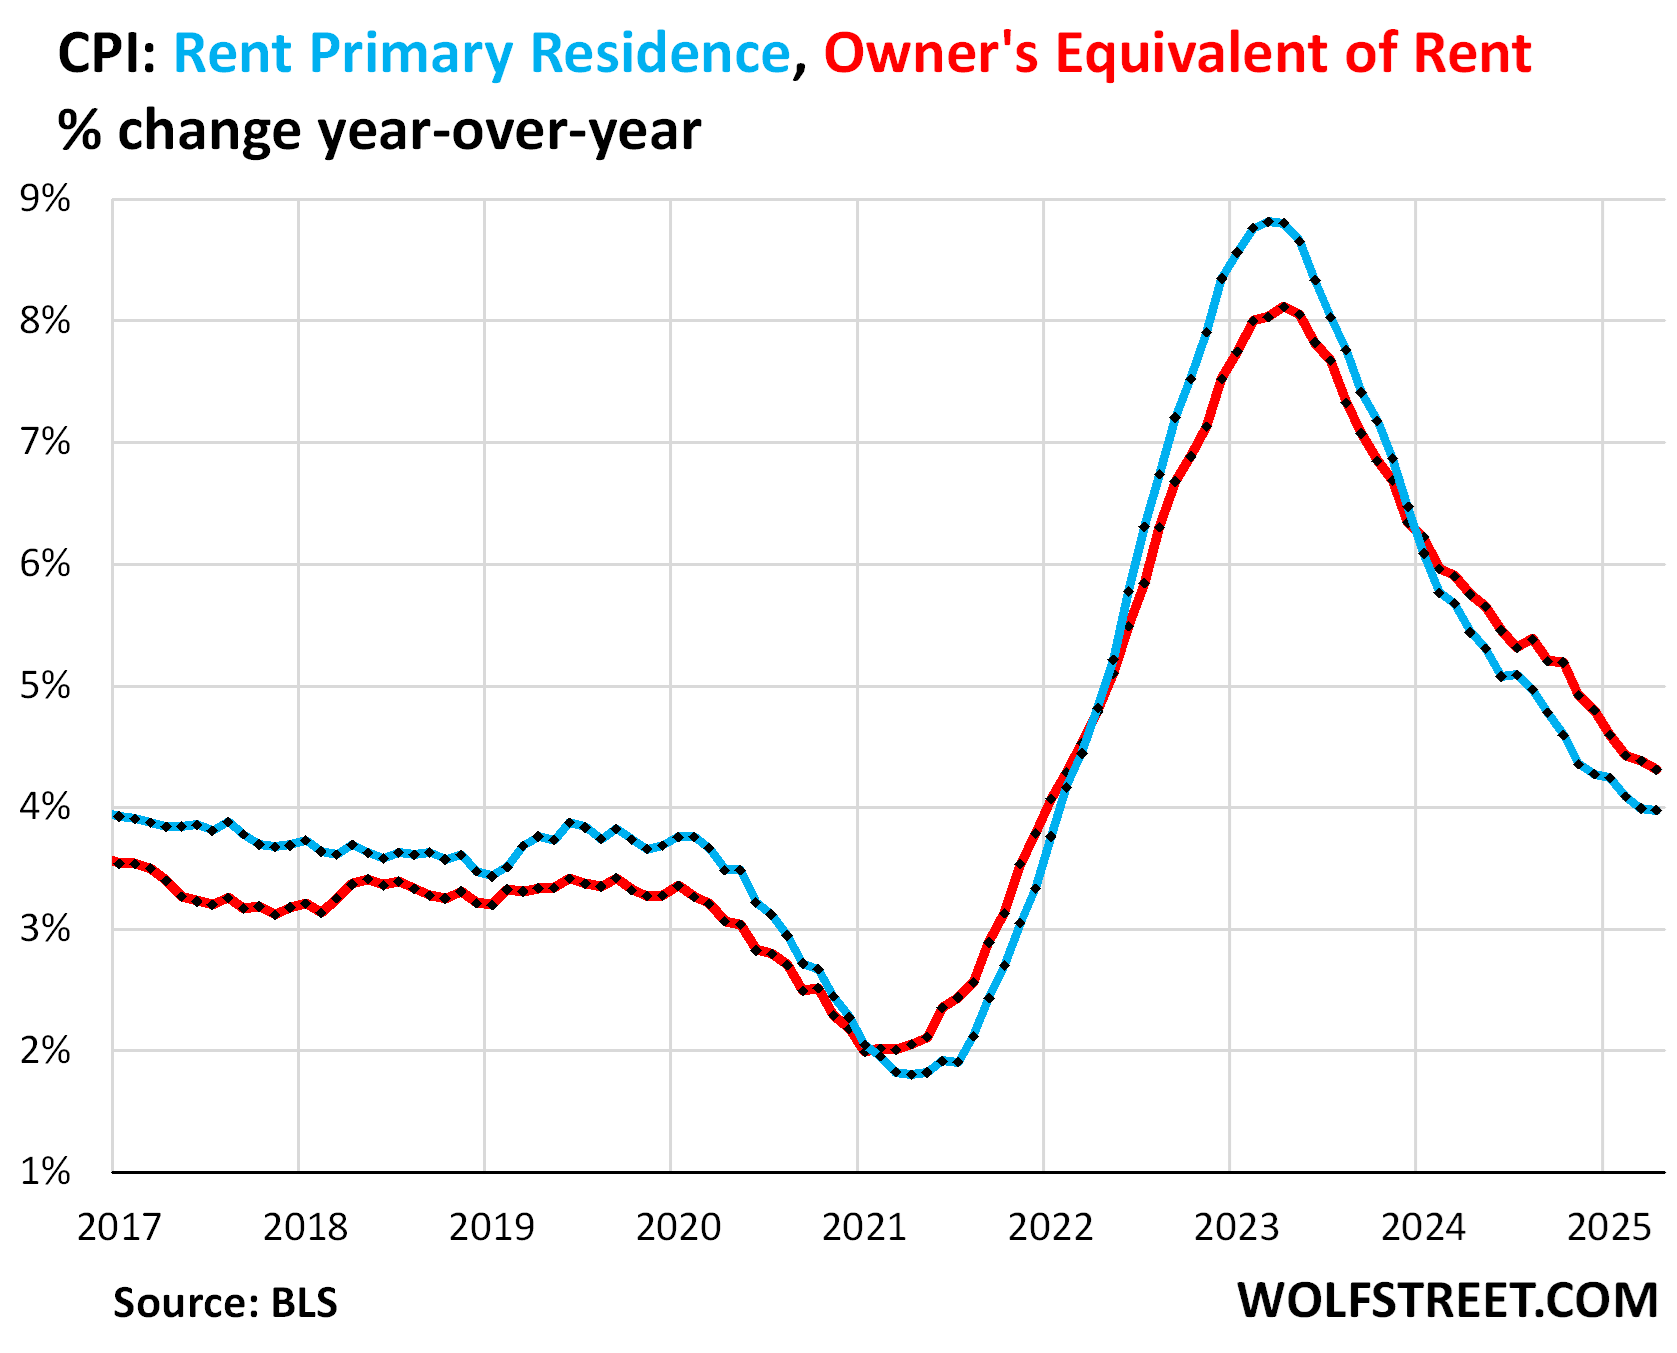
Year-over-year, rent CPI (blue in the chart below) rose by 4.0%, roughly the same as in March. OER rose by 4.3%, a slight deceleration from March (red).
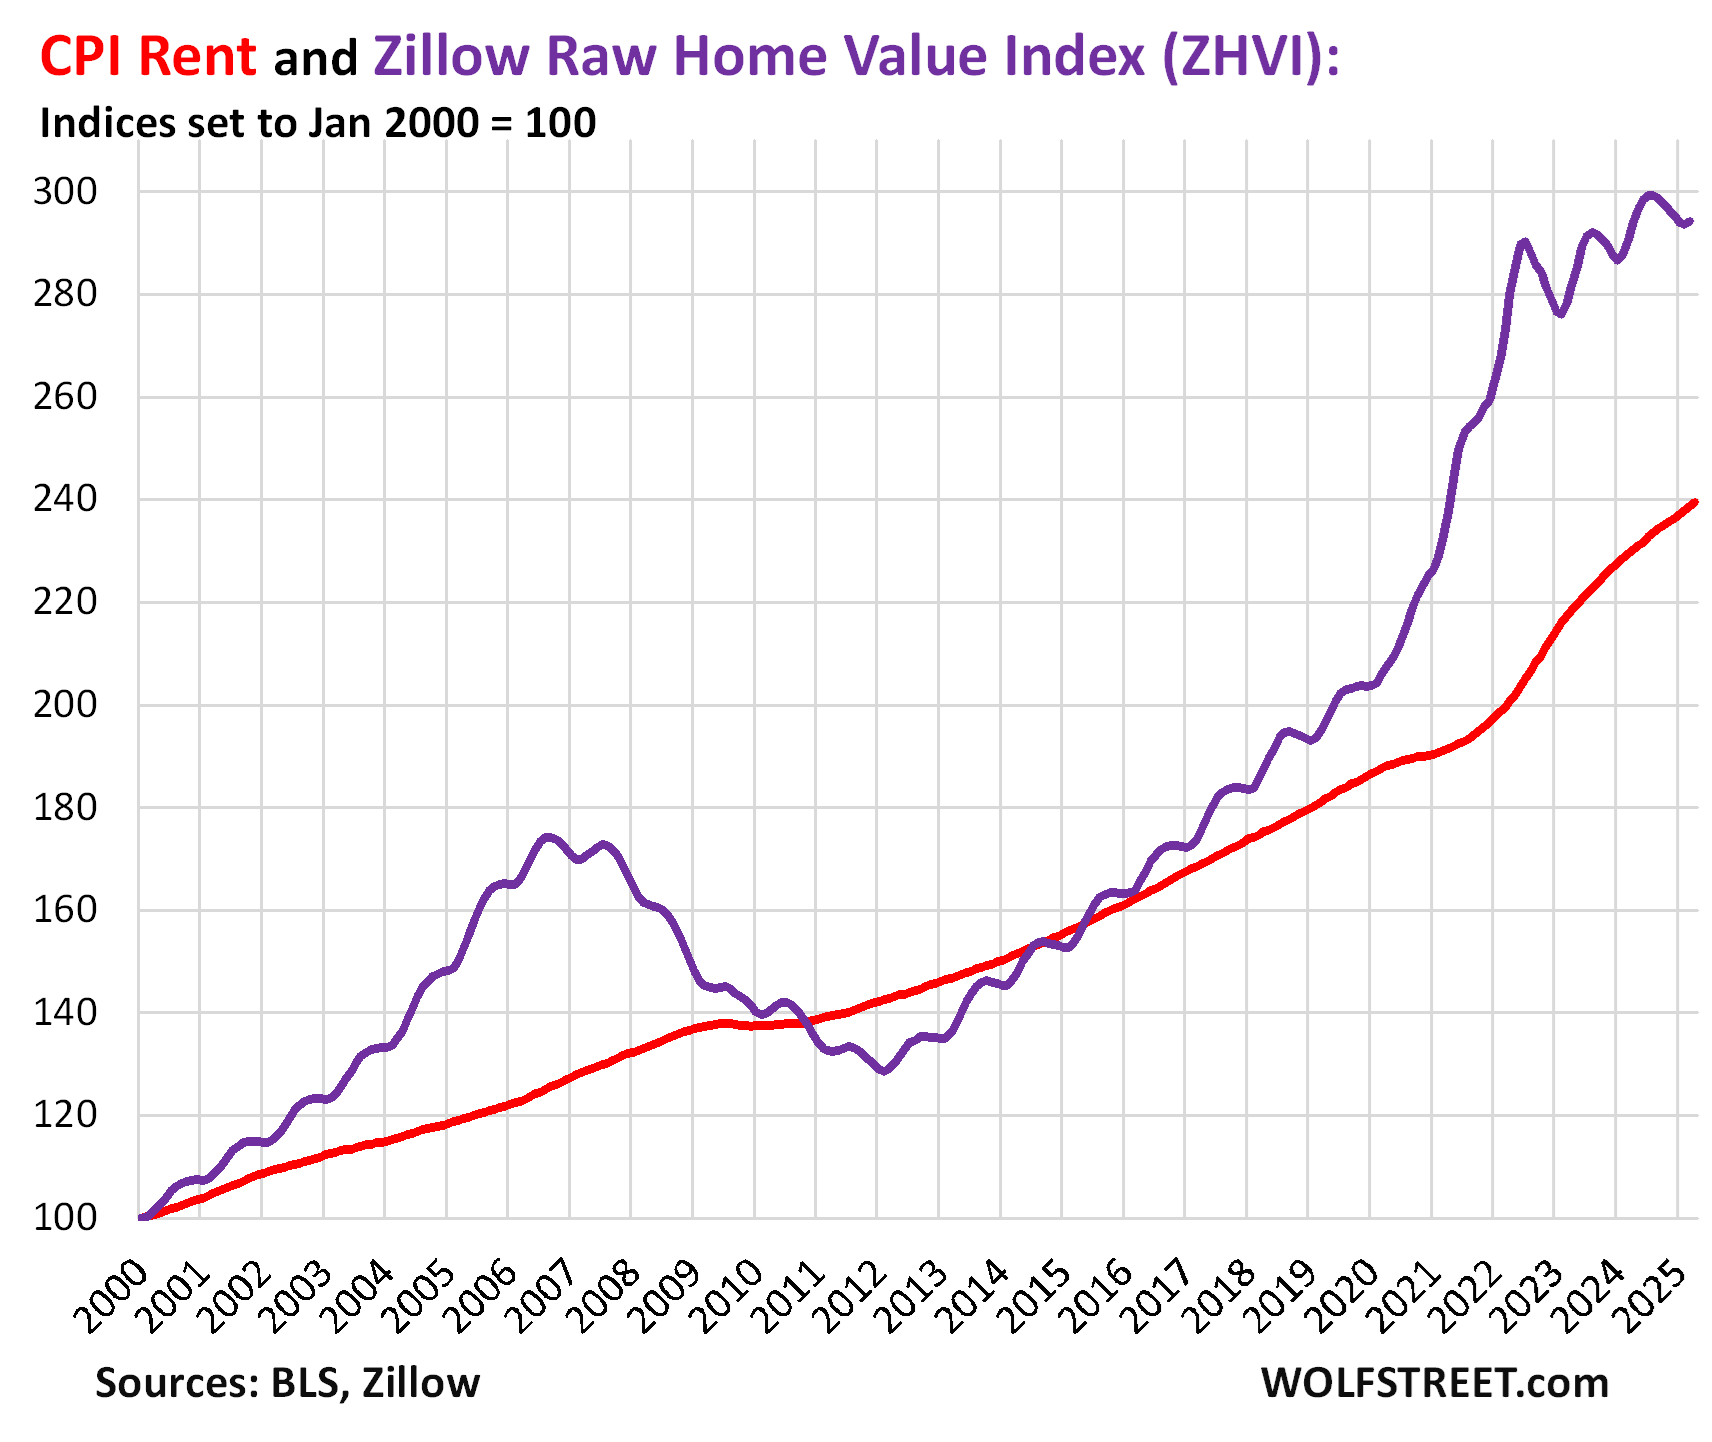
Rent inflation vs. home-price inflation: The red line in the chart below represents the CPI for Rent of Primary Residence as index value. The purple line represents Zillow’s “raw” (not seasonally adjusted) Home Value Index for the US through March. Both indexes are set to 100 for January 2000. But home-price changes vary by metro and range from steep declines to continued increases, see the 33 Most Splendid Housing Bubbles in America.
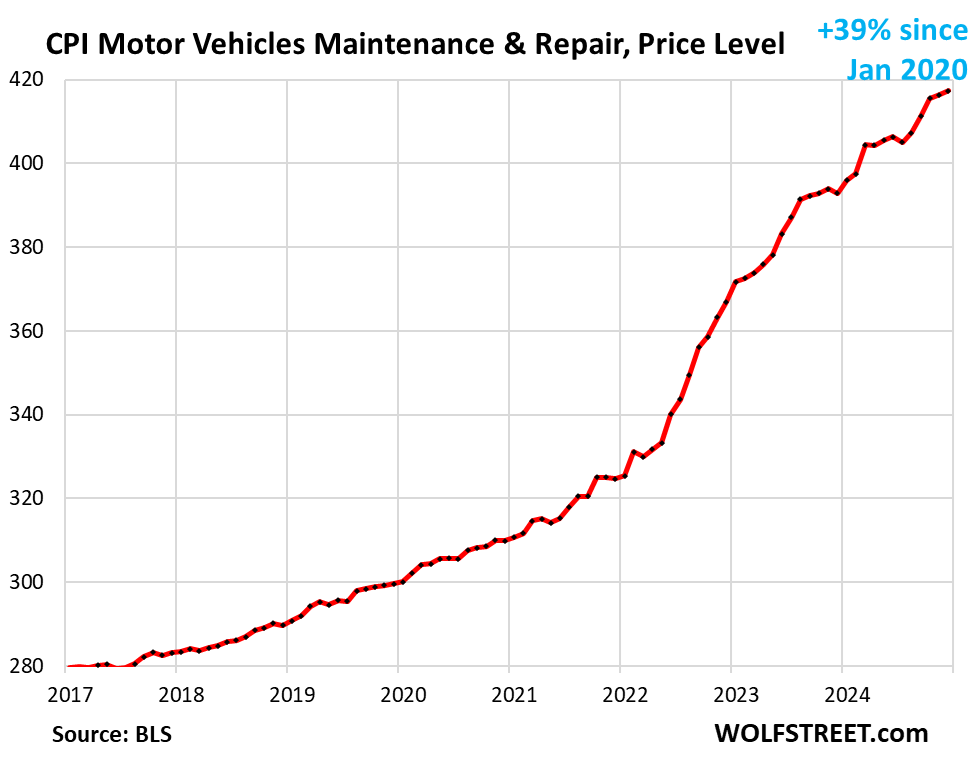
The CPI for motor-vehicle maintenance & repair jumped by 0.67% (+8.3% annualized) in April, the second-worst month-to-month increase since October, the worst having been in March.
Year-over-year, the index rose by 5.6%. Since January 2020, it has exploded by 42%. This chart shows the price level, not the year-over-year percentage change:
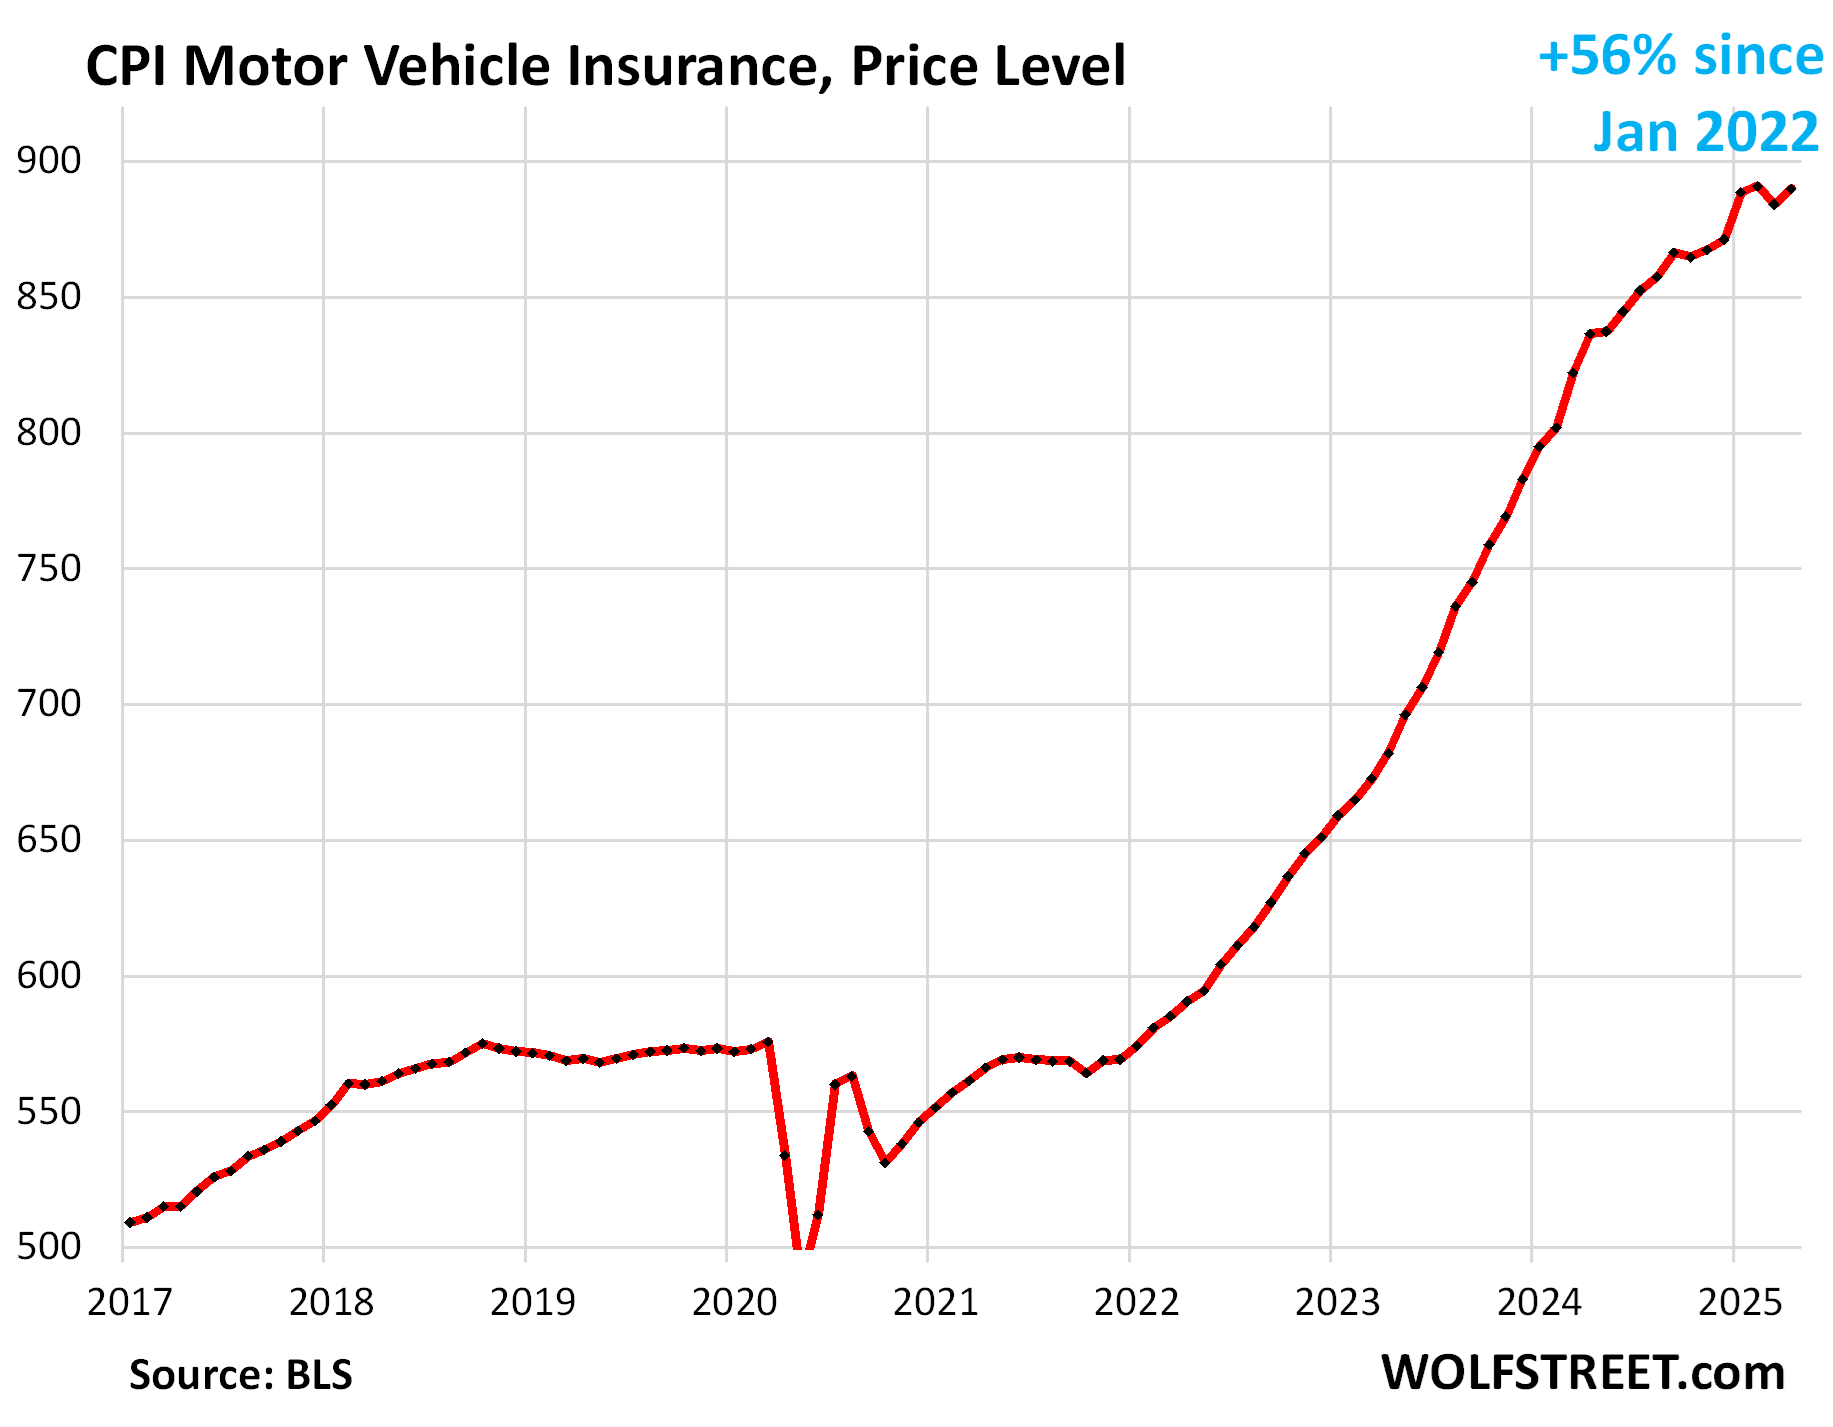
The CPI for motor vehicle insurance jumped by 0.65% (+8.0% annualized) in April from March, after a drop in February.
Year-over-year, the index accelerated to +6.4%. Since January 2022, motor vehicle insurance prices have exploded by 56%.
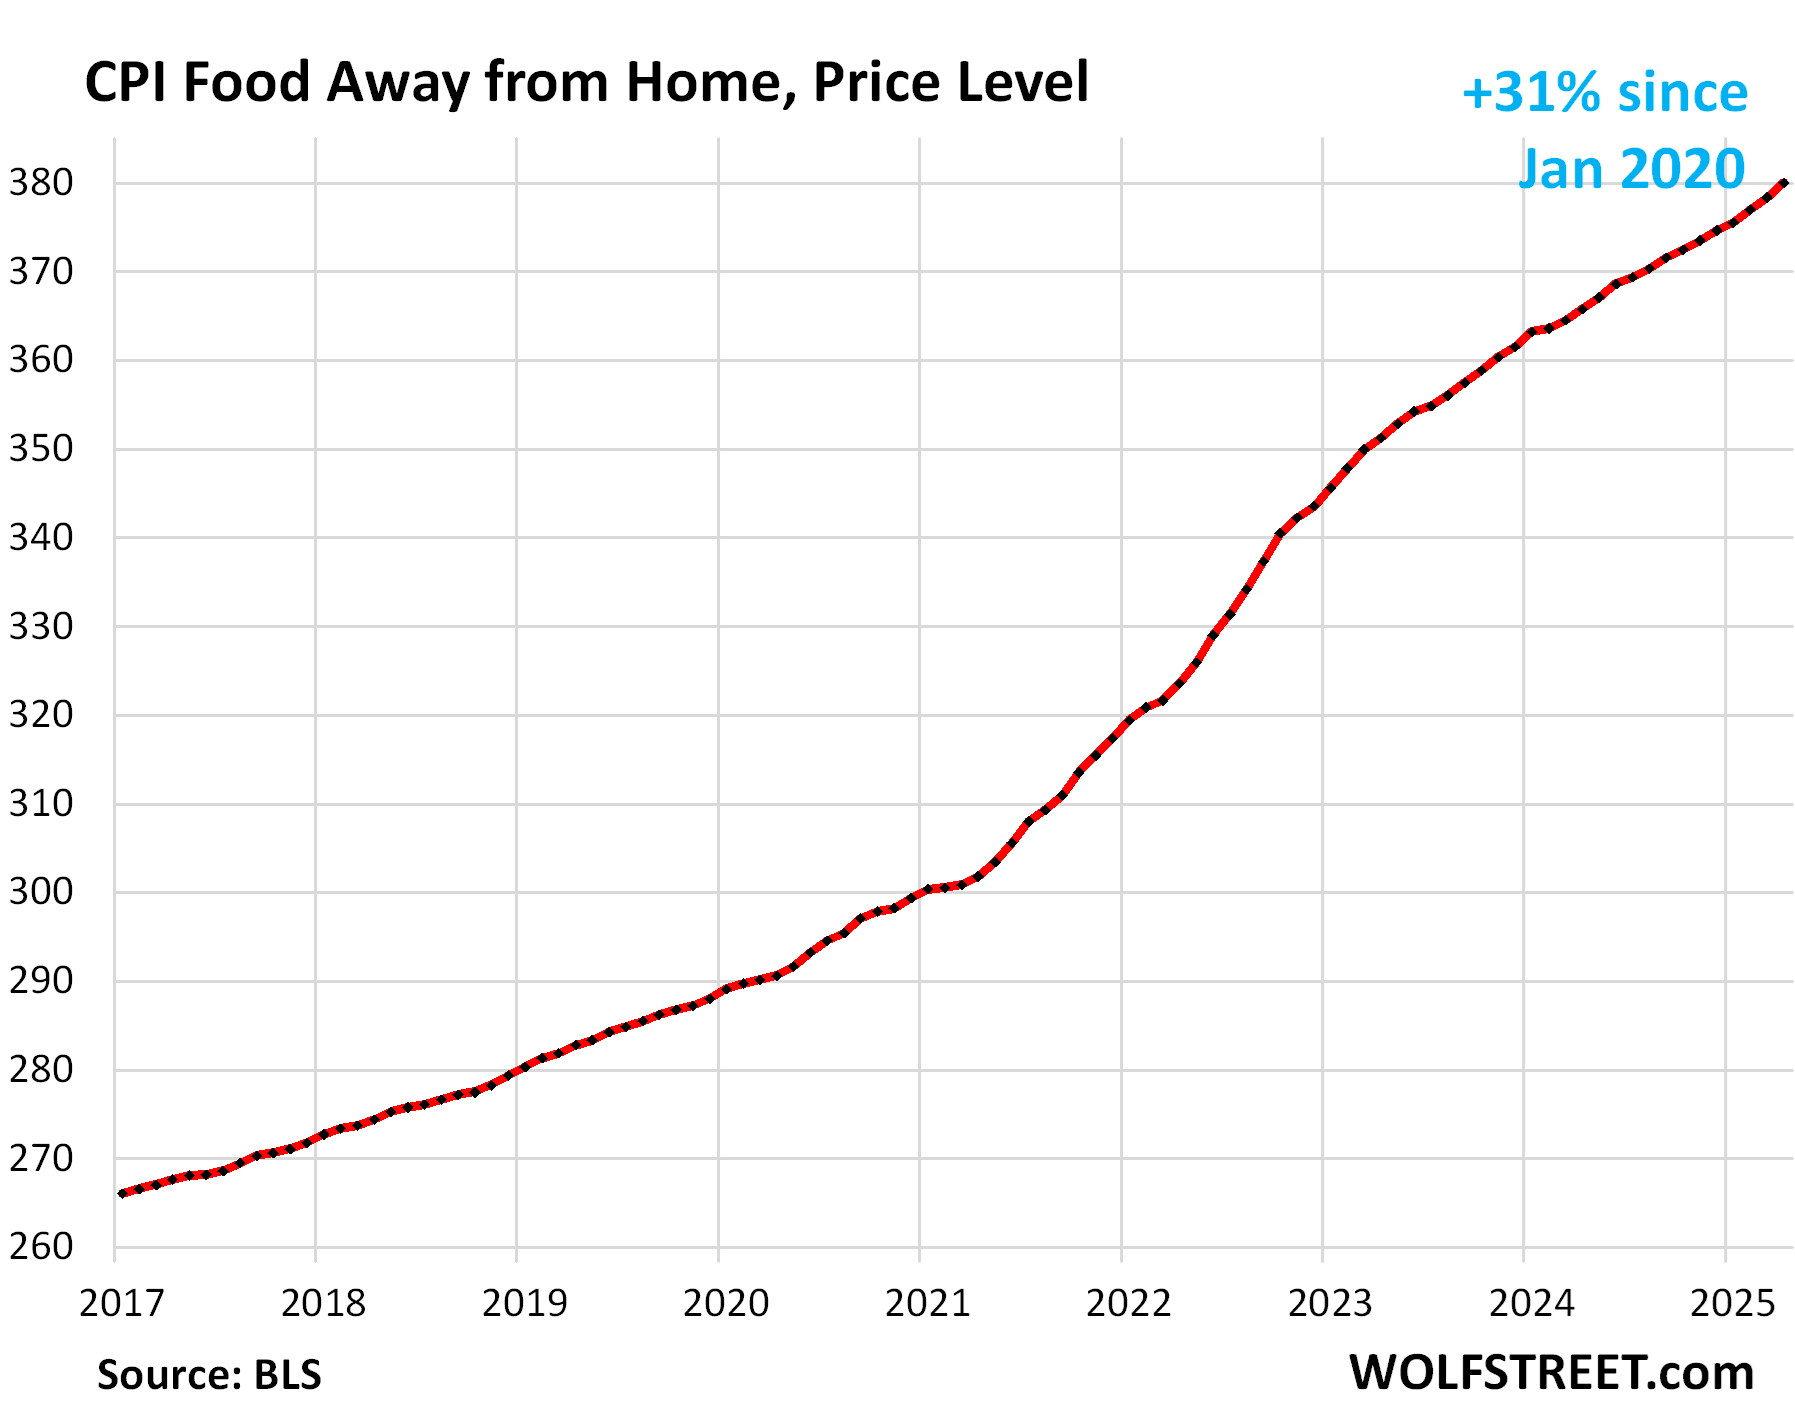
Food away from Home CPI rose by 0.44% (+5.4% annualized) in April from March, the worst increase in 16 months. Year over year, the index accelerated to +3.9%, worst increase since September.
These food services include full-service and limited-service meals and snacks served away from home in restaurants, cafeterias, at stalls, etc.
The table below shows the major categories of “core services.” Combined, they accounted for 64% of total CPI:
| Major Services ex. Energy Services | Weight in CPI | MoM | YoY |
| Core Services | 64% | 0.3% | 3.6% |
| Owner’s equivalent of rent | 26.2% | 0.4% | 4.3% |
| Rent of primary residence | 7.5% | 0.3% | 4.0% |
| Medical care services & insurance | 6.7% | 0.5% | 3.1% |
| Food services (food away from home) | 5.6% | 0.4% | 3.9% |
| Motor vehicle insurance | 2.8% | 0.6% | 6.4% |
| Education (tuition, childcare, school fees) | 2.5% | 0.1% | 3.6% |
| Admission, movies, concerts, sports events, club memberships | 2.1% | -0.2% | 5.1% |
| Other personal services (dry-cleaning, haircuts, legal services…) | 1.6% | 0.2% | 3.9% |
| Public transportation (airline fares, etc.) | 1.5% | -1.8% | -5.6% |
| Telephone & wireless services | 1.5% | 0.0% | 0.0% |
| Lodging away from home, incl Hotels, motels | 1.3% | -0.1% | -1.4% |
| Water, sewer, trash collection services | 1.1% | 0.3% | 4.9% |
| Motor vehicle maintenance & repair | 1.0% | 0.7% | 5.6% |
| Internet services | 0.9% | -1.5% | -2.9% |
| Video and audio services, cable, streaming | 0.8% | -0.6% | 0.6% |
| Pet services, including veterinary | 0.5% | 0.0% | 4.6% |
| Tenants’ & Household insurance | 0.4% | -0.3% | 2.6% |
| Car and truck rental | 0.1% | 4.3% | -2.1% |
| Postage & delivery services | 0.1% | 0.4% | 2.9% |
Prices of Goods.
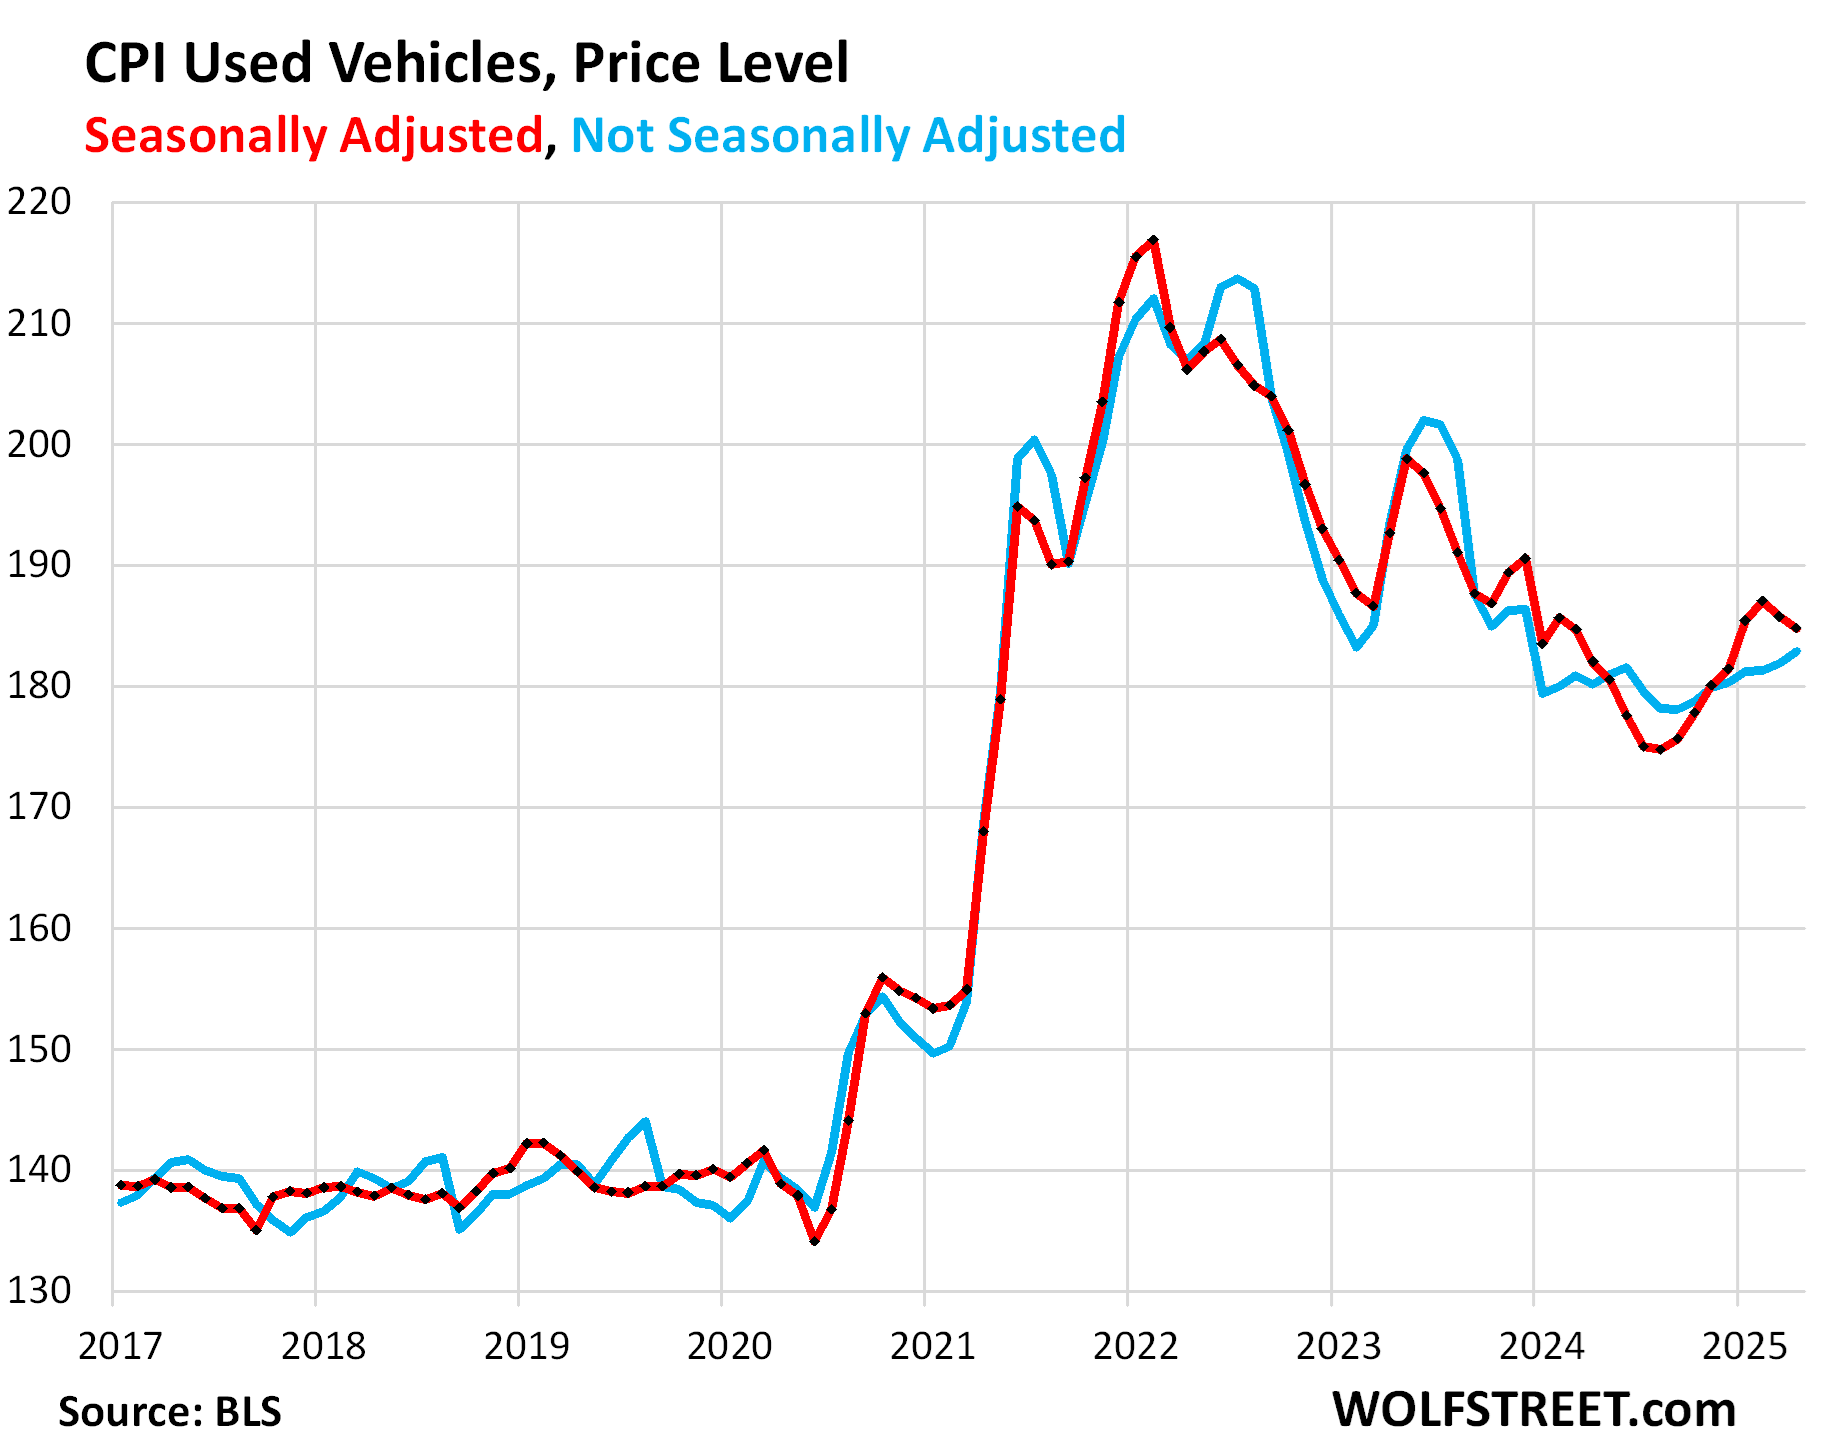
Used vehicle CPI: Not seasonally adjusted, prices continued to rise for the seventh month in a row, but in April, the increase of 0.51% (+6.1% annualized) was smaller than normally in April, and so on a seasonally adjusted basis, the index dipped by 0.53% (-6.2% annualized), the second month in a row of declines.
Year-over-year, used vehicle prices rose by 1.5%, the fourth month in a row of year-over-year increases.
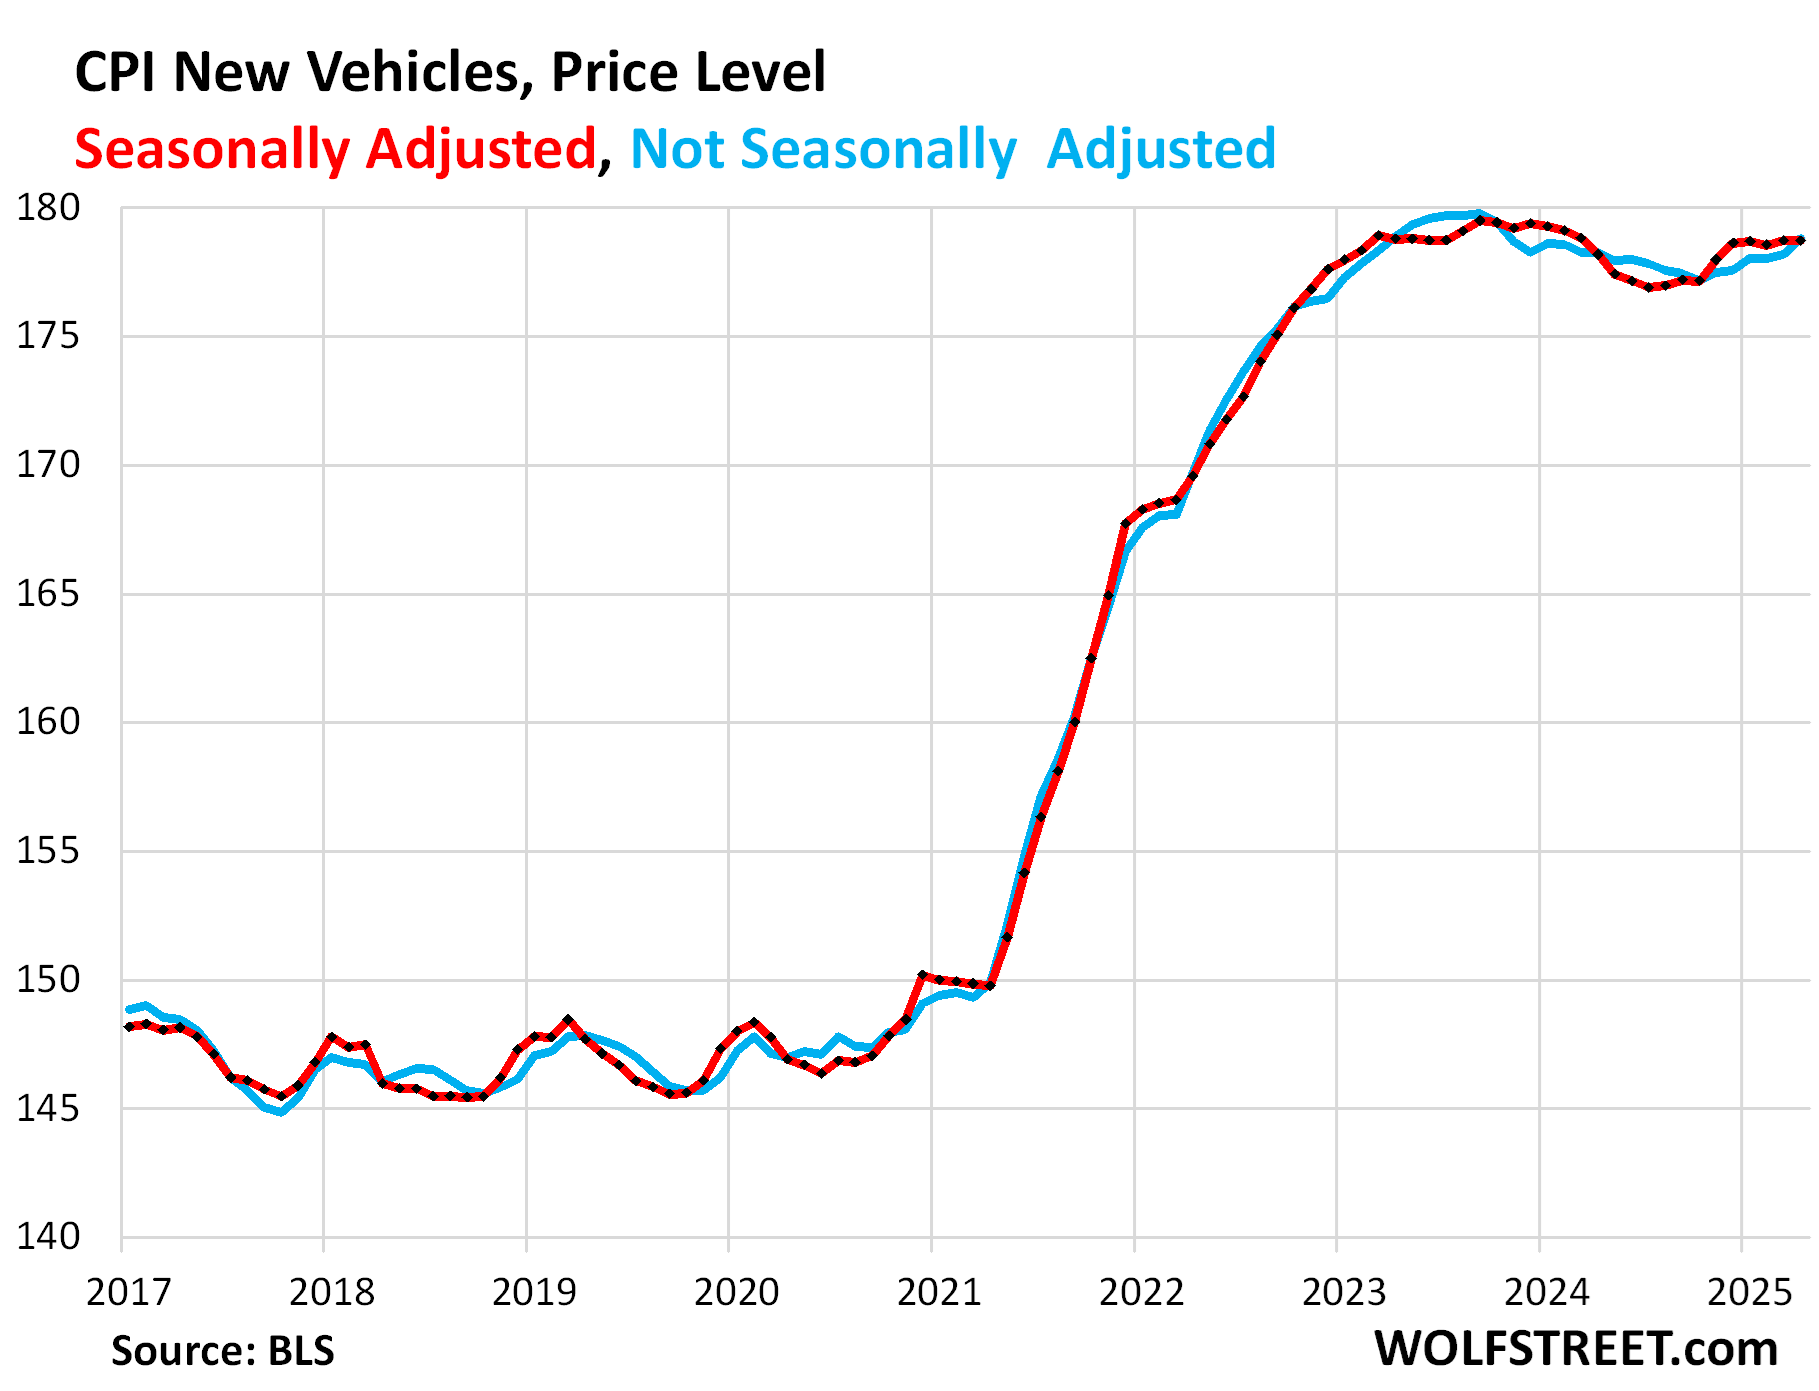
New vehicles CPI, not seasonally adjusted, rose month-to-month by 0.35%, but seasonally adjusted was essentially unchanged.
Year-over-year, the index edged up by 0.3%.
Unlike used vehicle prices, new vehicle prices have been sticky on the way down since the end of the spike in 2022.
Durable Goods overall – dominated by new and used vehicles – experienced a huge spike of inflation from mid-2020 through mid-2022. And then prices declined (deflation) across the board through August 2024. In September 2024, prices began to meander higher, and April was the latest installment in that series. There is so far no sign of tariffs getting passed through to consumers. But the explosion of prices in 2021 and 2022 was historic:
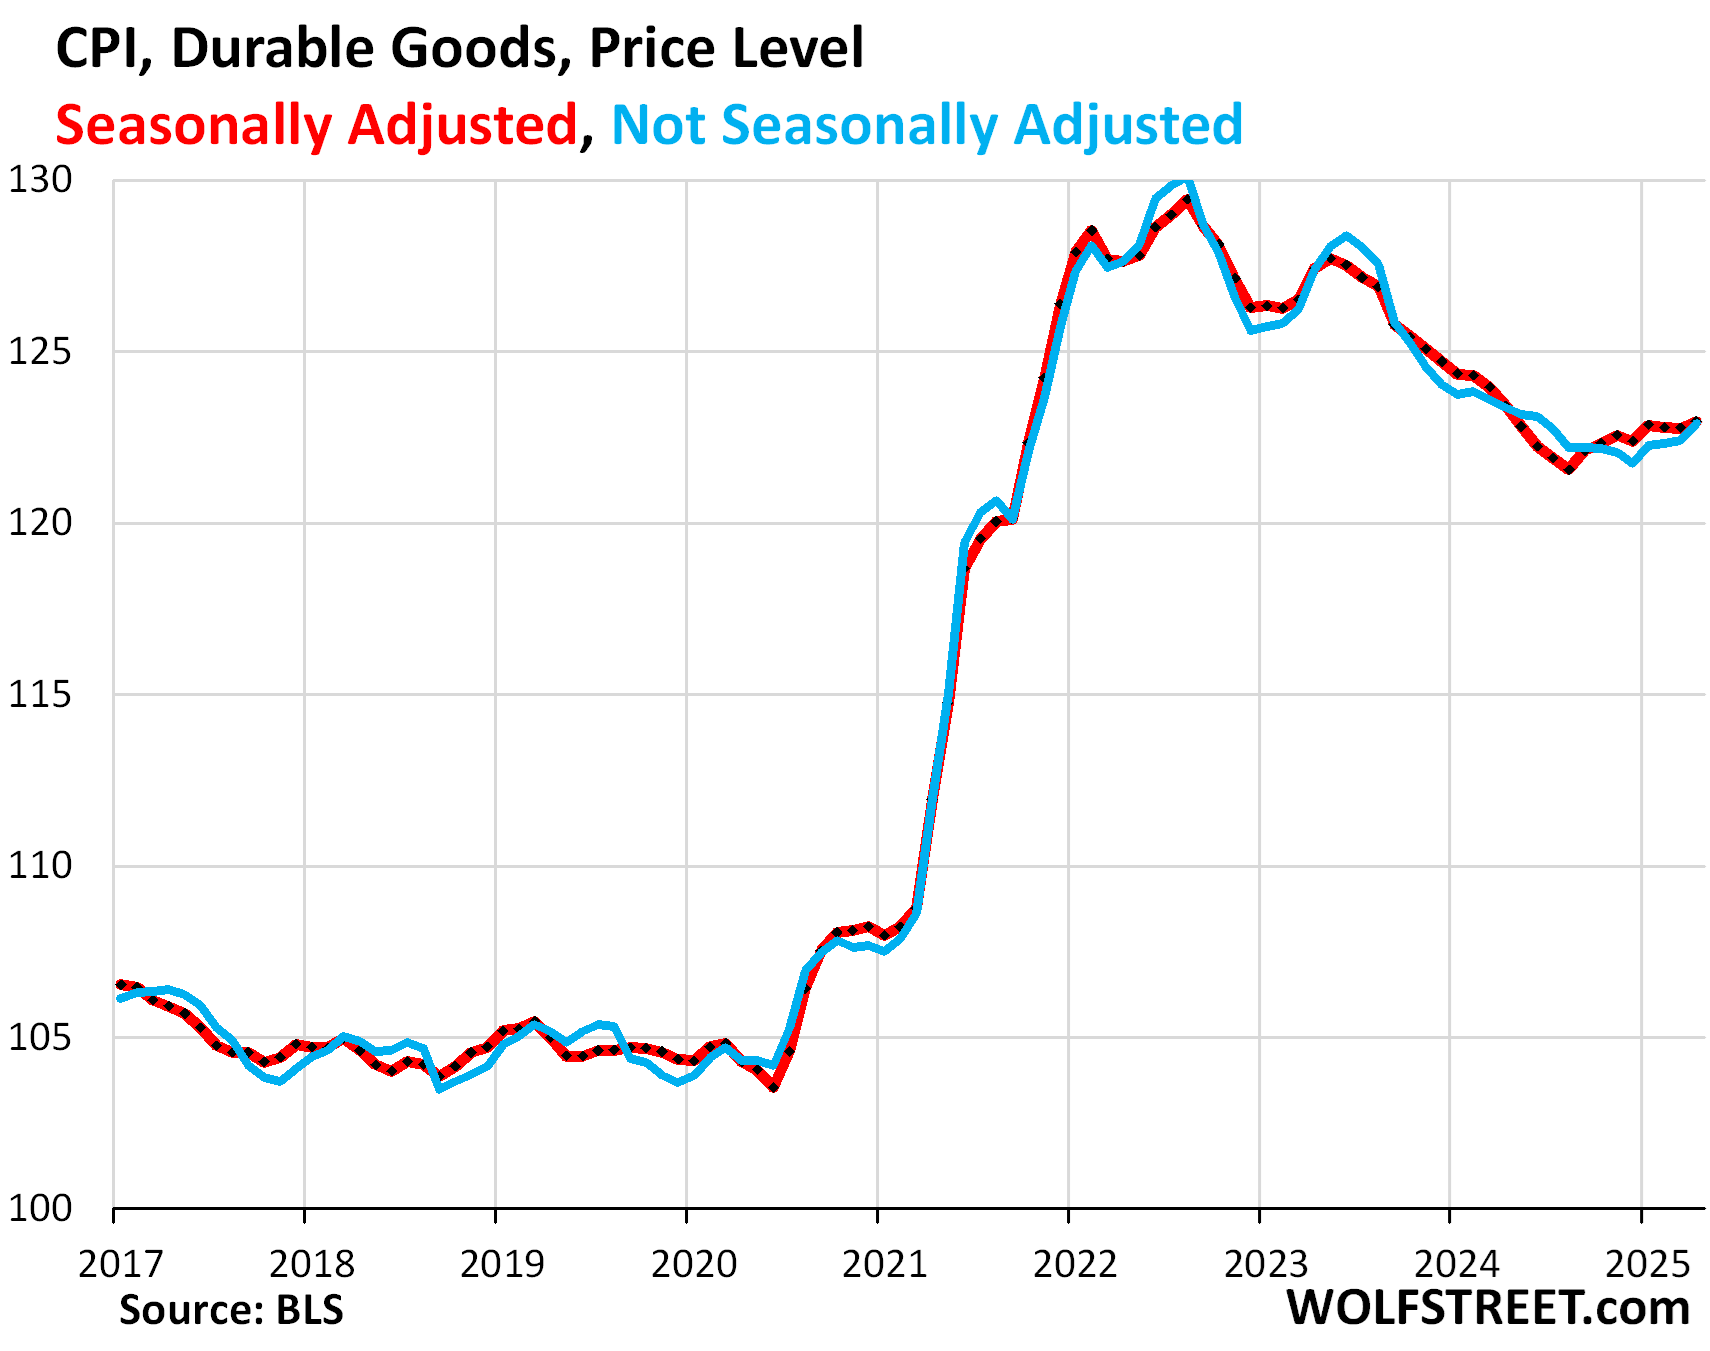
| Major durable goods categories | MoM | YoY |
| Durable goods overall | 0.2% | -0.4% |
| New vehicles | 0.0% | 0.3% |
| Used vehicles | -0.5% | 1.5% |
| Household furnishings (furniture, appliances, floor coverings, tools) | 0.2% | 0.3% |
| Sporting goods (bicycles, equipment, etc.) | 0.6% | -5.2% |
| Information technology (computers, smartphones, etc.) | 0.3% | -6.8% |
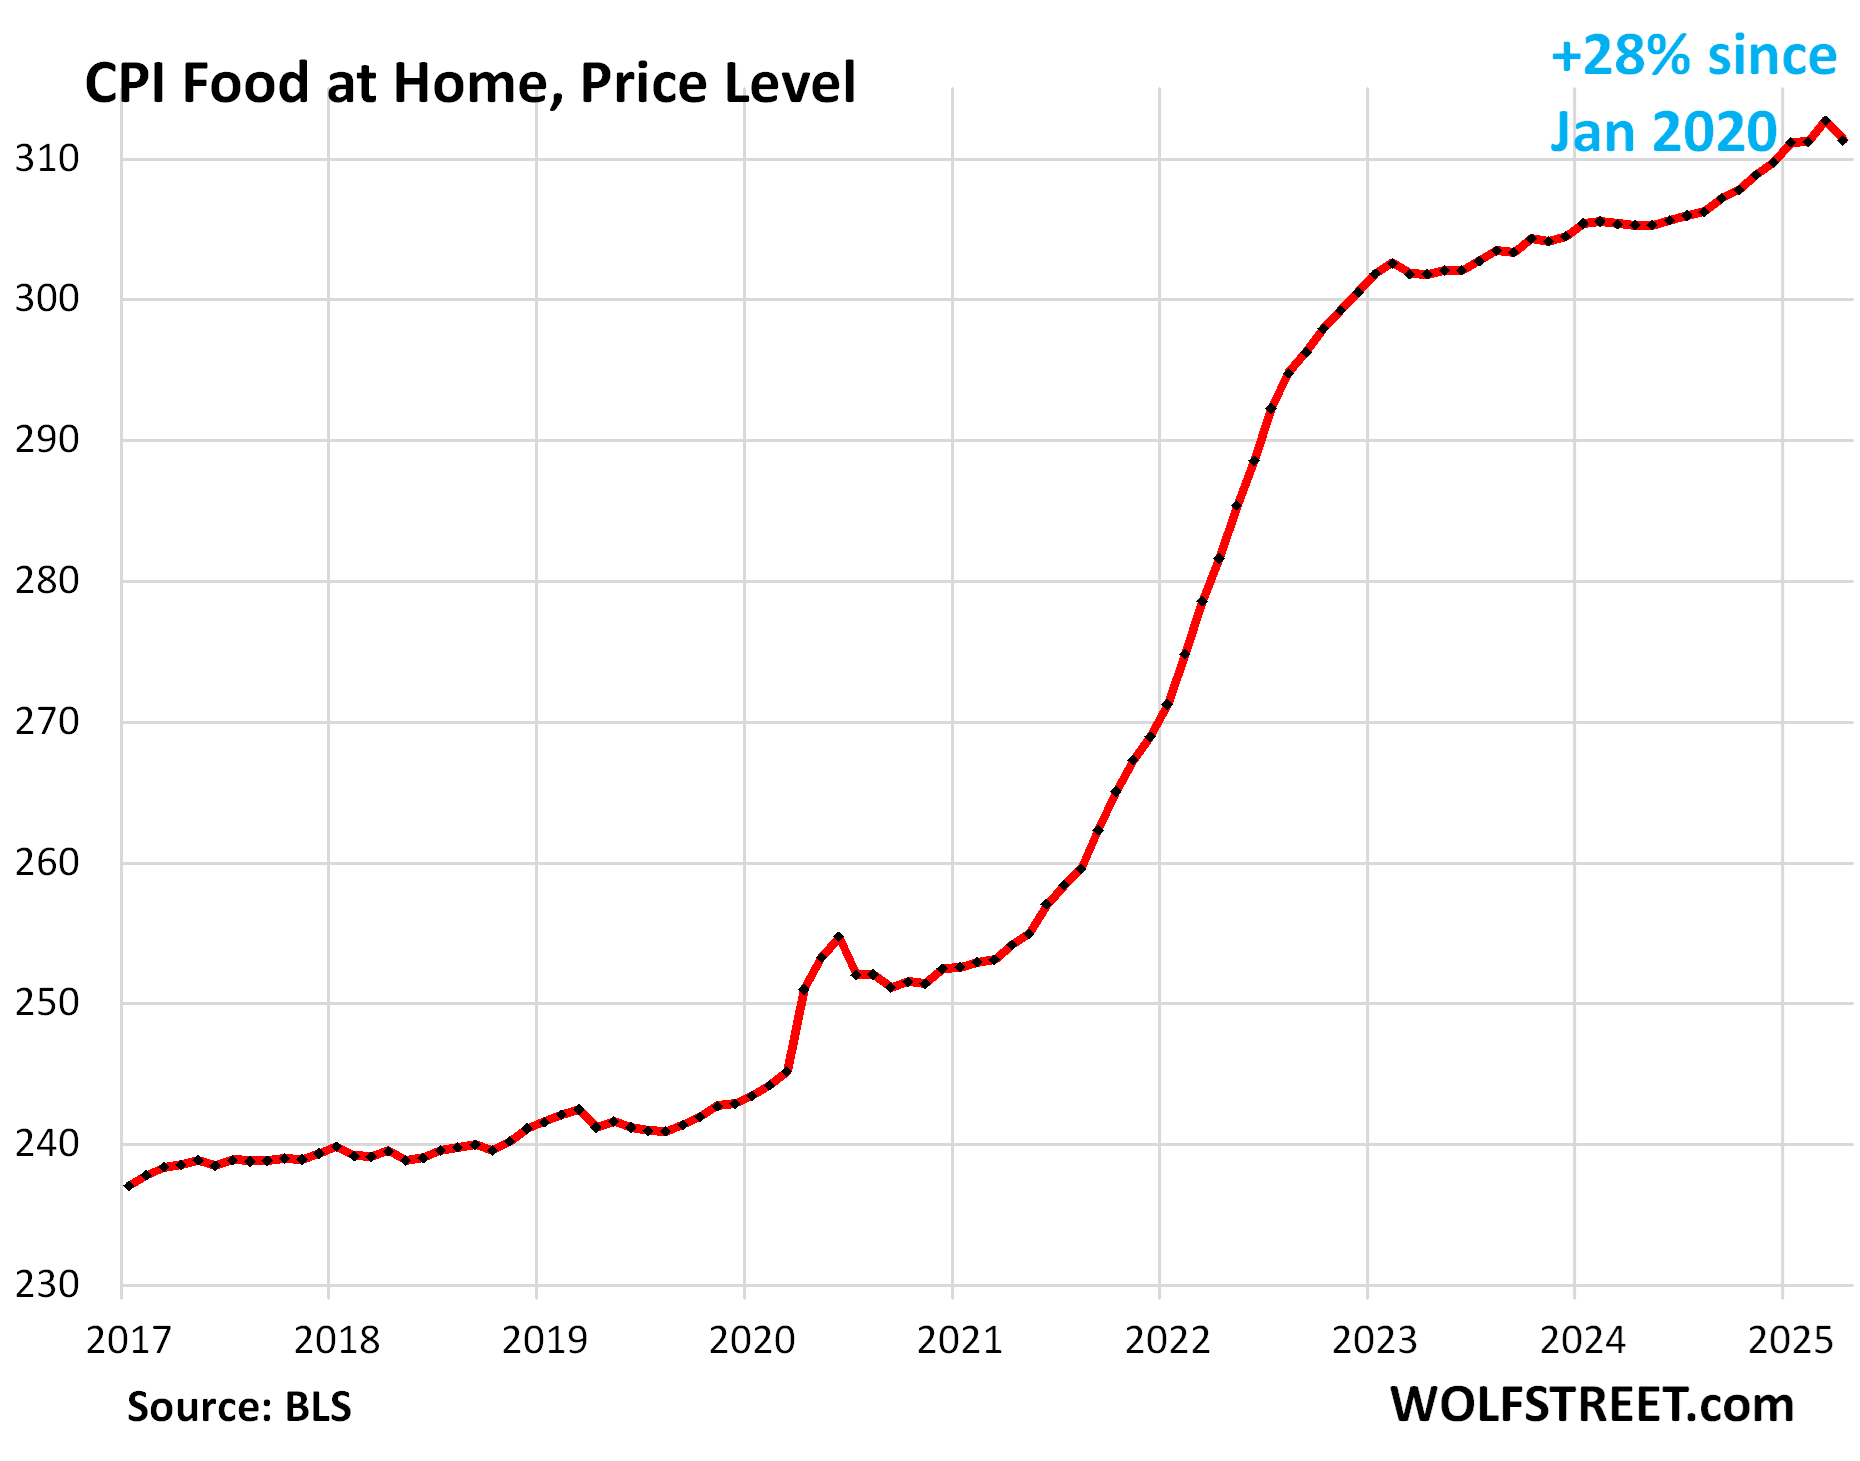
Food Inflation. The CPI for “Food at home” fell by 0.44% month-to-month (-5.2% annualized), driven by plunging egg prices, after the jump in March (worst since October 2022).
Year-over-year, the index rose by 2.0%. Since January 2020, food prices have surged by 28%. This is food purchased at stores and markets to be eaten off premises.
| MoM | YoY | |
| Food at home | -0.4% | 2.0% |
| Cereals, breads, bakery products | -0.5% | 0.0% |
| Beef and veal | 0.1% | 8.5% |
| Pork | -1.4% | 1.3% |
| Poultry | 0.2% | 2.4% |
| Fish and seafood | 0.7% | 0.7% |
| Eggs | -12.7% | 49.3% |
| Dairy and related products | -0.2% | 1.6% |
| Fresh fruits | -0.4% | -0.9% |
| Fresh vegetables | -0.1% | -2.9% |
| Juices and nonalcoholic drinks | 0.2% | 1.8% |
| Coffee, tea, etc. | 2.0% | 6.6% |
| Fats and oils | -1.5% | -1.6% |
| Baby food & formula | 0.9% | 1.2% |
| Alcoholic beverages at home | -0.1% | 0.8% |
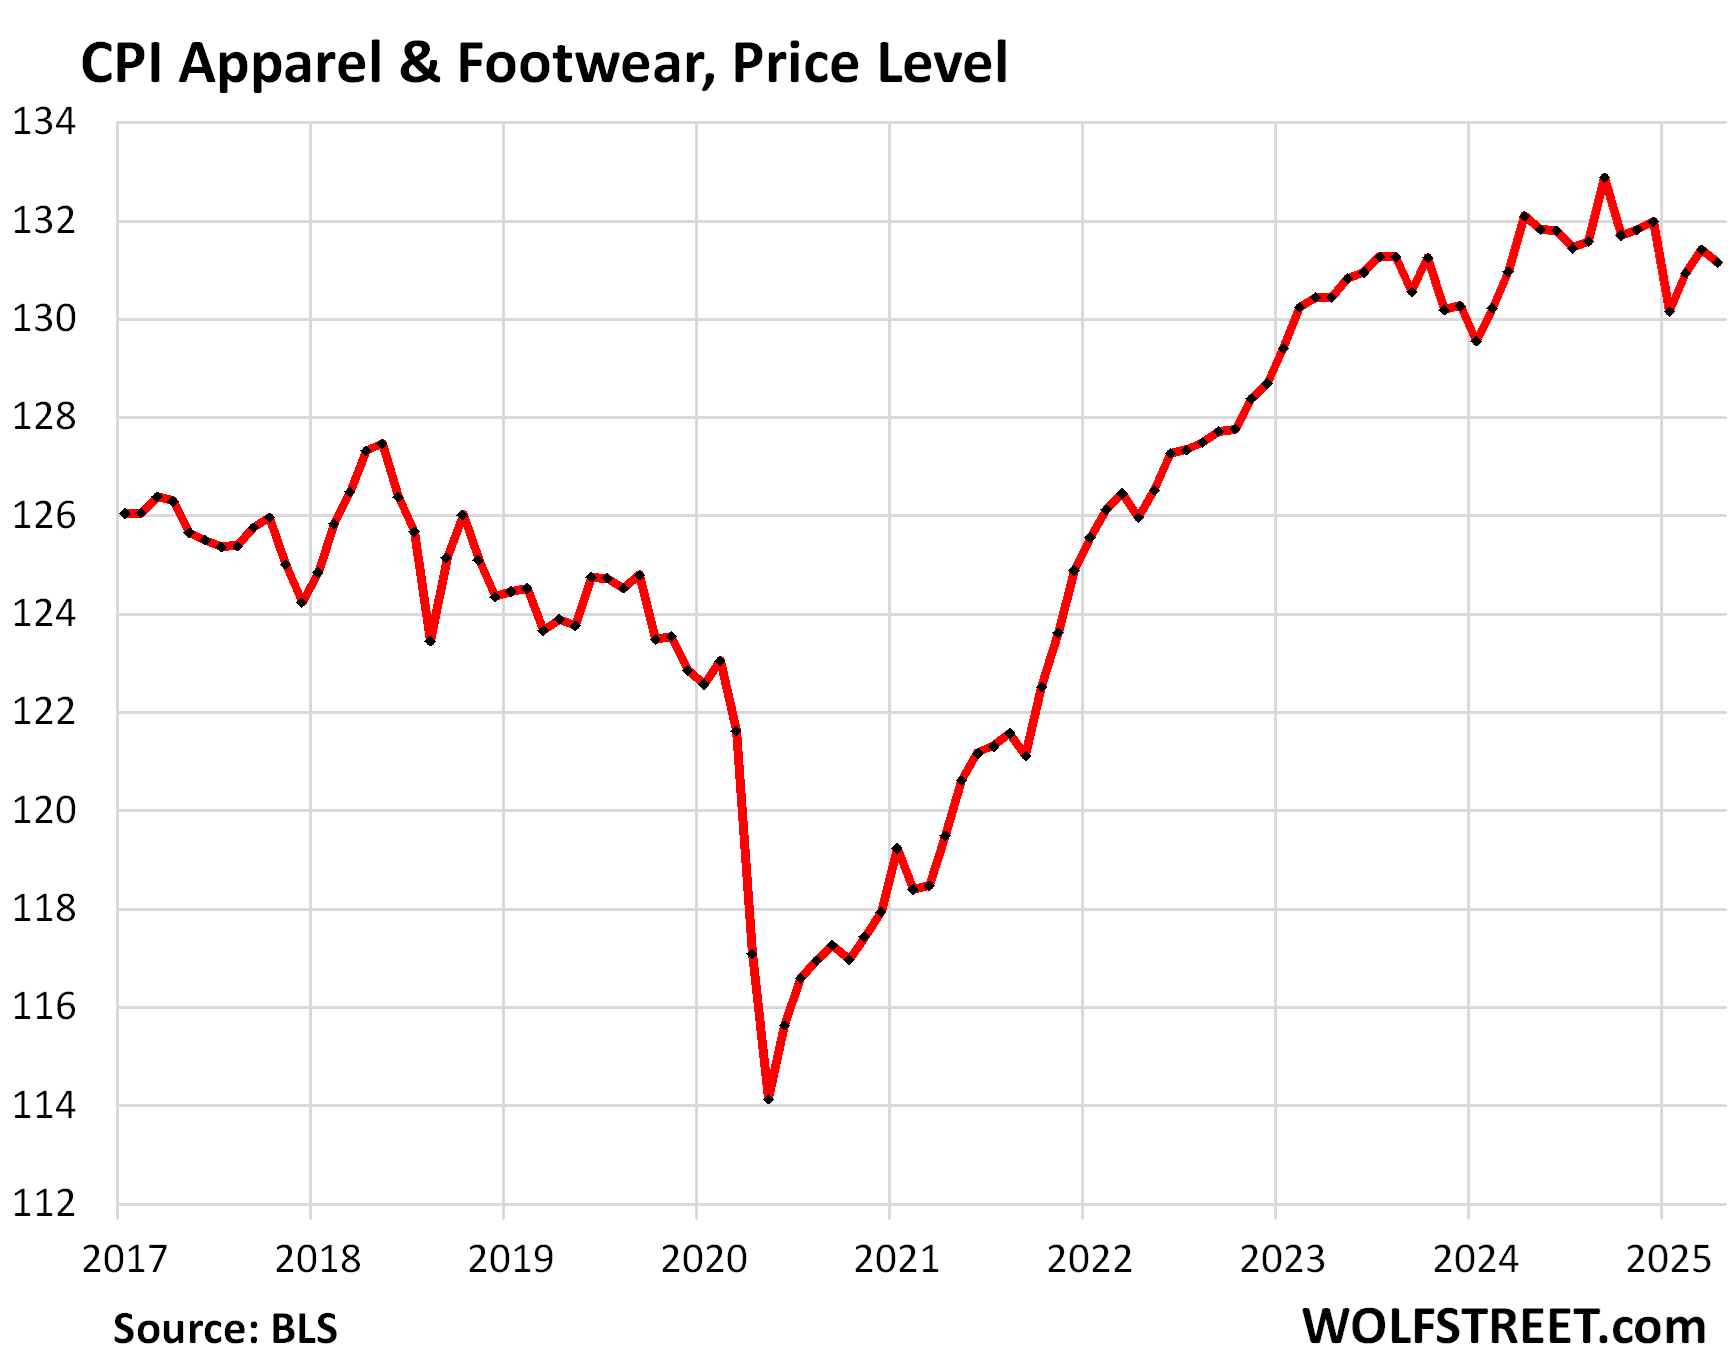
Apparel and footwear. The CPI for apparel and footwear, despite the manipulative fearmongering in the media about tariffs, fell by 0.2% month-to-month and was down by 0.7% year-over-year.
Energy.
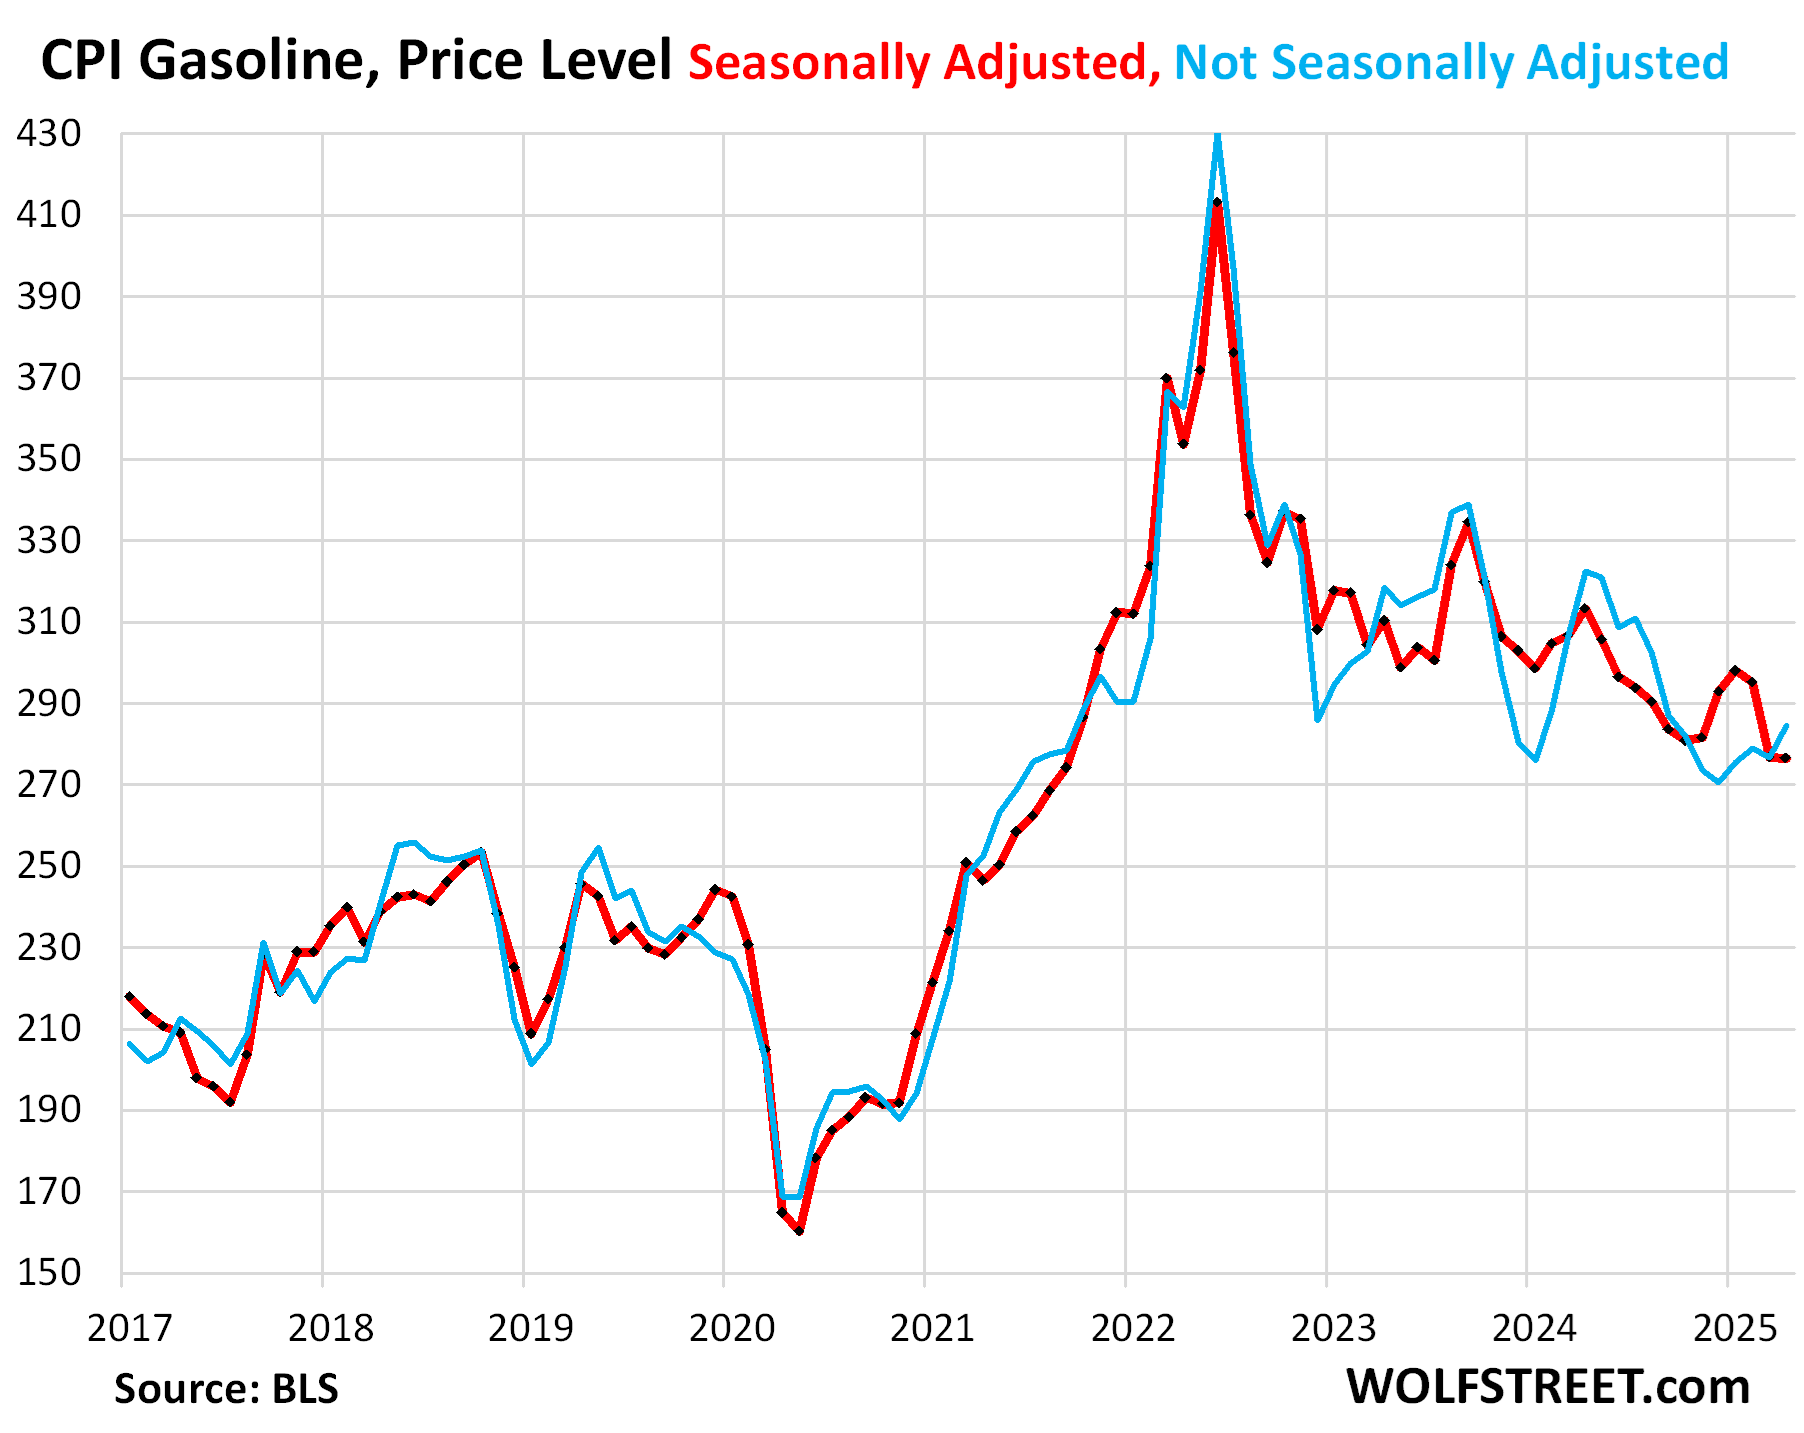
The CPI for gasoline, not seasonally adjusted, rose in April from March, but it normally rises about that much in April, and so on a seasonally adjusted basis, the index was roughly unchanged and remained at the lowest price level since September 2021.
Year-over-year, the gasoline index plunged by 11.8%. The driver has been the drop in oil prices. Gasoline makes up about half of the overall energy CPI.
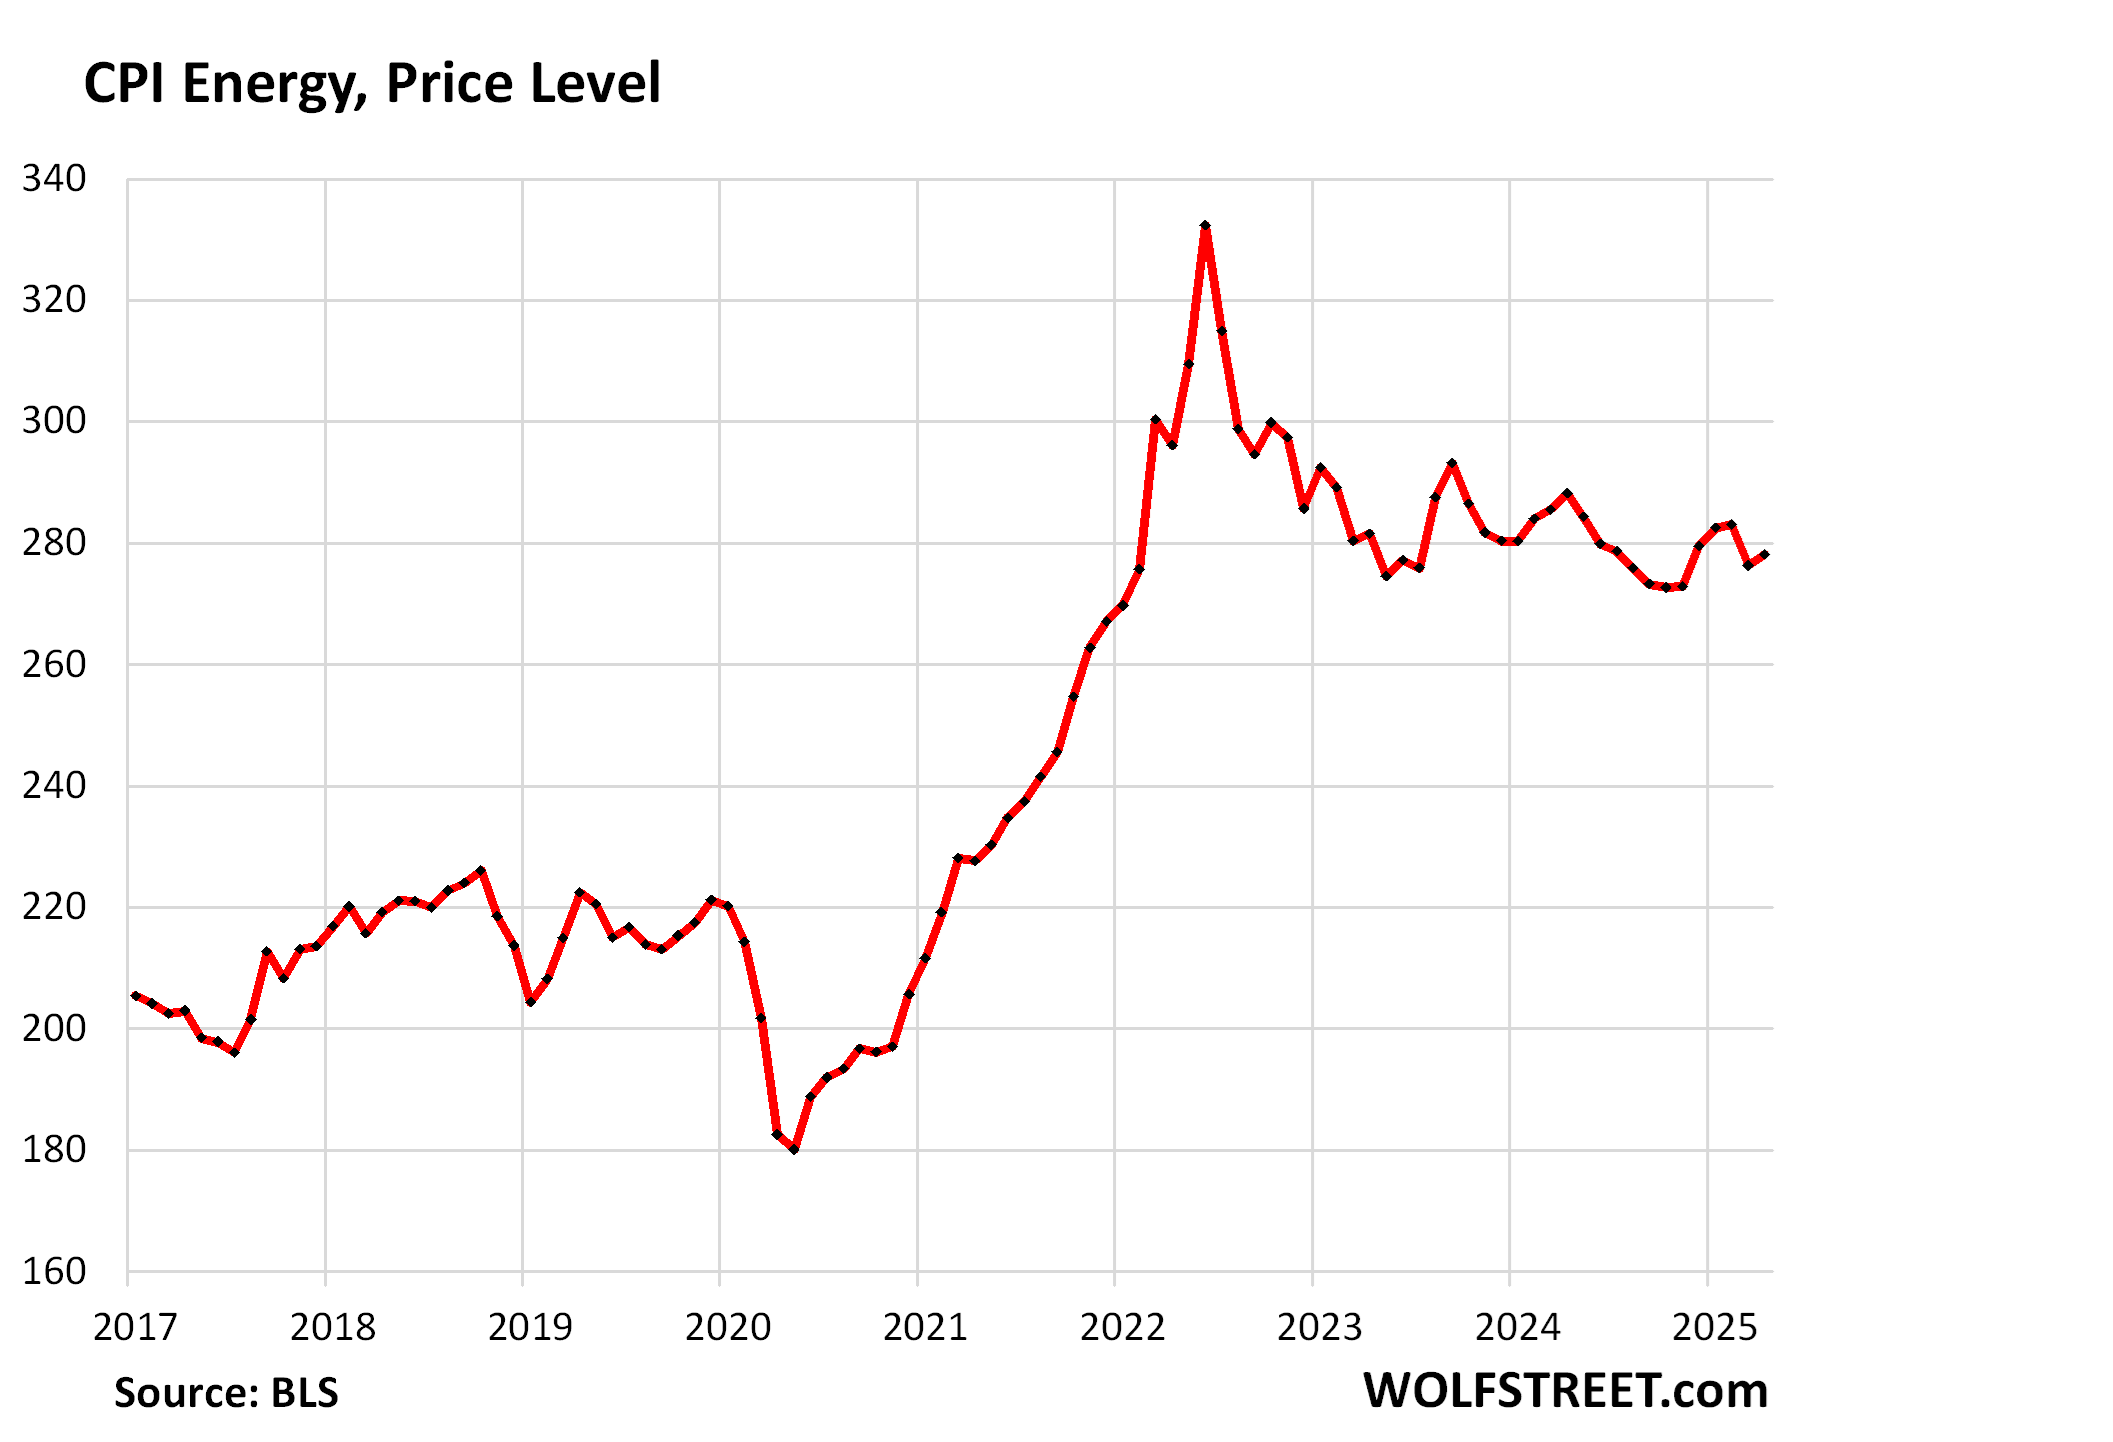
The CPI for energy jumped by 0.67% month-to-month, seasonally adjusted, driven by the surge in prices of utility natural gas and electricity service.
On a year-over-year basis, the index fell by 3.7%. Despite some ups and downs, the index has essentially been flat for two years (see chart below).
| CPI for Energy, by Category | MoM | YoY |
| Overall Energy CPI | 0.7% | -3.7% |
| Gasoline | -0.1% | -11.8% |
| Electricity service | 0.8% | 3.6% |
| Utility natural gas to home | 3.7% | 15.7% |
| Heating oil, propane, kerosene, firewood | -2.6% | -7.2% |
Enjoy reading WOLF STREET and want to support it? You can donate. I appreciate it immensely. Click on the mug to find out how:

![]()
The post Beneath the Skin of CPI Inflation: Services Inflation Bounces Back, No Signs yet of Tariffs Getting Passed to Consumers appeared first on Energy News Beat.