Energy News Beat
The 3-year 50% price explosion has caused epic demand destruction. Prices are way too high. But mortgage rates are back in the historically normal range above 6%.
By Wolf Richter for WOLF STREET.
The feverishly anticipated spring selling season is starting out as a dud. Sales of existing homes – single-family houses, townhouses, condos, and co-ops – that closed in March fell by 3.1% from the already frozen volume a year ago to 315,000 deals, not seasonally adjusted, down by 31% from March 2022, which was when home sales began to plunge after prices had spiked in many markets by 50% or more in just three years, to ridiculous levels, thereby destroying demand.
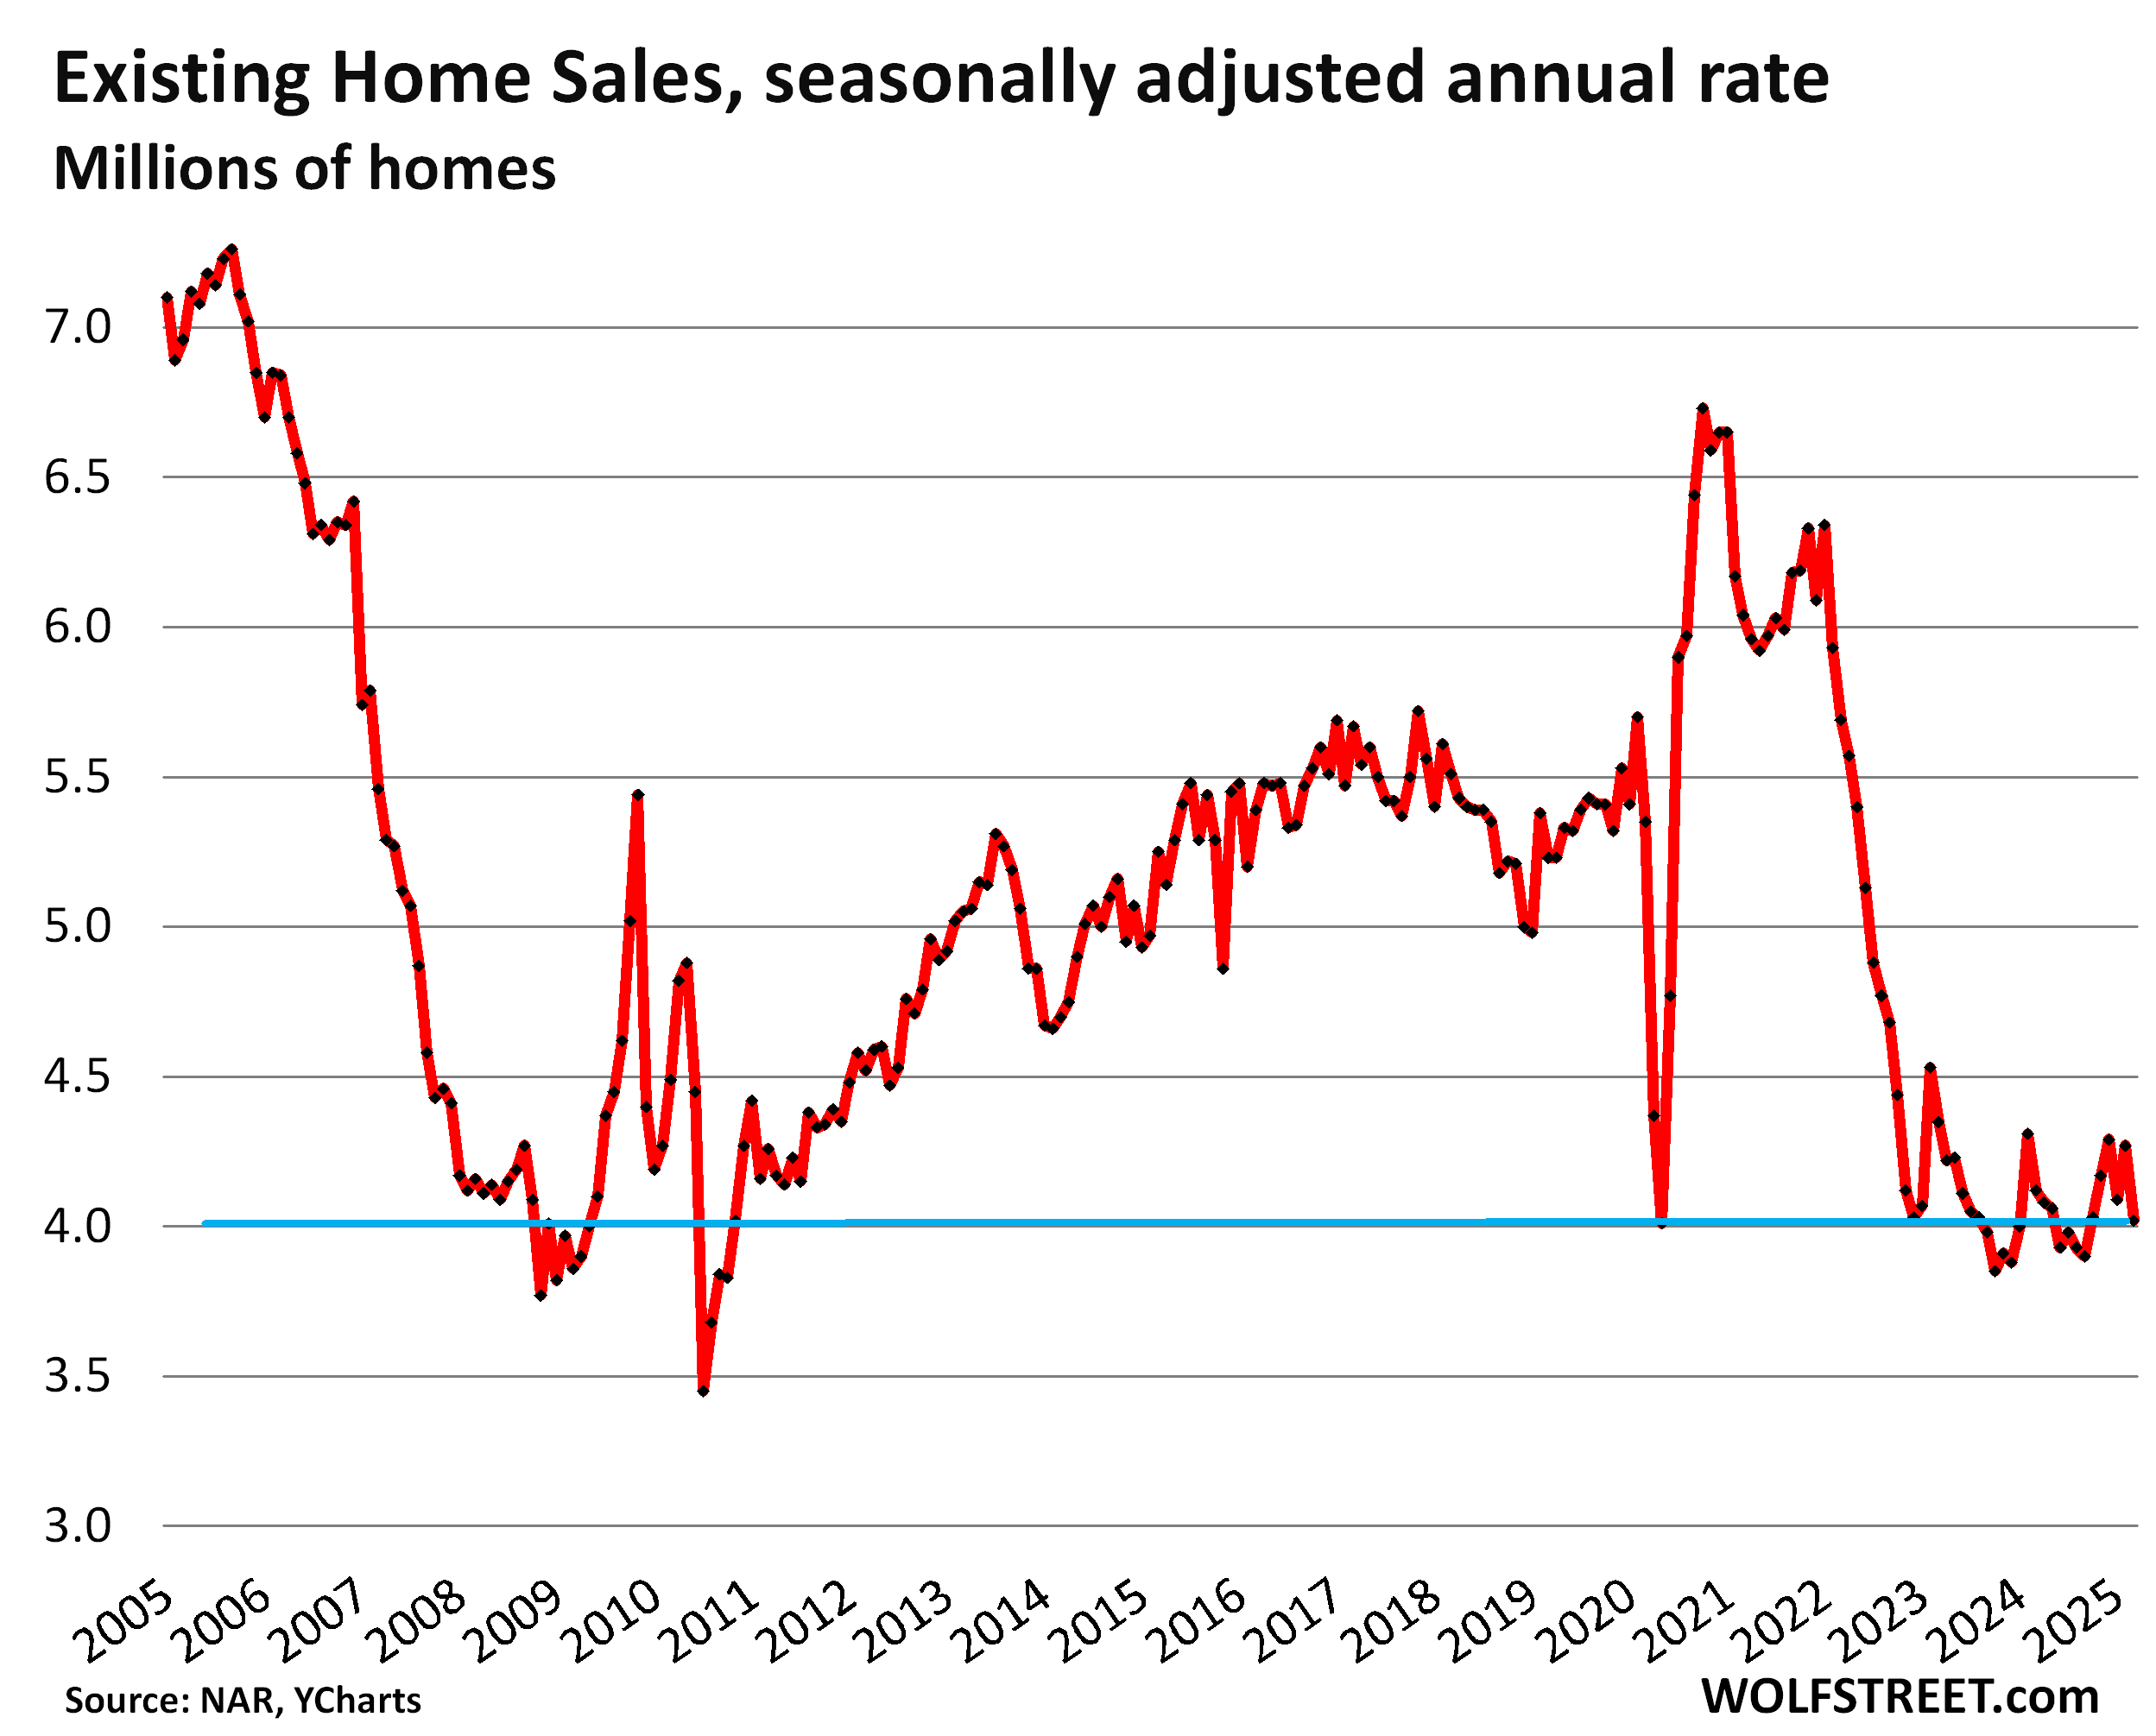
Demand destruction on display: The seasonally adjusted annual rate of sales of existing homes fell by 5.9% in March from February, and by 2.4% year-over-year, to a rate of 4.02 million, the worst March since 2009, according to the National Association of Realtors today. From the Marches in prior years (historical data from YCharts):
- 2024: -2.4%
- 2023: -7.6%
- 2022: -29.3%
- 2019: -23.1%
- 2018: -27.0%
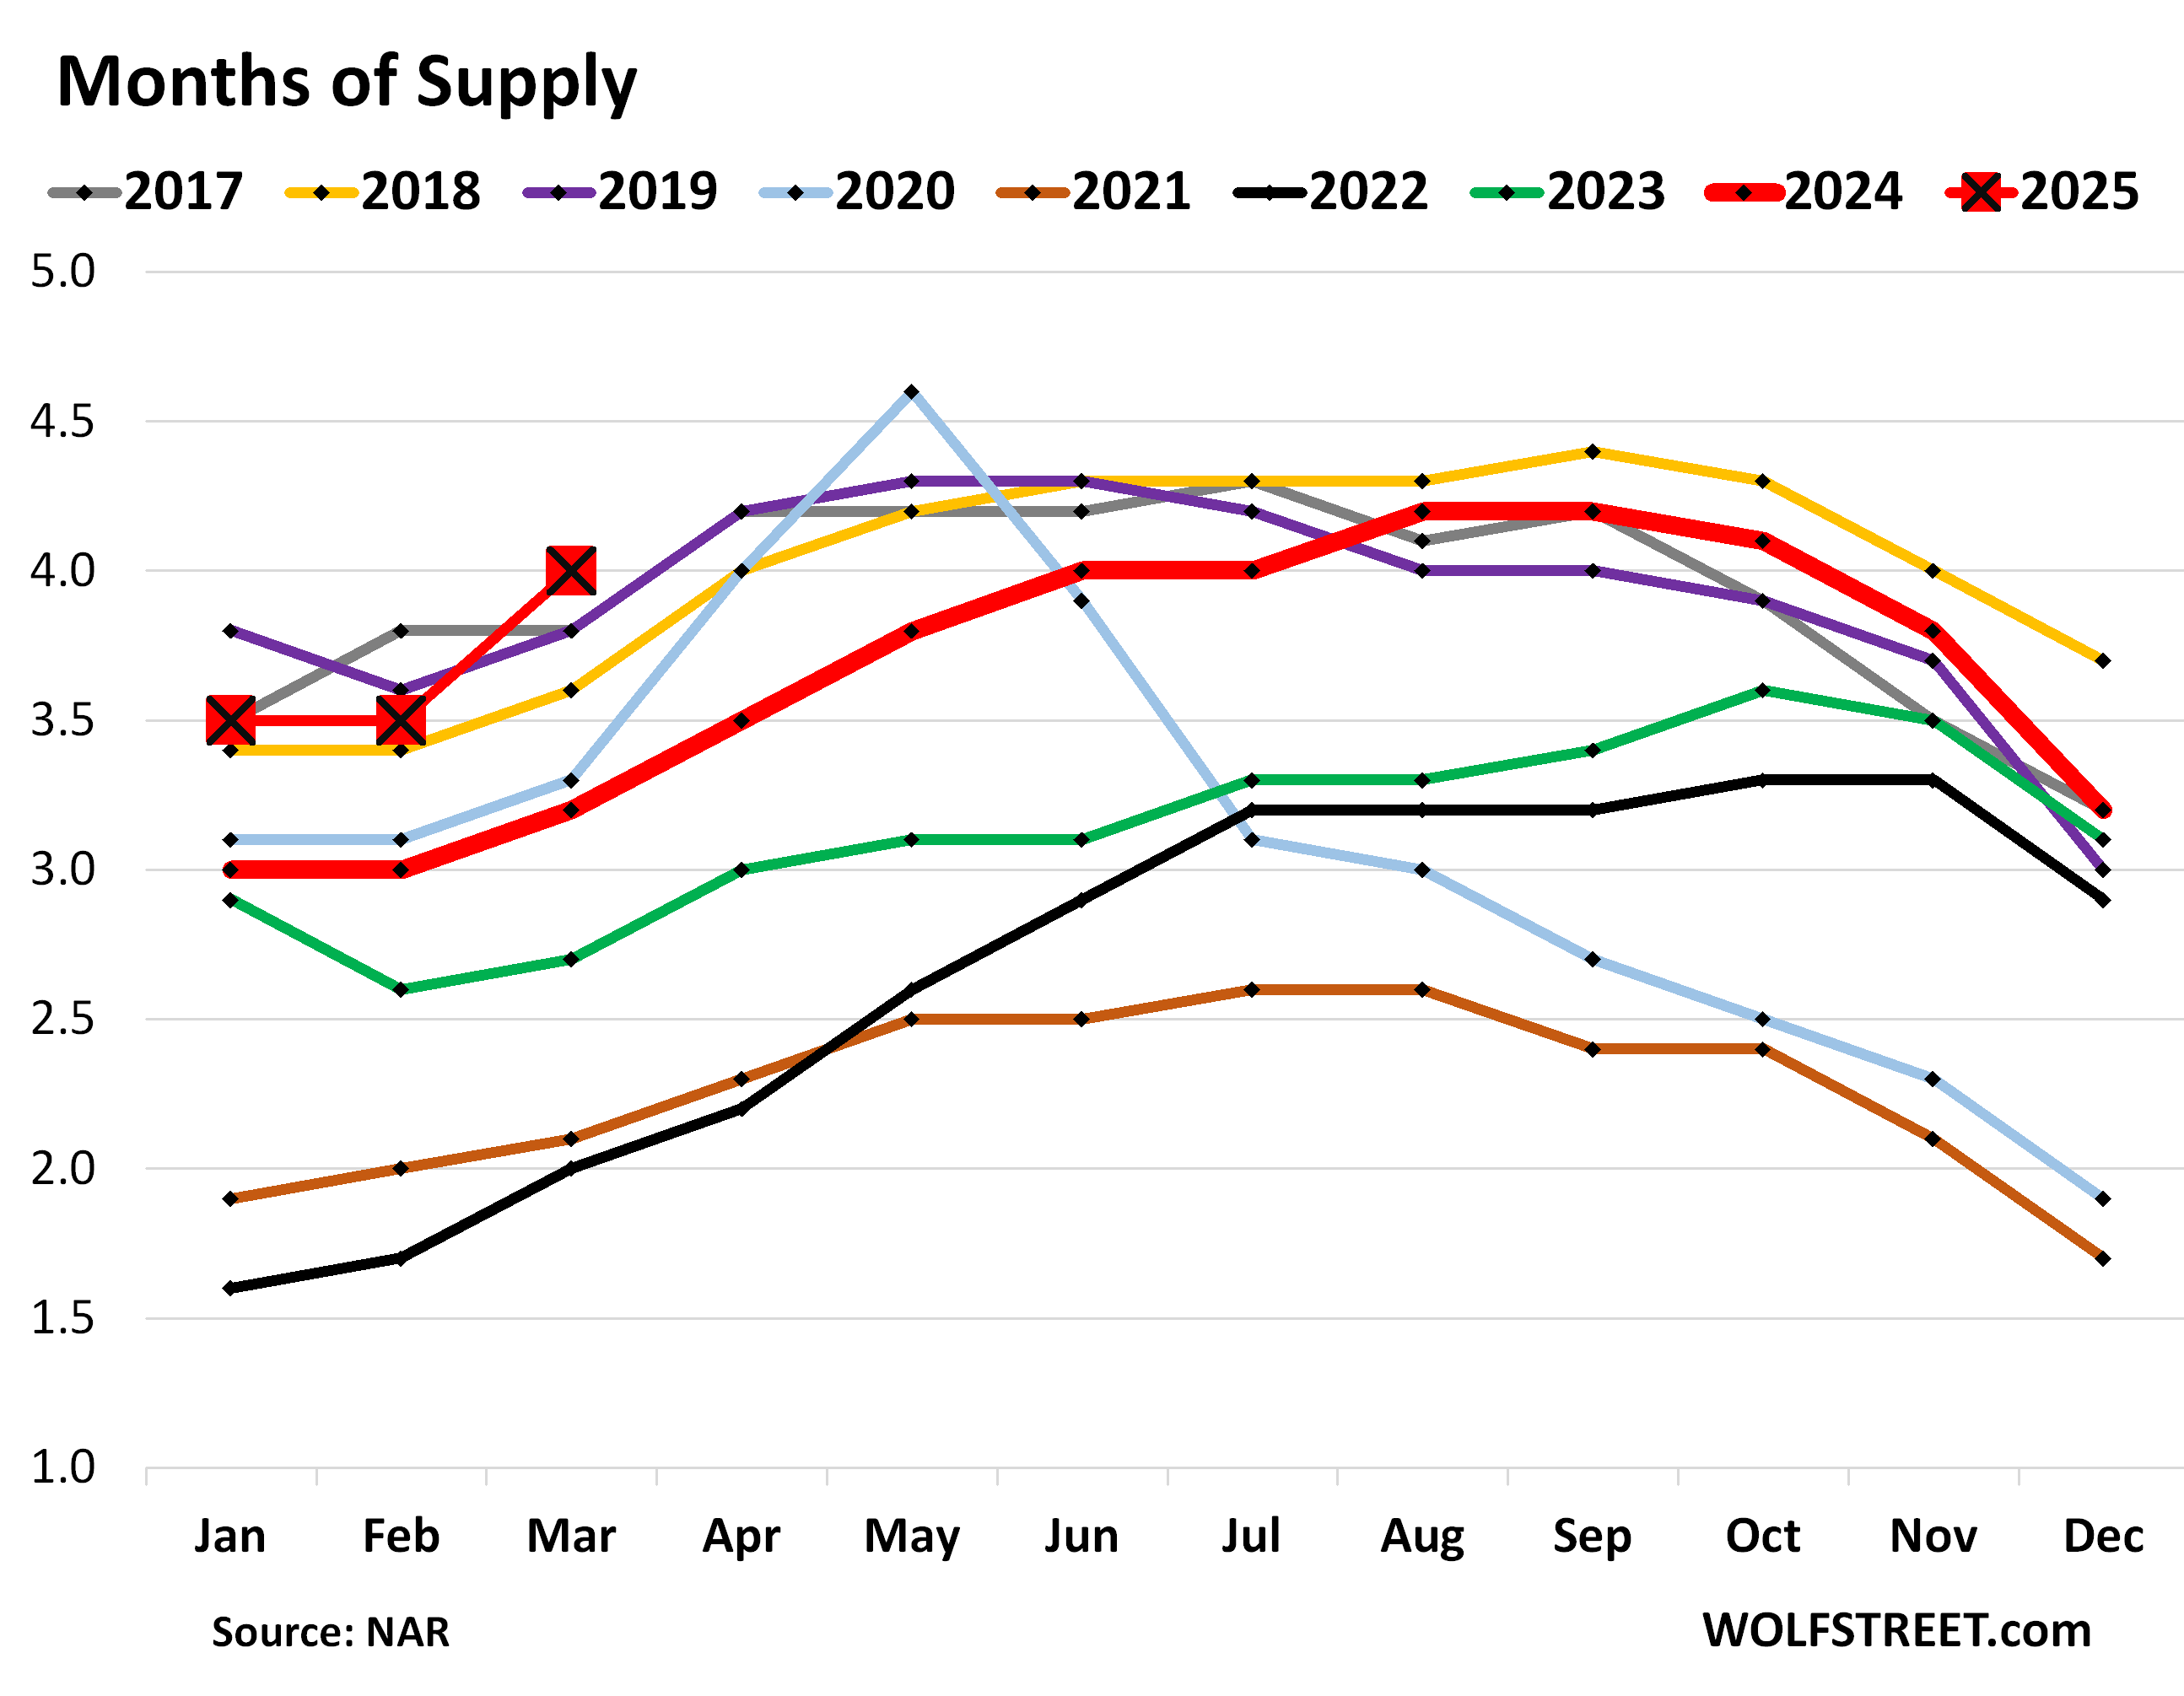
Highest supply for March since 2016.
Inventory of homes listed for sale jumped by 100,000 homes, or by 8.1%, in March from February, and by 20% year-over-year, to 1.33 million listings. This increase in inventory occurred even as buyers were on strike because prices are too high.
Supply of unsold homes on the market, amid these inventory levels and demand destruction, jumped to 4.0 months at the March rate of sales, the highest supply for any March since 2016. The months of 2025 are shown as the red squares:
Demand destruction by region.
The charts below show the seasonally adjusted annual rate of sales (SAAR) in the four Census Regions of the US. A map of the four regions is in the comments below the article.
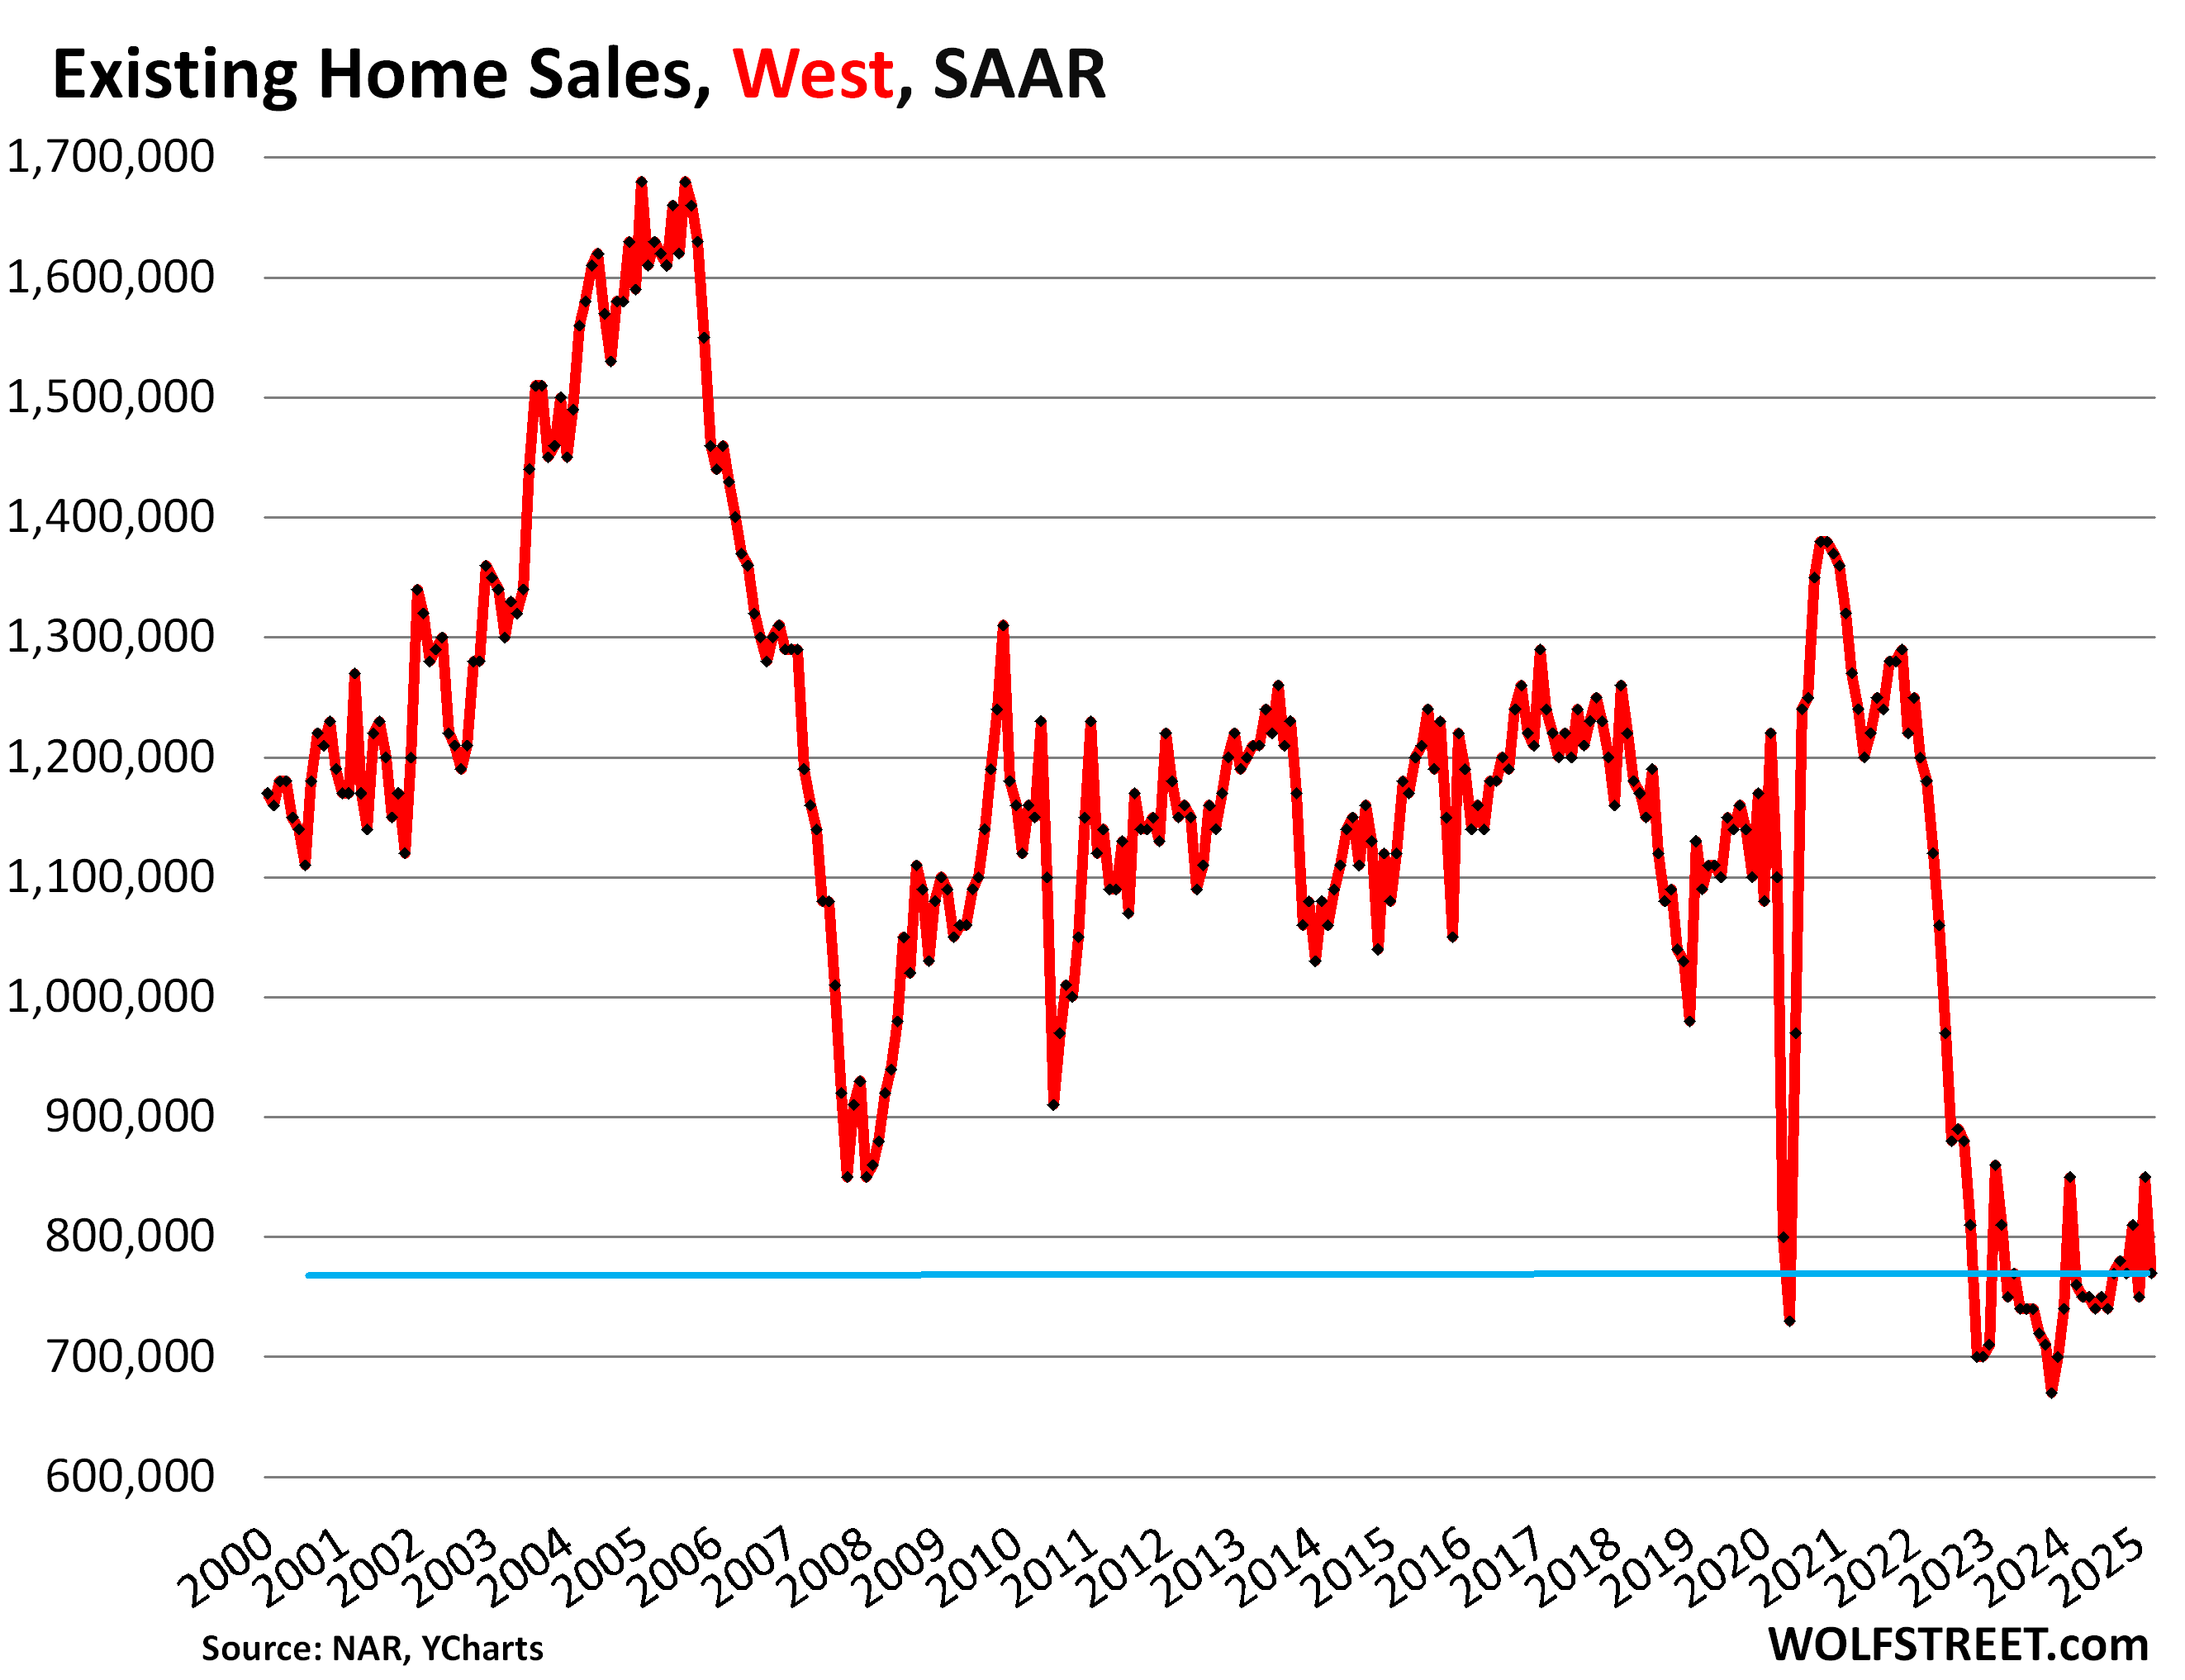
In the West, the seasonally adjusted annual rate of sales fell to 770,000 homes in March from 850,000 in February. But that was still up by 1.3% from the abysmal sales in March last year, and both were the worst Marches in the data going back to the 1990s. Compared to prior years:
| West, compared to March: | |
| 2024 | 1.3% |
| 2023 | -4.9% |
| 2022 | -34.7% |
| 2019 | -29.4% |
| 2018 | -36.9% |
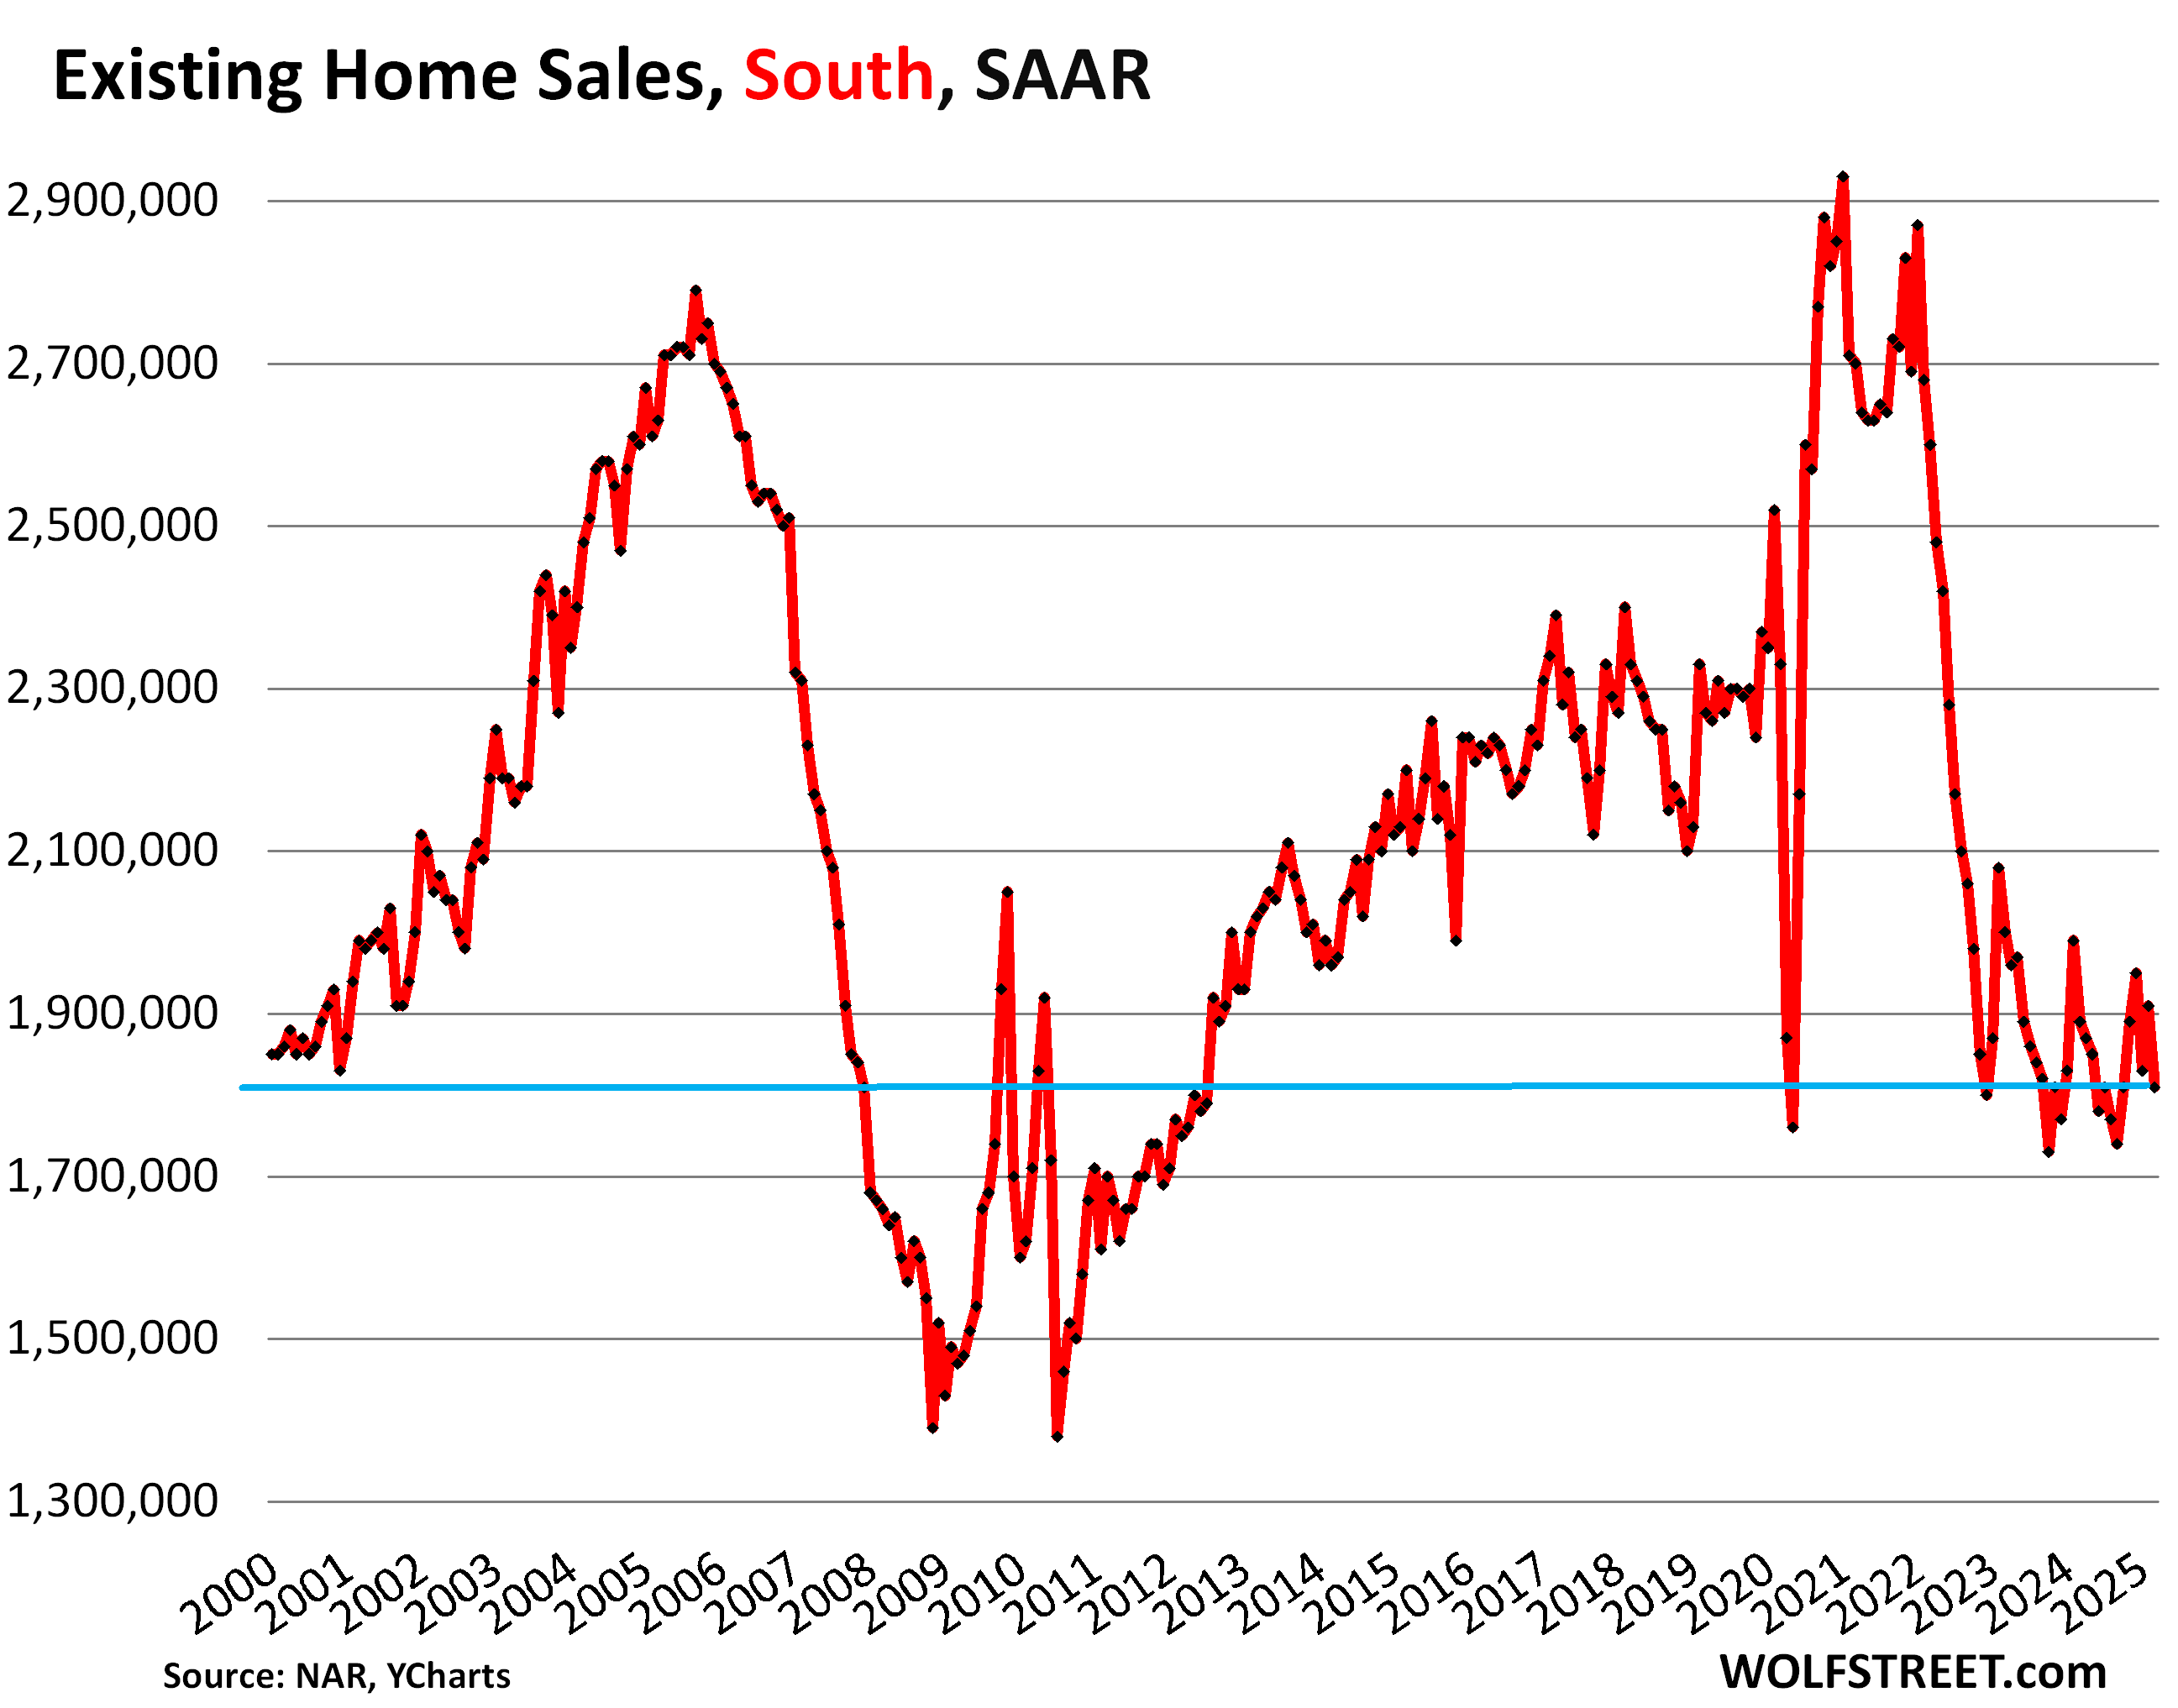
In the South, the seasonally adjusted annual rate of sales fell to 1.81 million in March, from 1.91 million in February, the worst March since 2012. Compared to prior years:
| South, compared to March: | |
| 2024 | -4.2% |
| 2023 | -9.5% |
| 2022 | -30.4% |
| 2019 | -20.3% |
| 2018 | -22.3% |
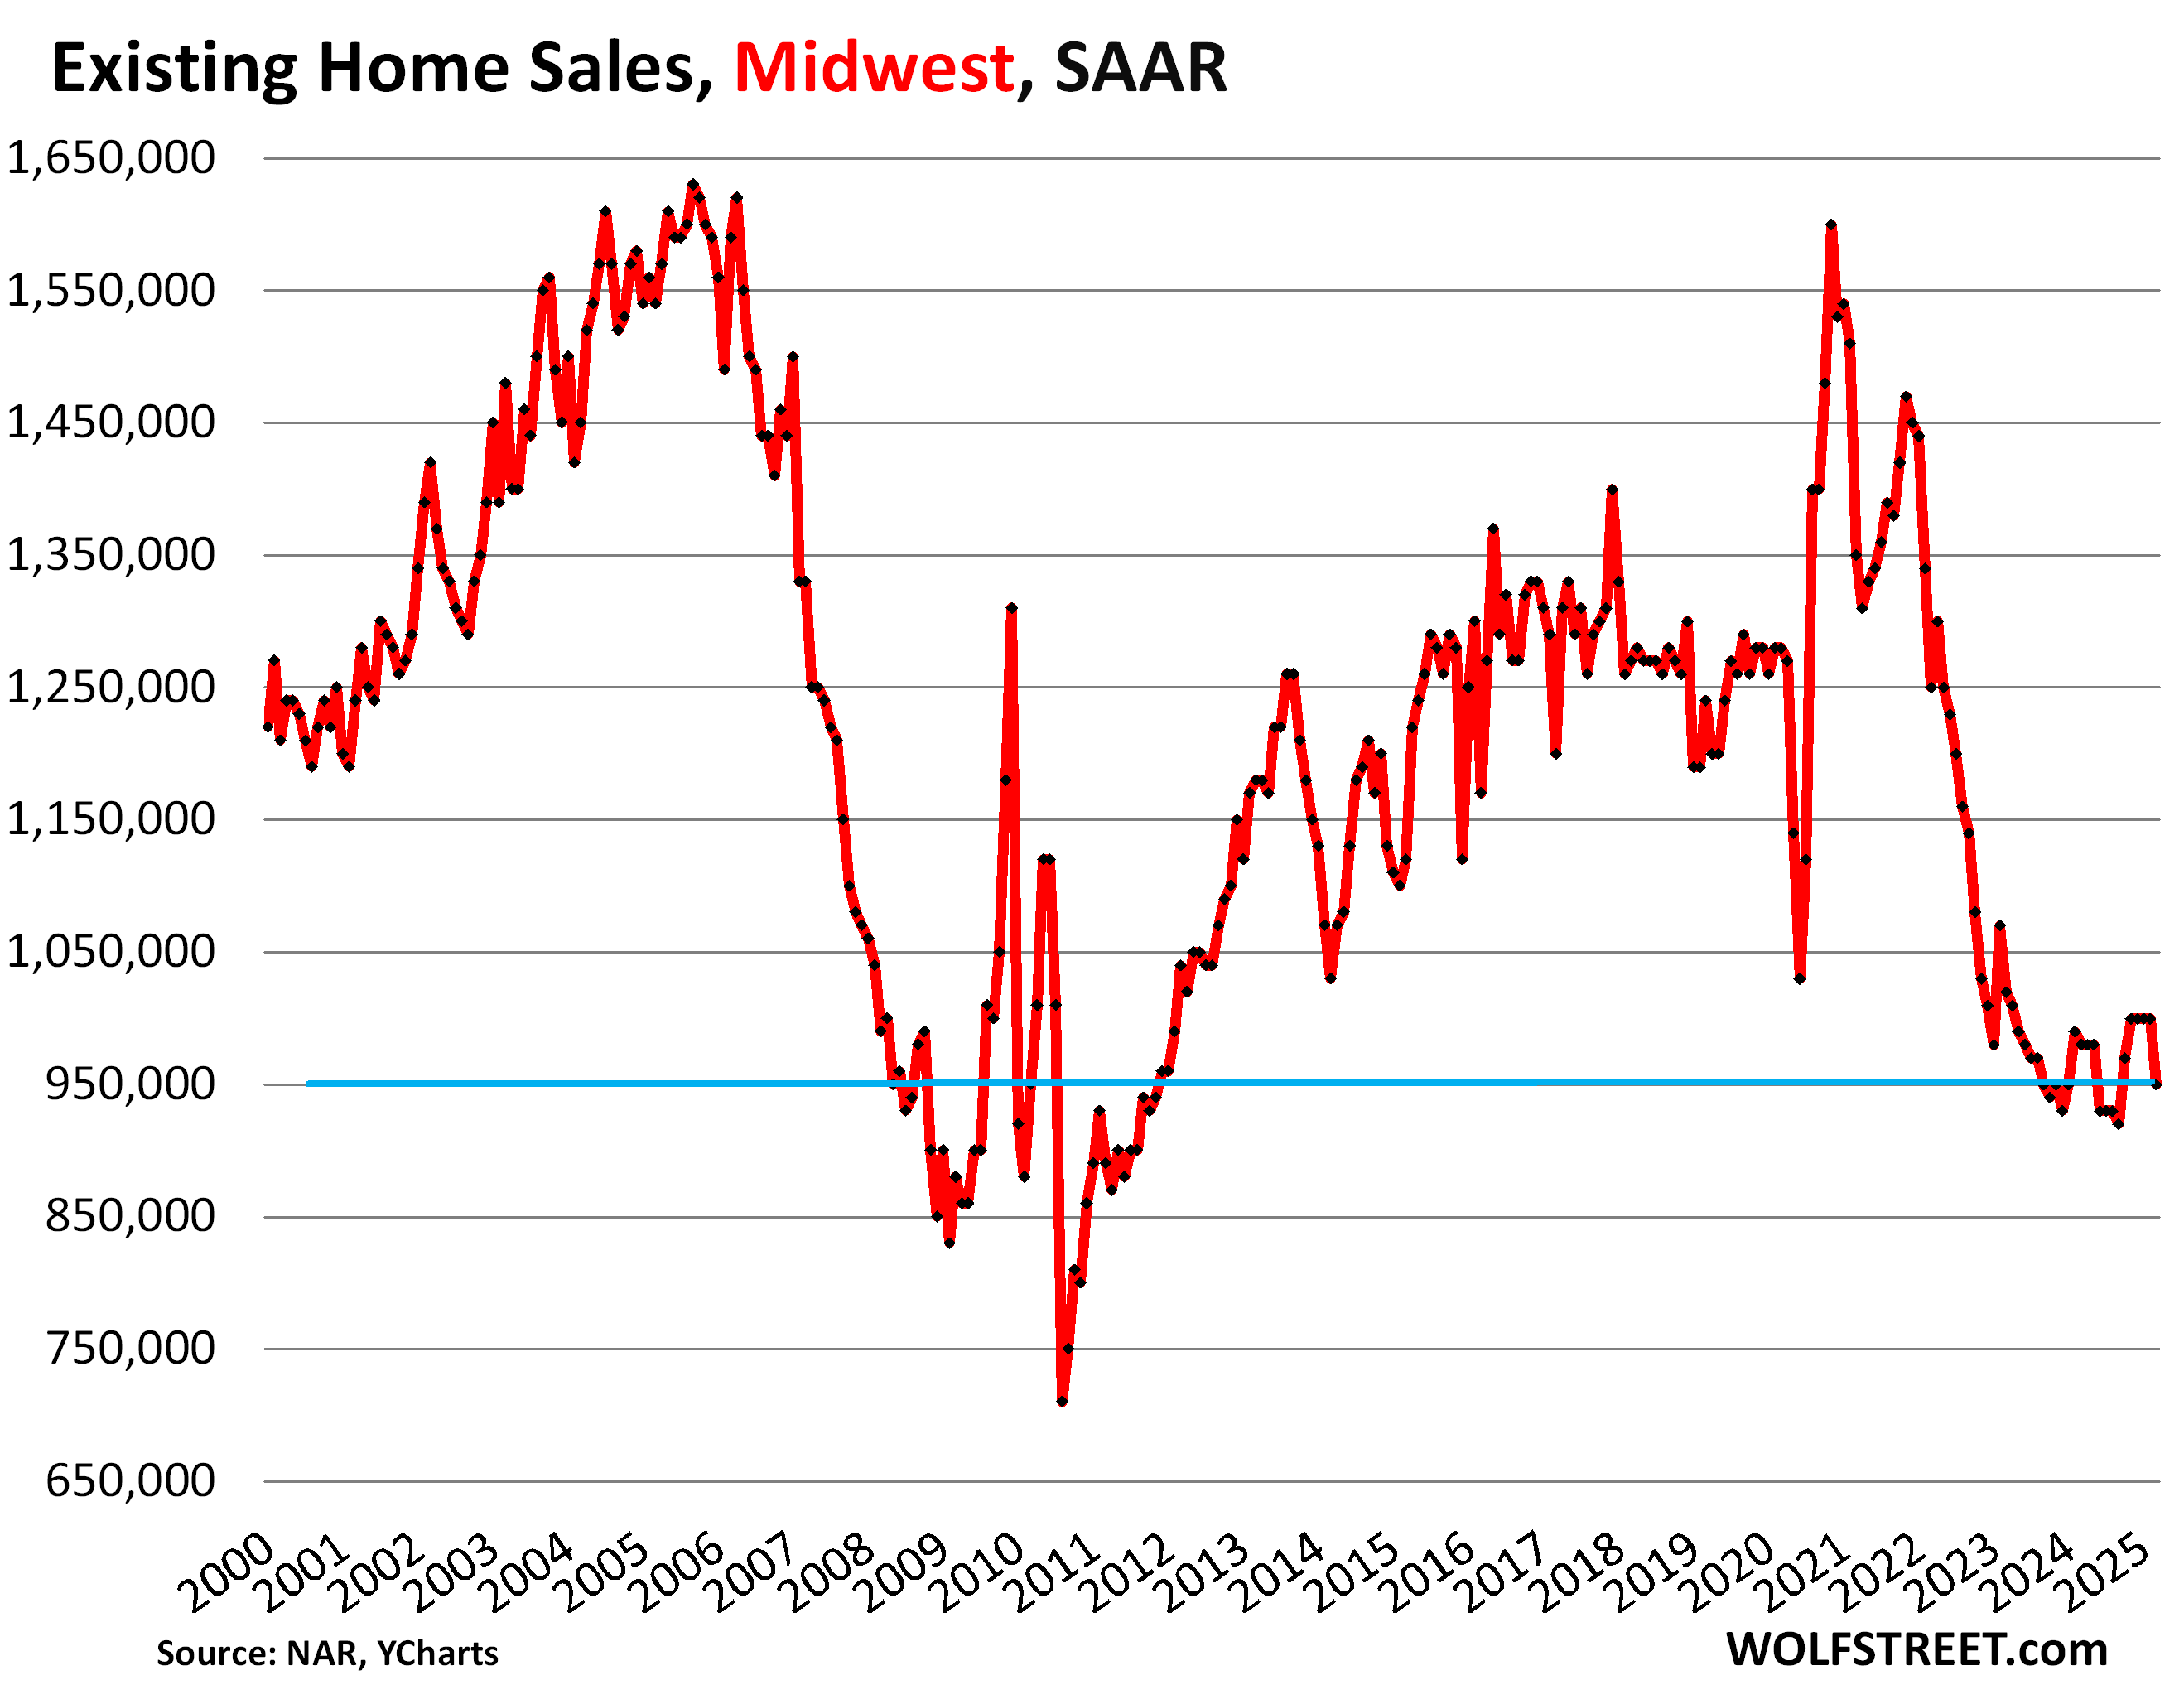
In the Midwest, the seasonally adjusted annual rate of sales fell to 950,000 in March, from 1.0 million homes in February, the worst March since 2011. Compared to prior years:
| Midwest, compared to March: | |
| 2024 | -3.1% |
| 2023 | -6.9% |
| 2022 | -24.0% |
| 2019 | -23.4% |
| 2018 | -25.2% |
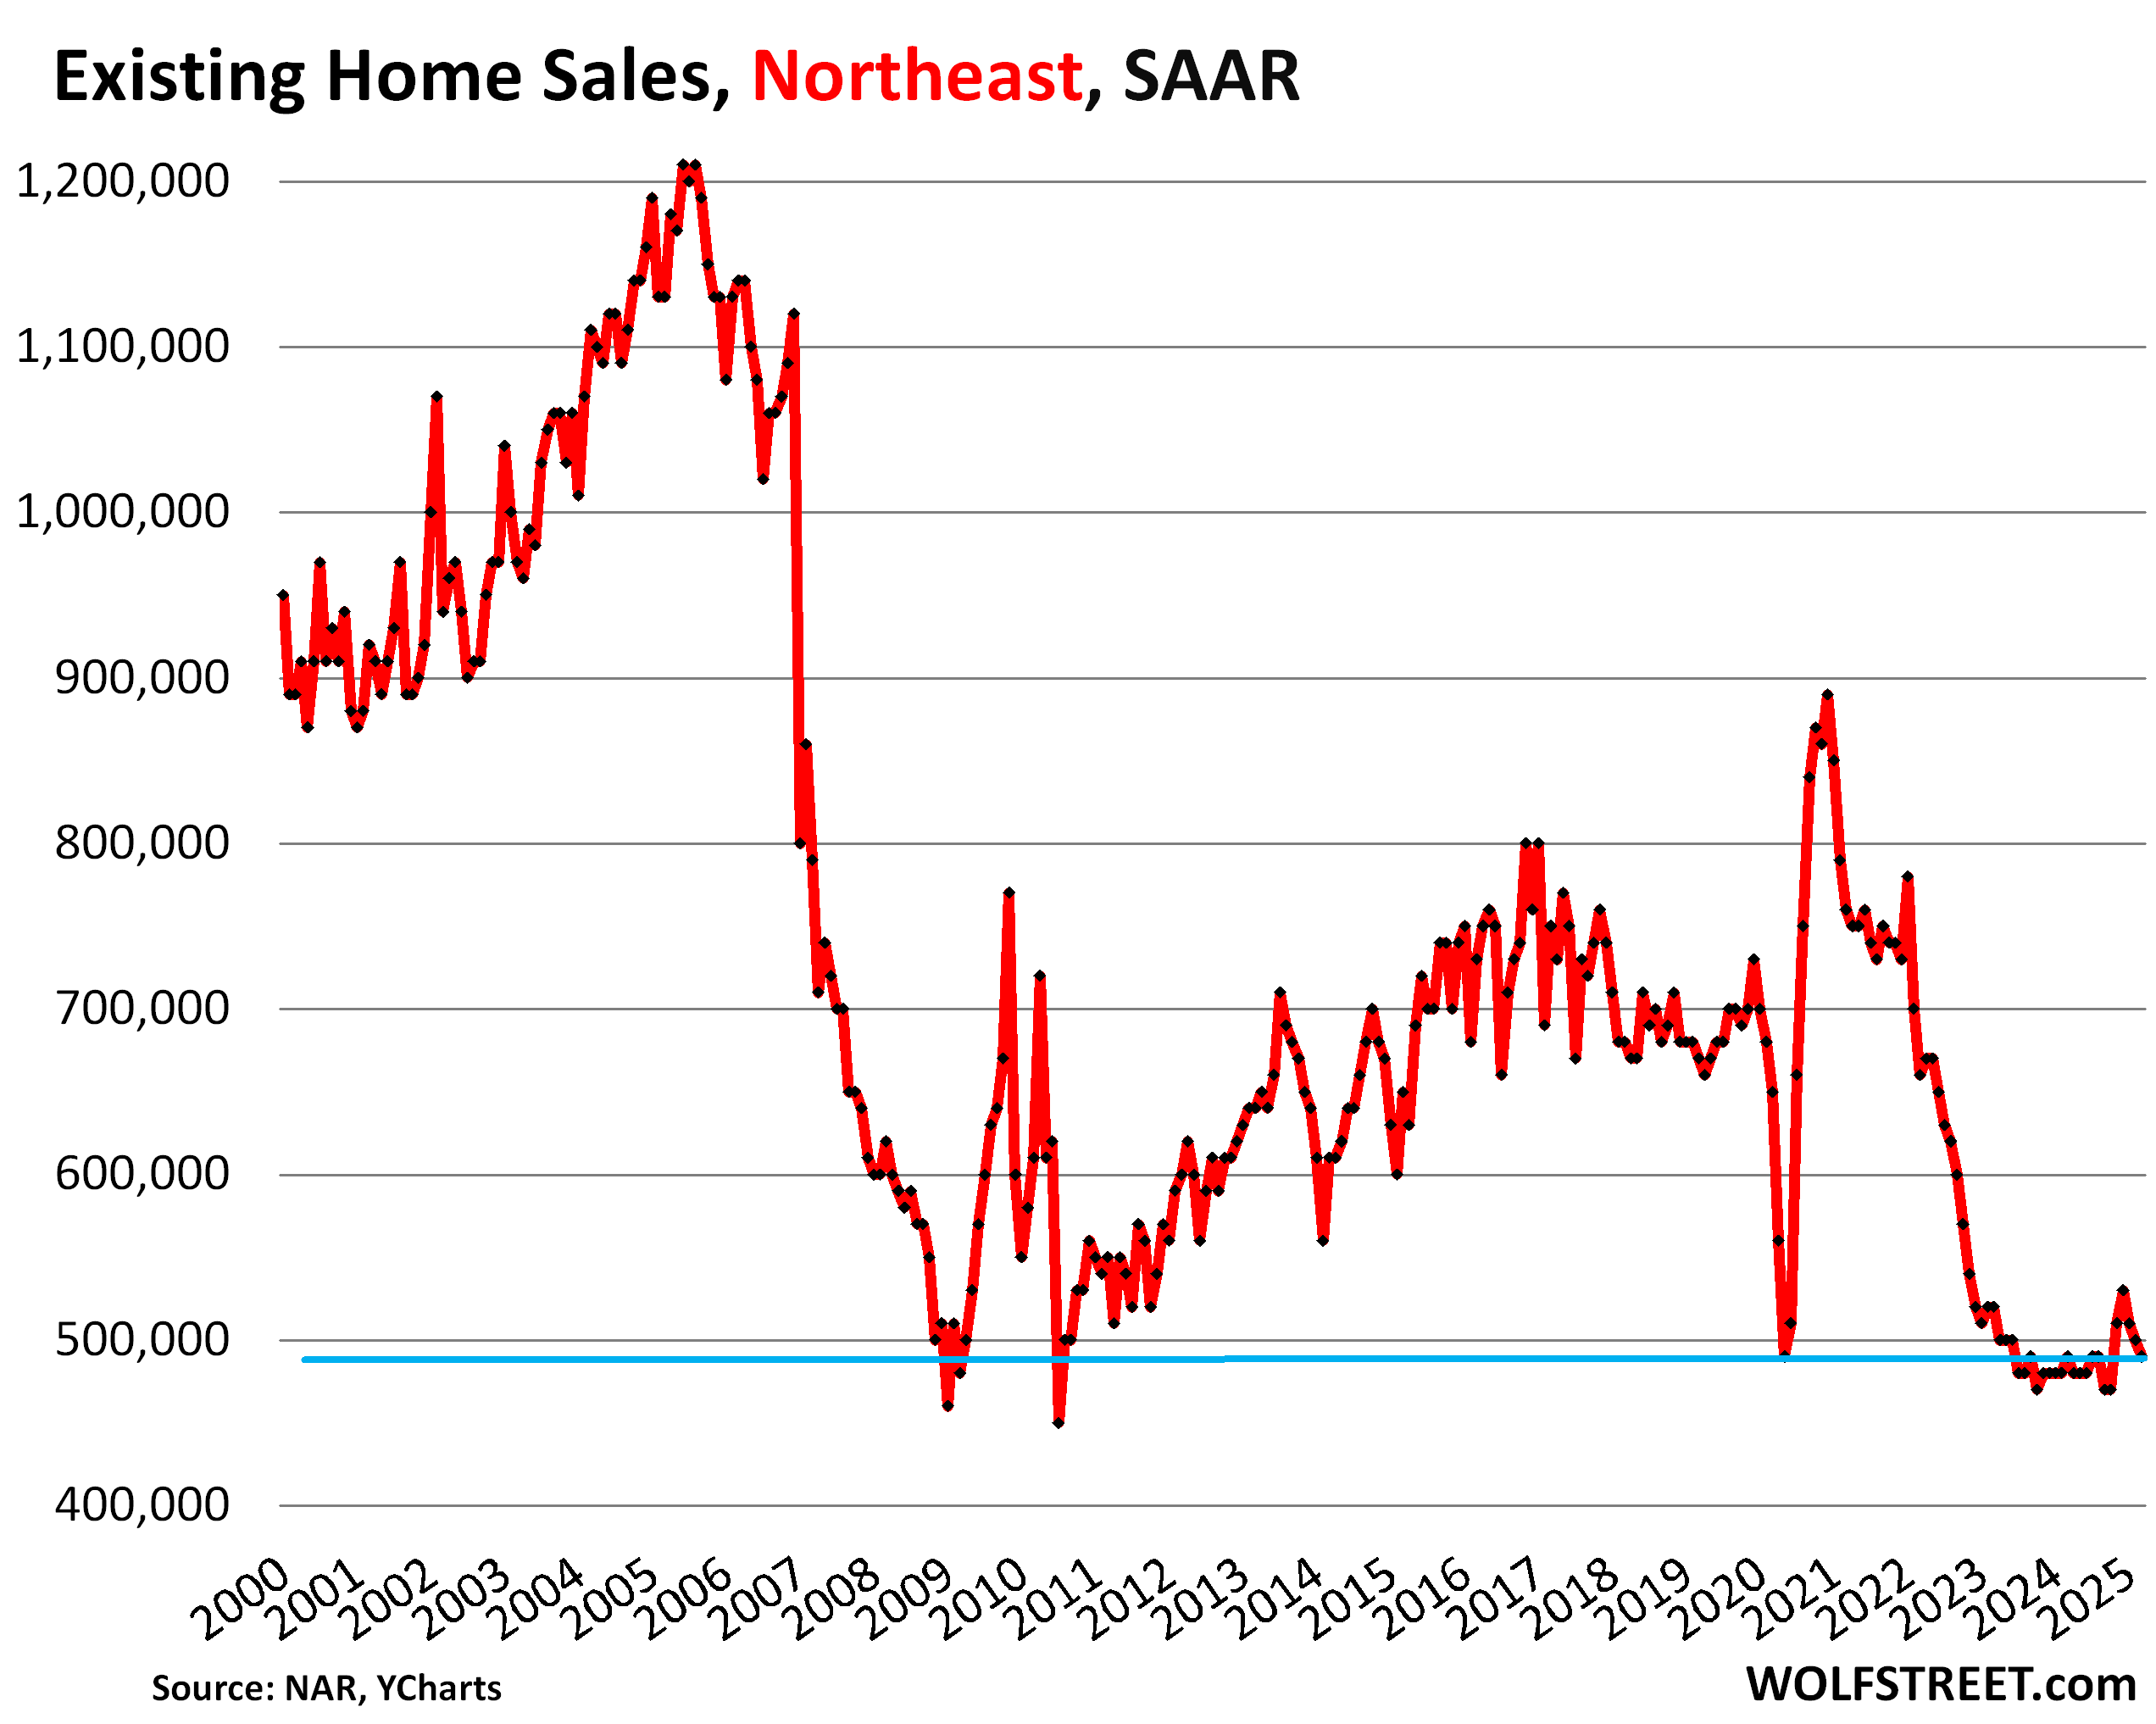
In the Northeast, the seasonally adjusted annual rate of sales fell to 490,000 homes in March, from 500,000 in February, and was the same as the abysmal March 2024 sales rate, and both were the worst Marches since 2009. Compared to prior years:
| Northeast, compared to March: | |
| 2024 | 0.0% |
| 2023 | -5.8% |
| 2022 | -25.8% |
| 2019 | -26.9% |
| 2018 | -27.9% |
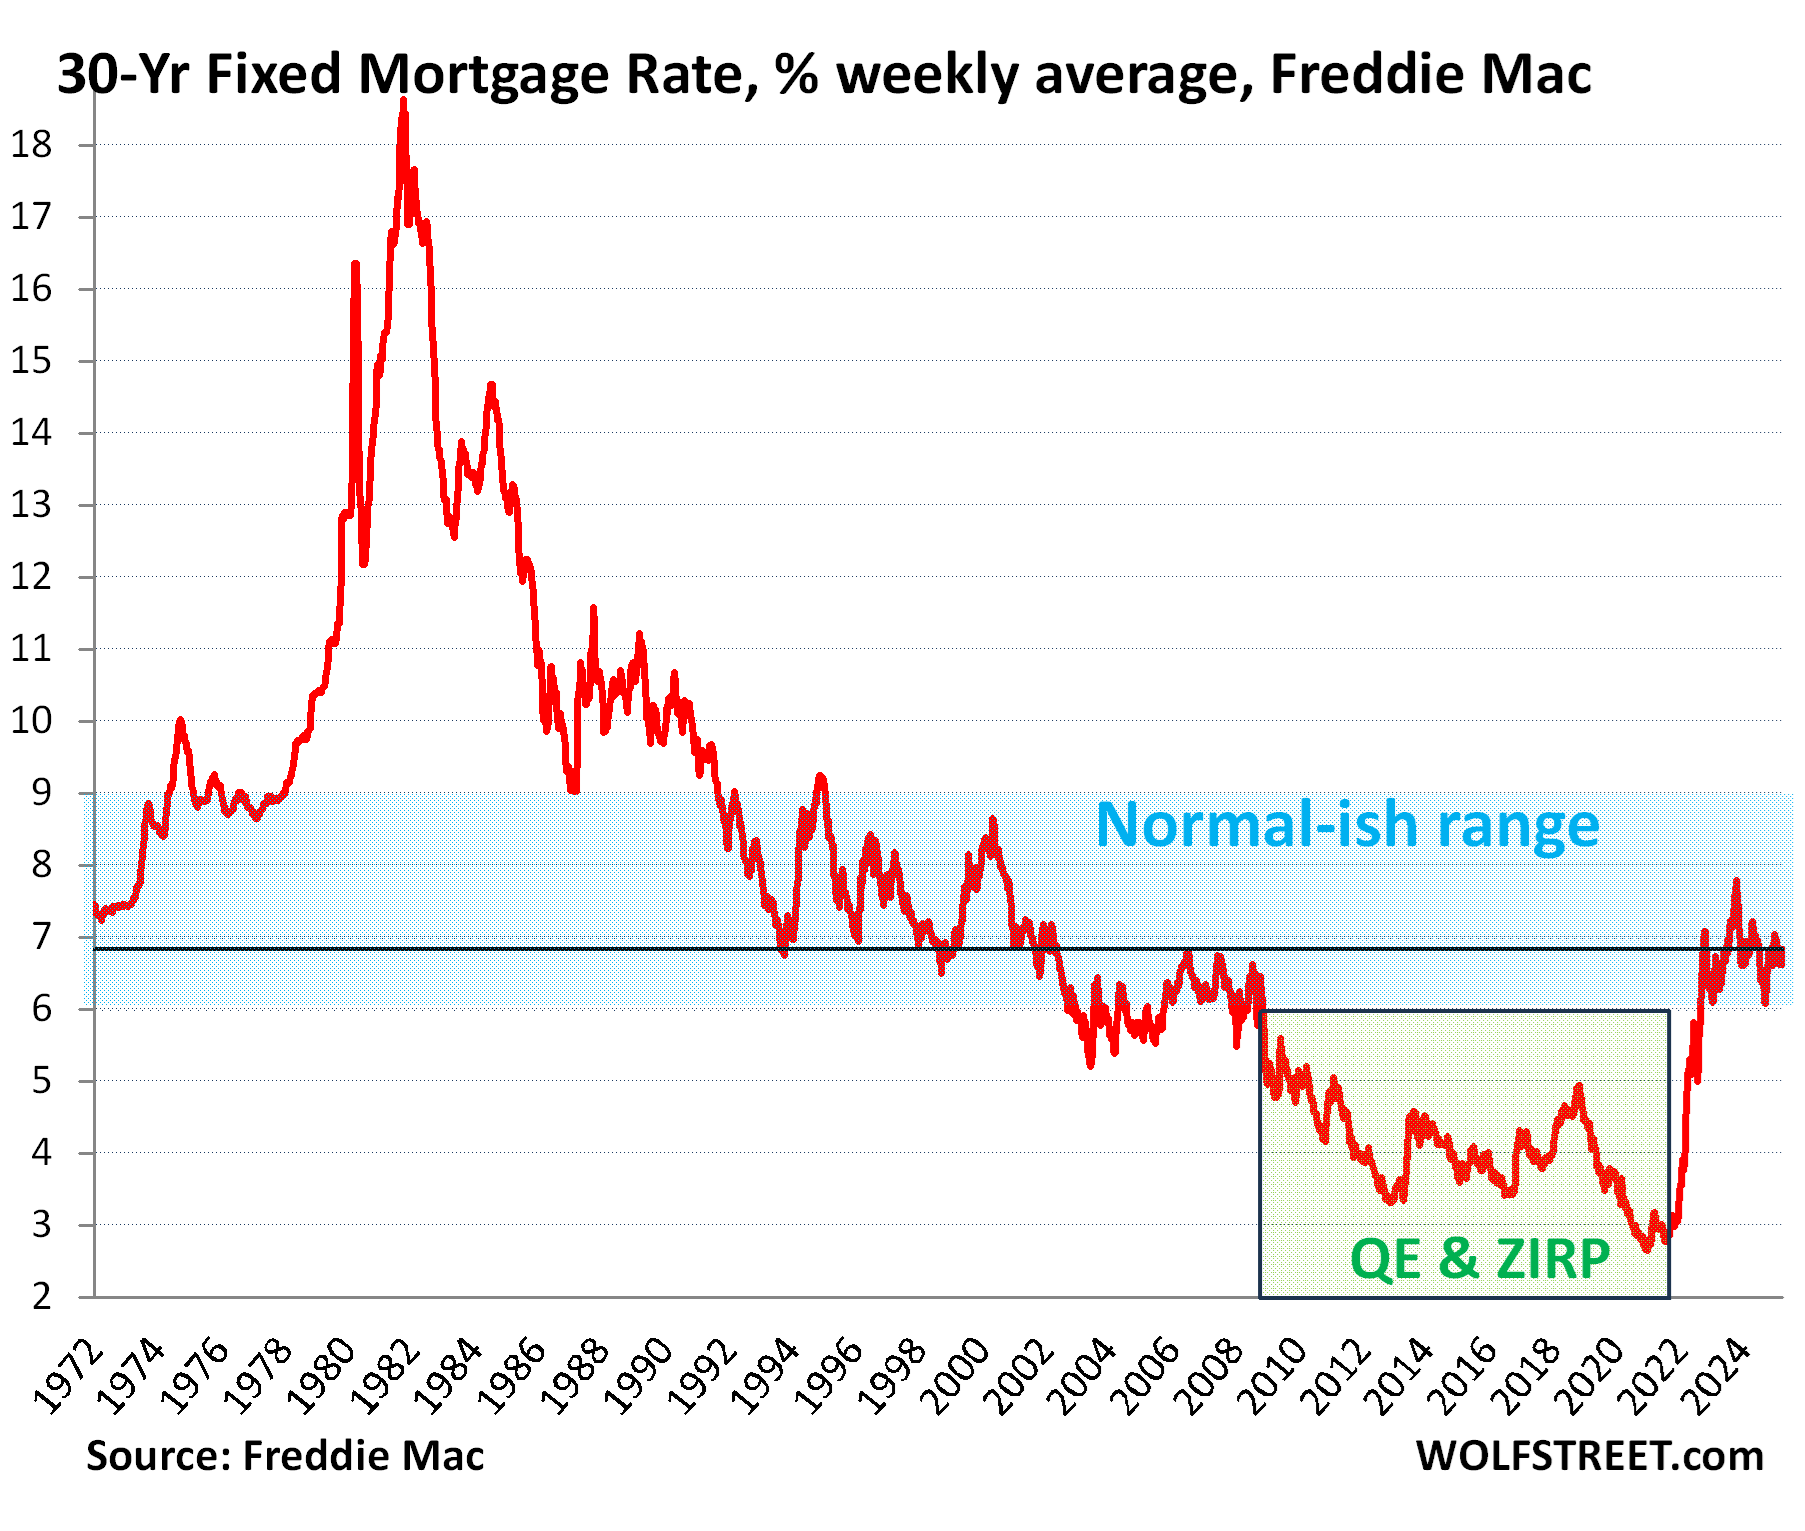
But mortgage rates are in the historically normal-ish range.
While home prices that spiked by 50% triggered this massive demand destruction, mortgage rates have returned to the historically normal-ish range that prevailed in the decades before the Fed commenced its interest-rate-repression schemes in 2008, via its 0% interest rate policy (ZIRP) and two massive waves of QE, including the purchases of trillions of dollars of mortgage-backed securities.
Before this interest rate repression began in 2008, mortgage rates were always above 5%, and with the exception of the first three years (2003-2005) of Housing Bubble 1, above 6%, and much of the time above 7% and 8%.
But QT shaved $2.24 trillion off the Fed’s balance sheet so far, and the Fed keeps shedding its MBS holdings, and the spread between the 10-year Treasury yield and 30-year mortgage rates has widened to reflect that, and mortgage rates have remained near 7%, on either side of it.
The entire housing industry obviously loves ridiculously inflated prices and hates historically normal mortgage rates, and so it condemns the historically normal mortgage rates and praises the ridiculously high prices, which the NAR did today again.
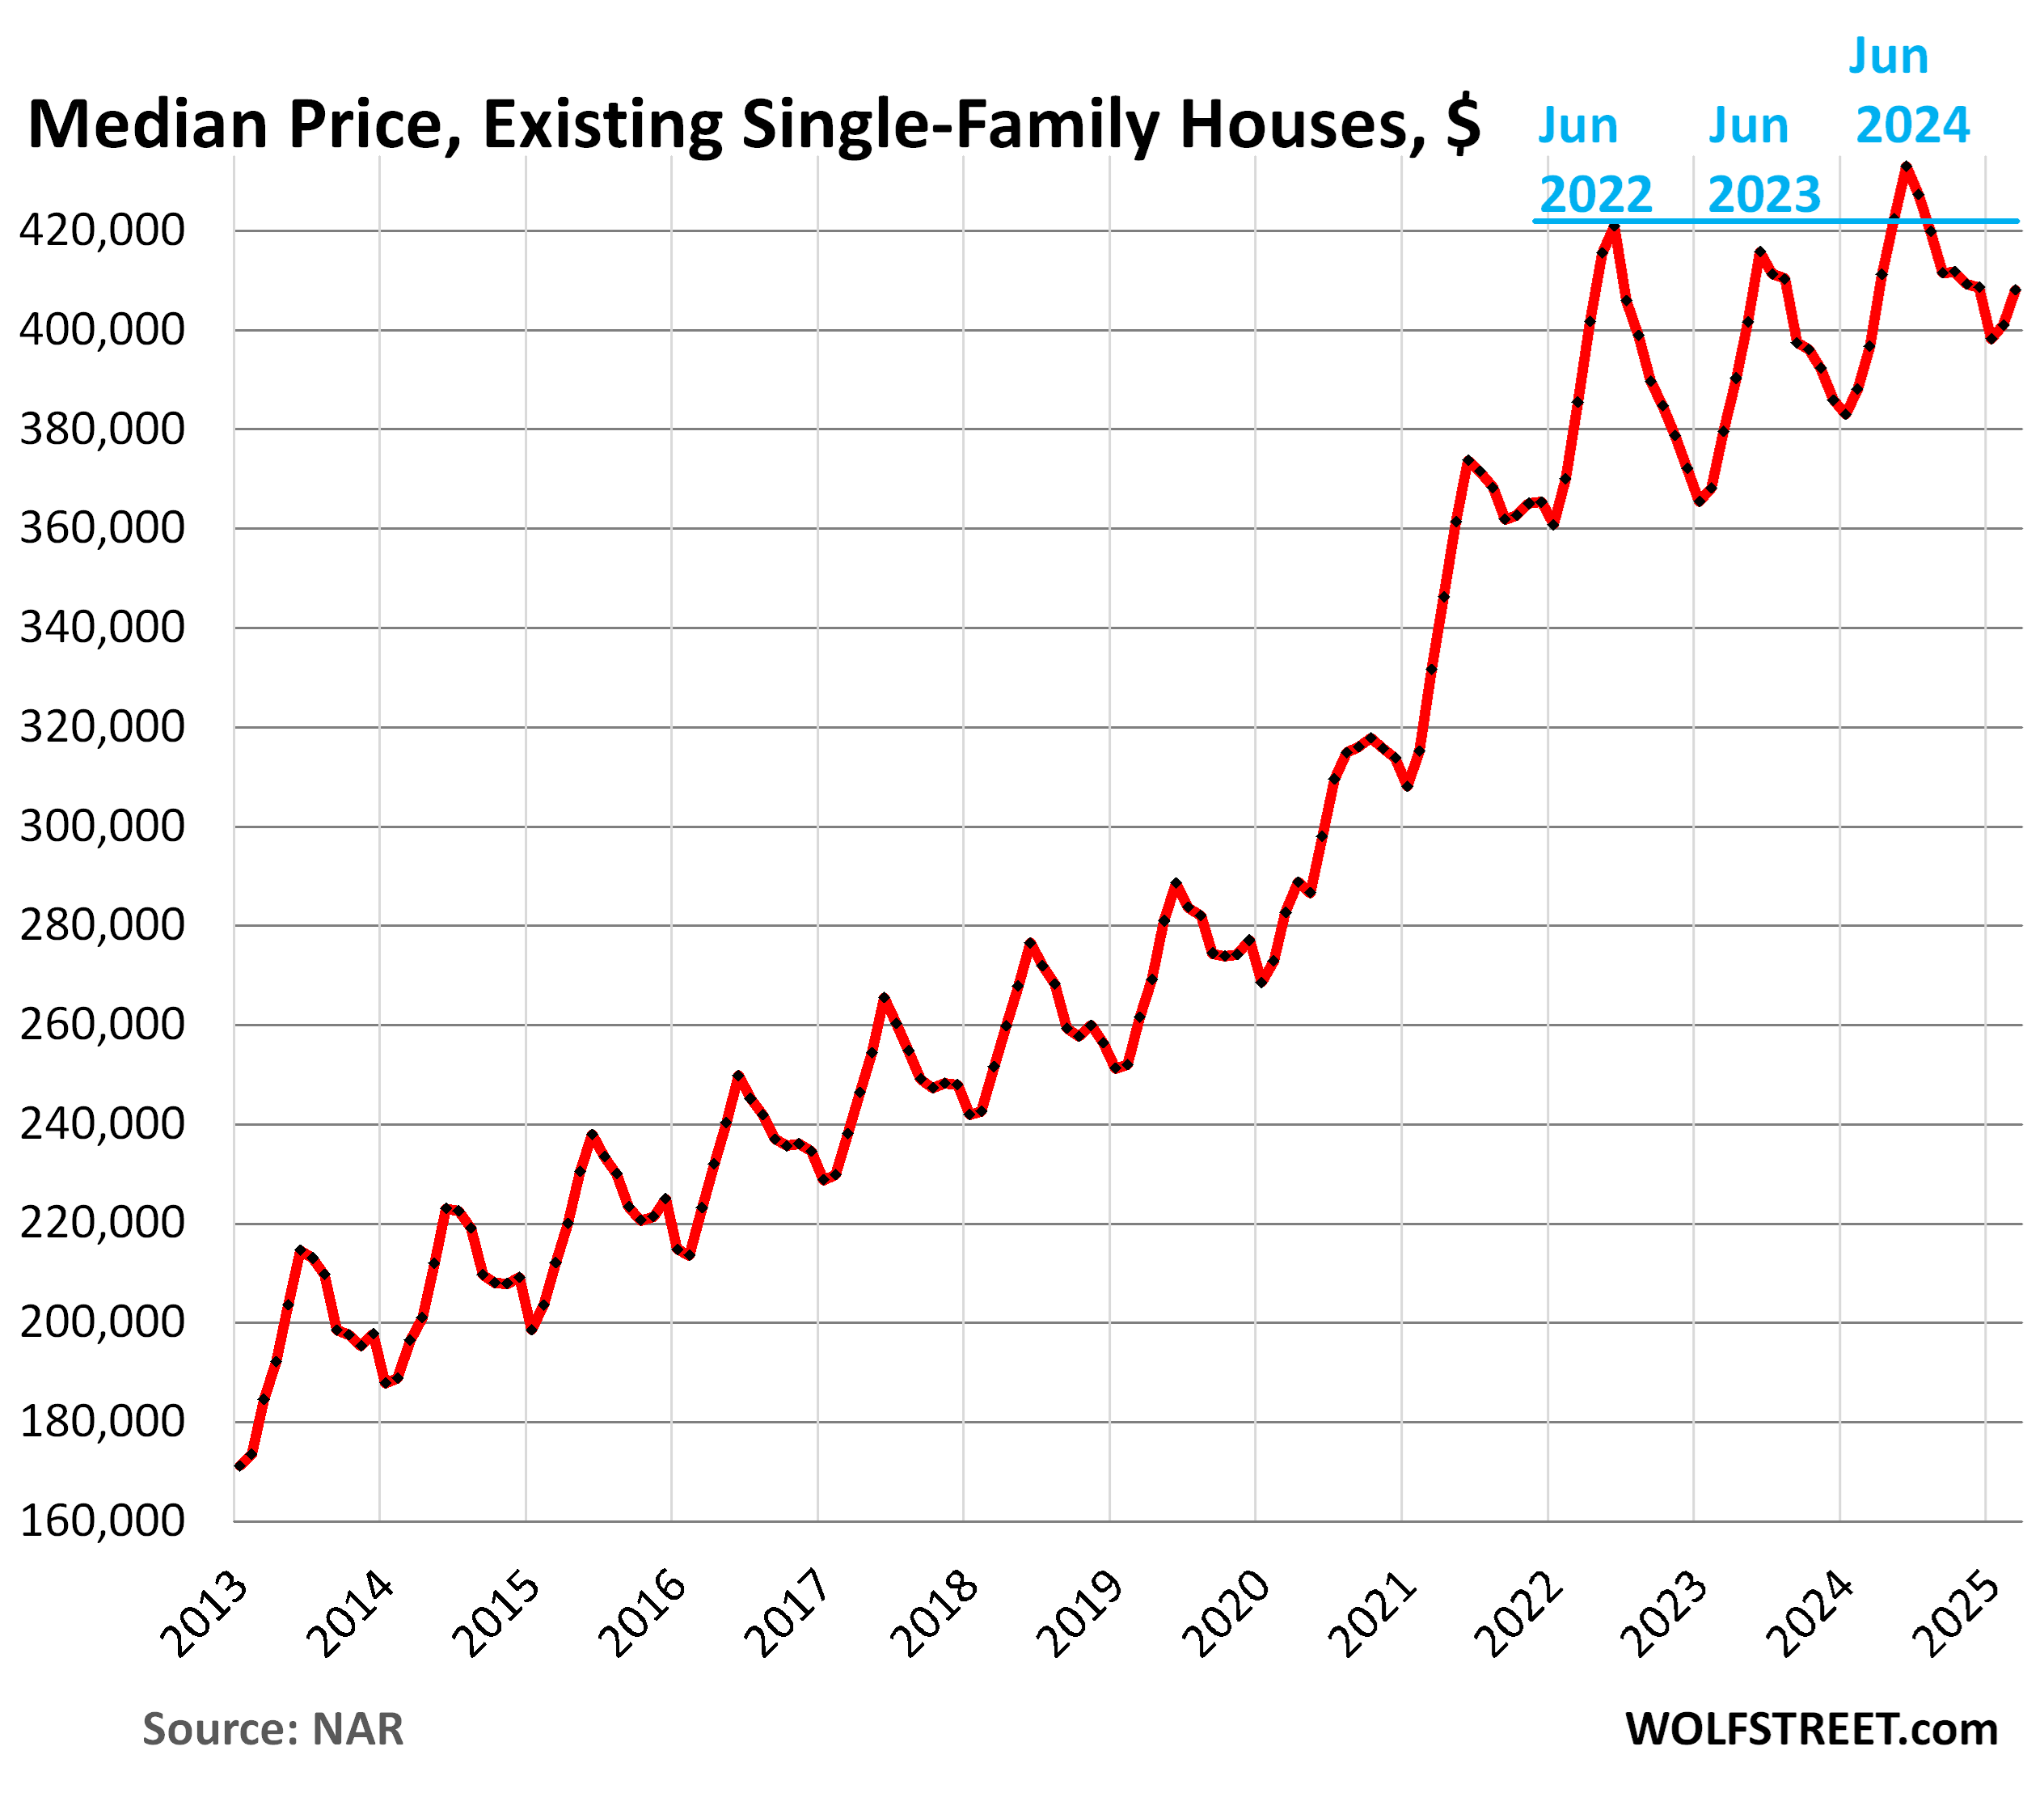
Median price for single-family houses and condos.
The median price is heavily skewed by changes in the mix of homes that sold. In the spring, nationally, more higher-end homes come on the market and sell, which changes the mix of what sold and skews the median price higher. It does the reverse in the fall and winter and skews the median price lower. These seasonal ups and downs in median prices are at least in part due to this shift in the mix.
Single-family houses: The national median price rose to $408,000 in March, from $400,900 in February.
This month-to-month gain of $7,100 was smaller than the gain in March last year, and so the year-over-year gain narrowed further to +2.9%, with year-over-year gains having now narrowed for the third month in a row (from +5.3% in December).
The 50% price explosion over the three years between June 2019 and June 2022, on top of the large price gains in the prior 10 years, was driven by the Fed’s interest-rate repression and money-printing schemes which have created the #1 problem in the housing market today, and it has destroyed demand: Prices are simply way too high, don’t make economic sense, and are not economically sustainable. Textbook demand destruction is the result.
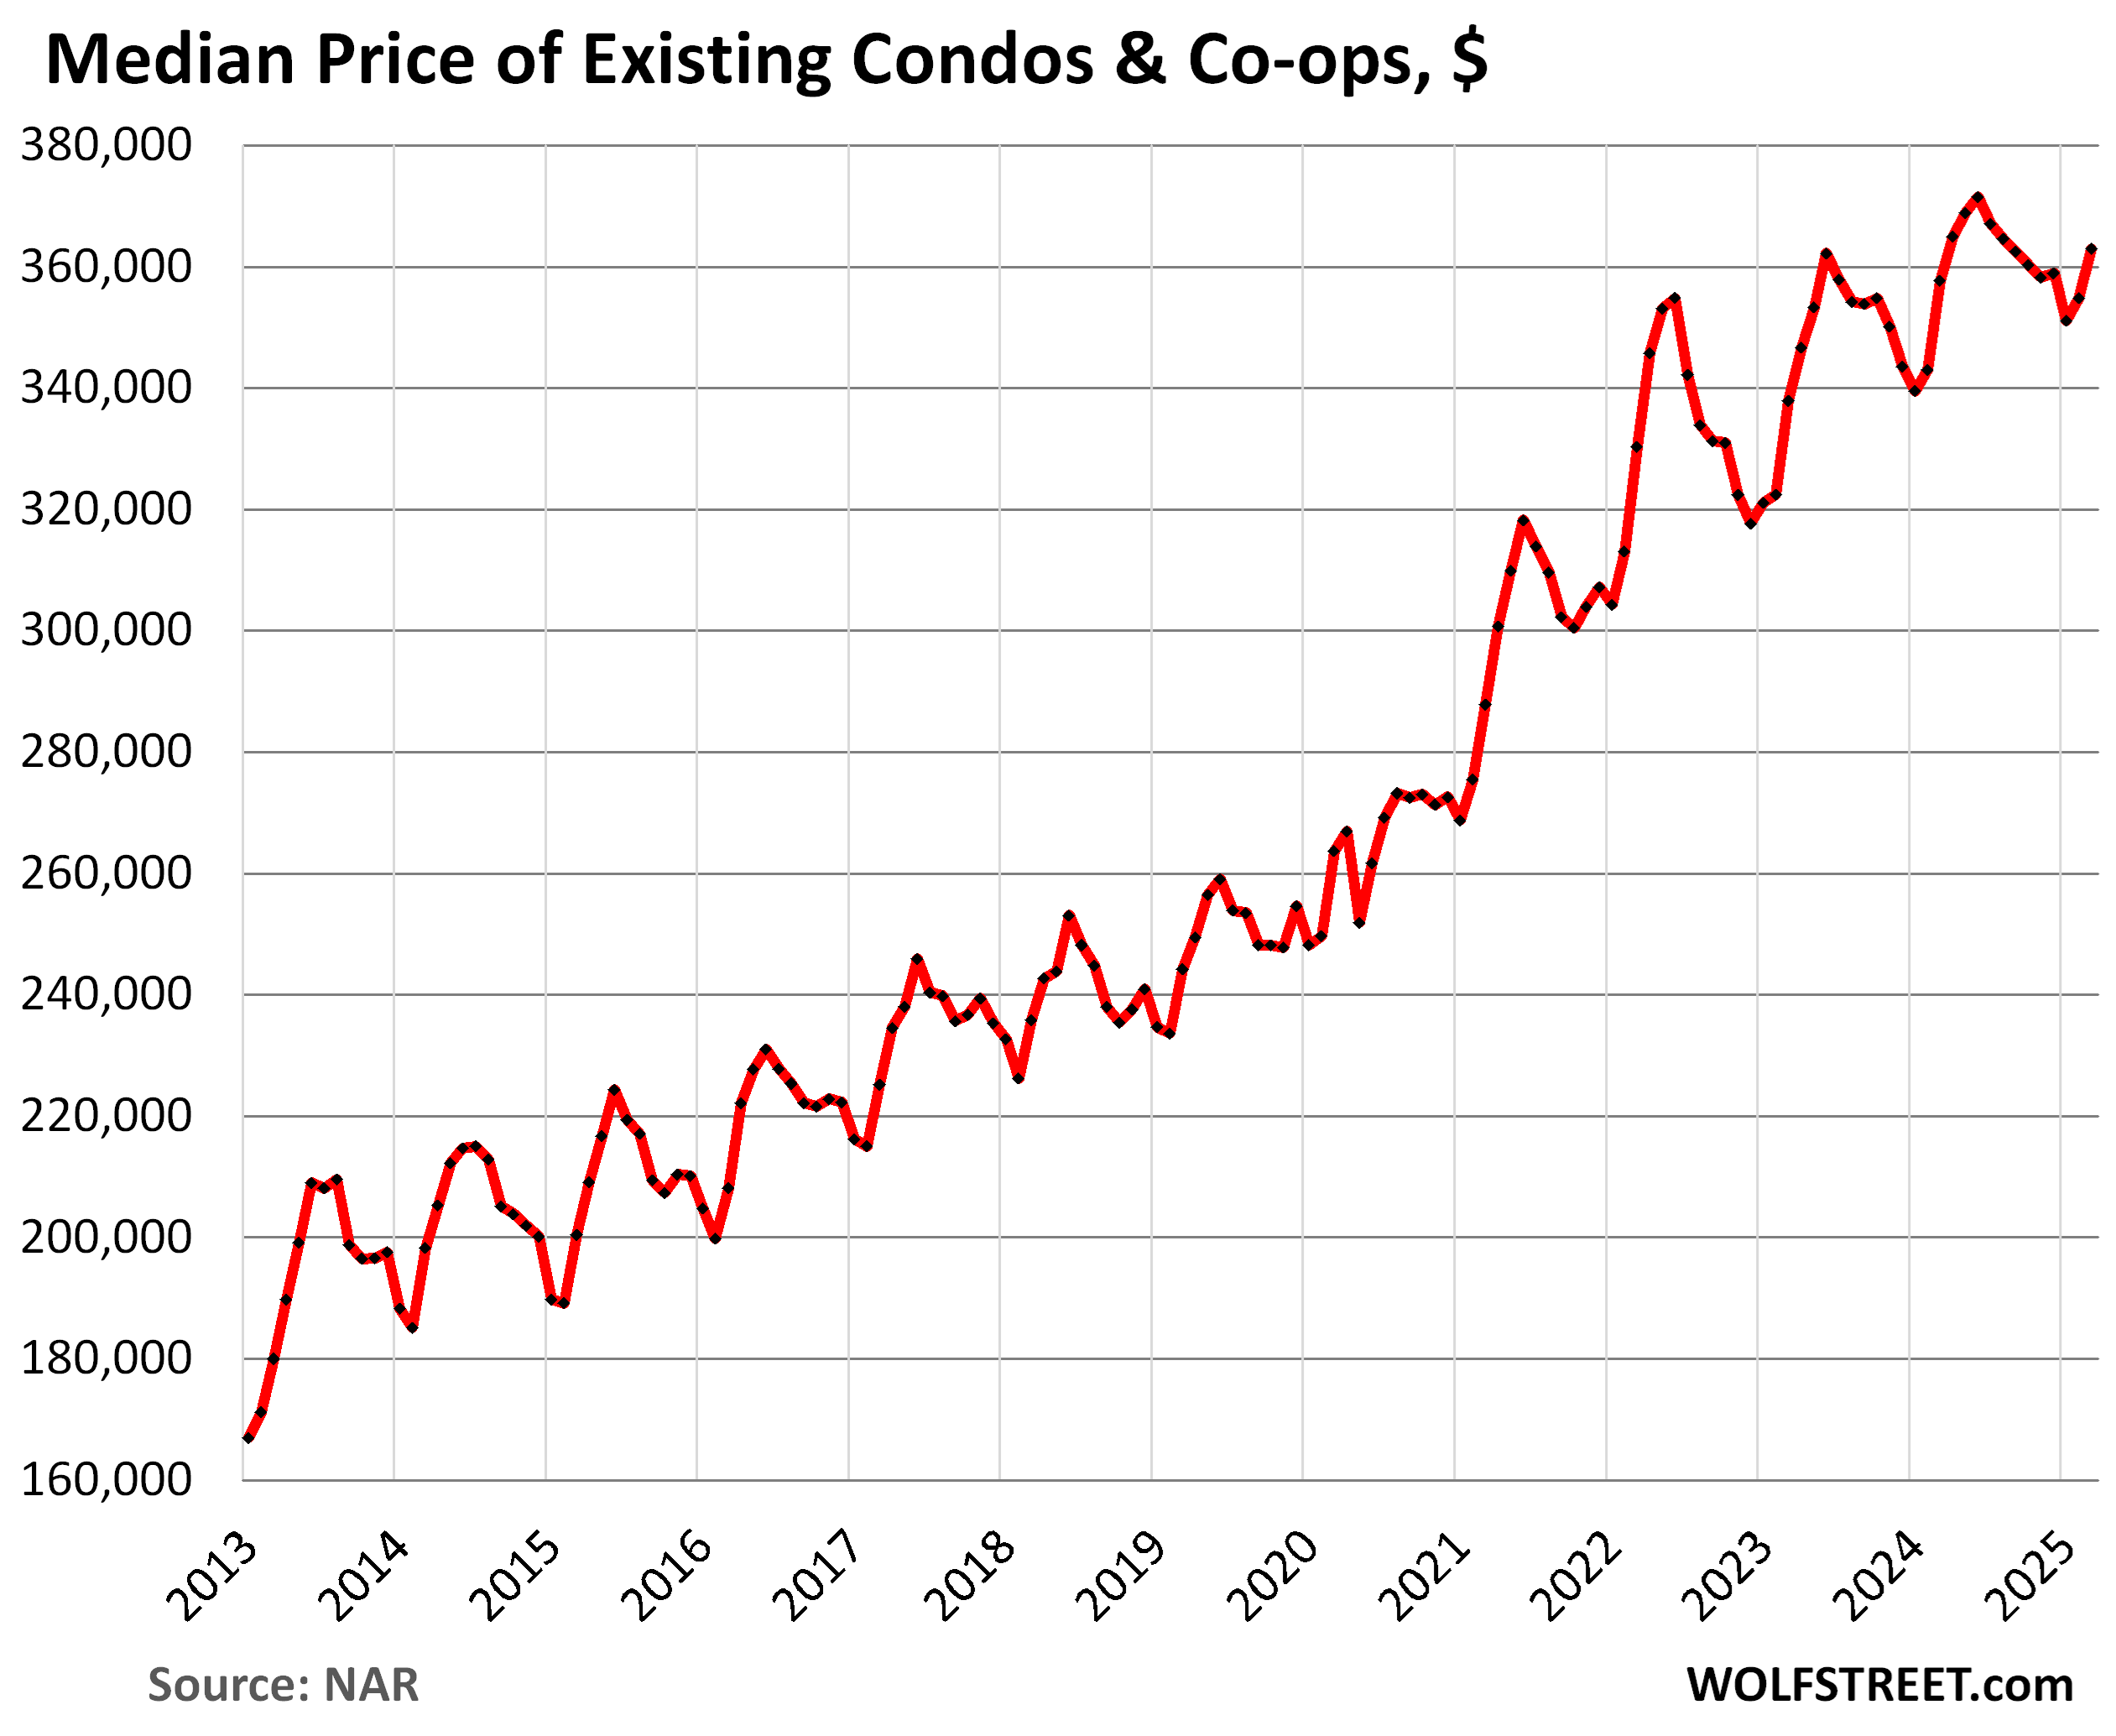
Condos and co-ops. The national median price rose to $363,000 in March, from $354,800 in February.
The month-to-month gain of $8,200 was far smaller (by almost half) than the gain in March last year, which slashed the year-over-year gain to just 1.5%, from 3.4% in February, the third month in a row of narrowing year-over-year gains (from +4.5% in December).
But every market dances to its own drummer. I track home prices (single-family and condos combined) in the largest most expensive 33 markets, in my long-running series, The Most Splendid Housing Bubbles in America, March 2025: The Price Drops & Gains in 33 of the Largest Housing Markets. In quite a few of them, prices have dropped substantially from their peaks in mid-2022.
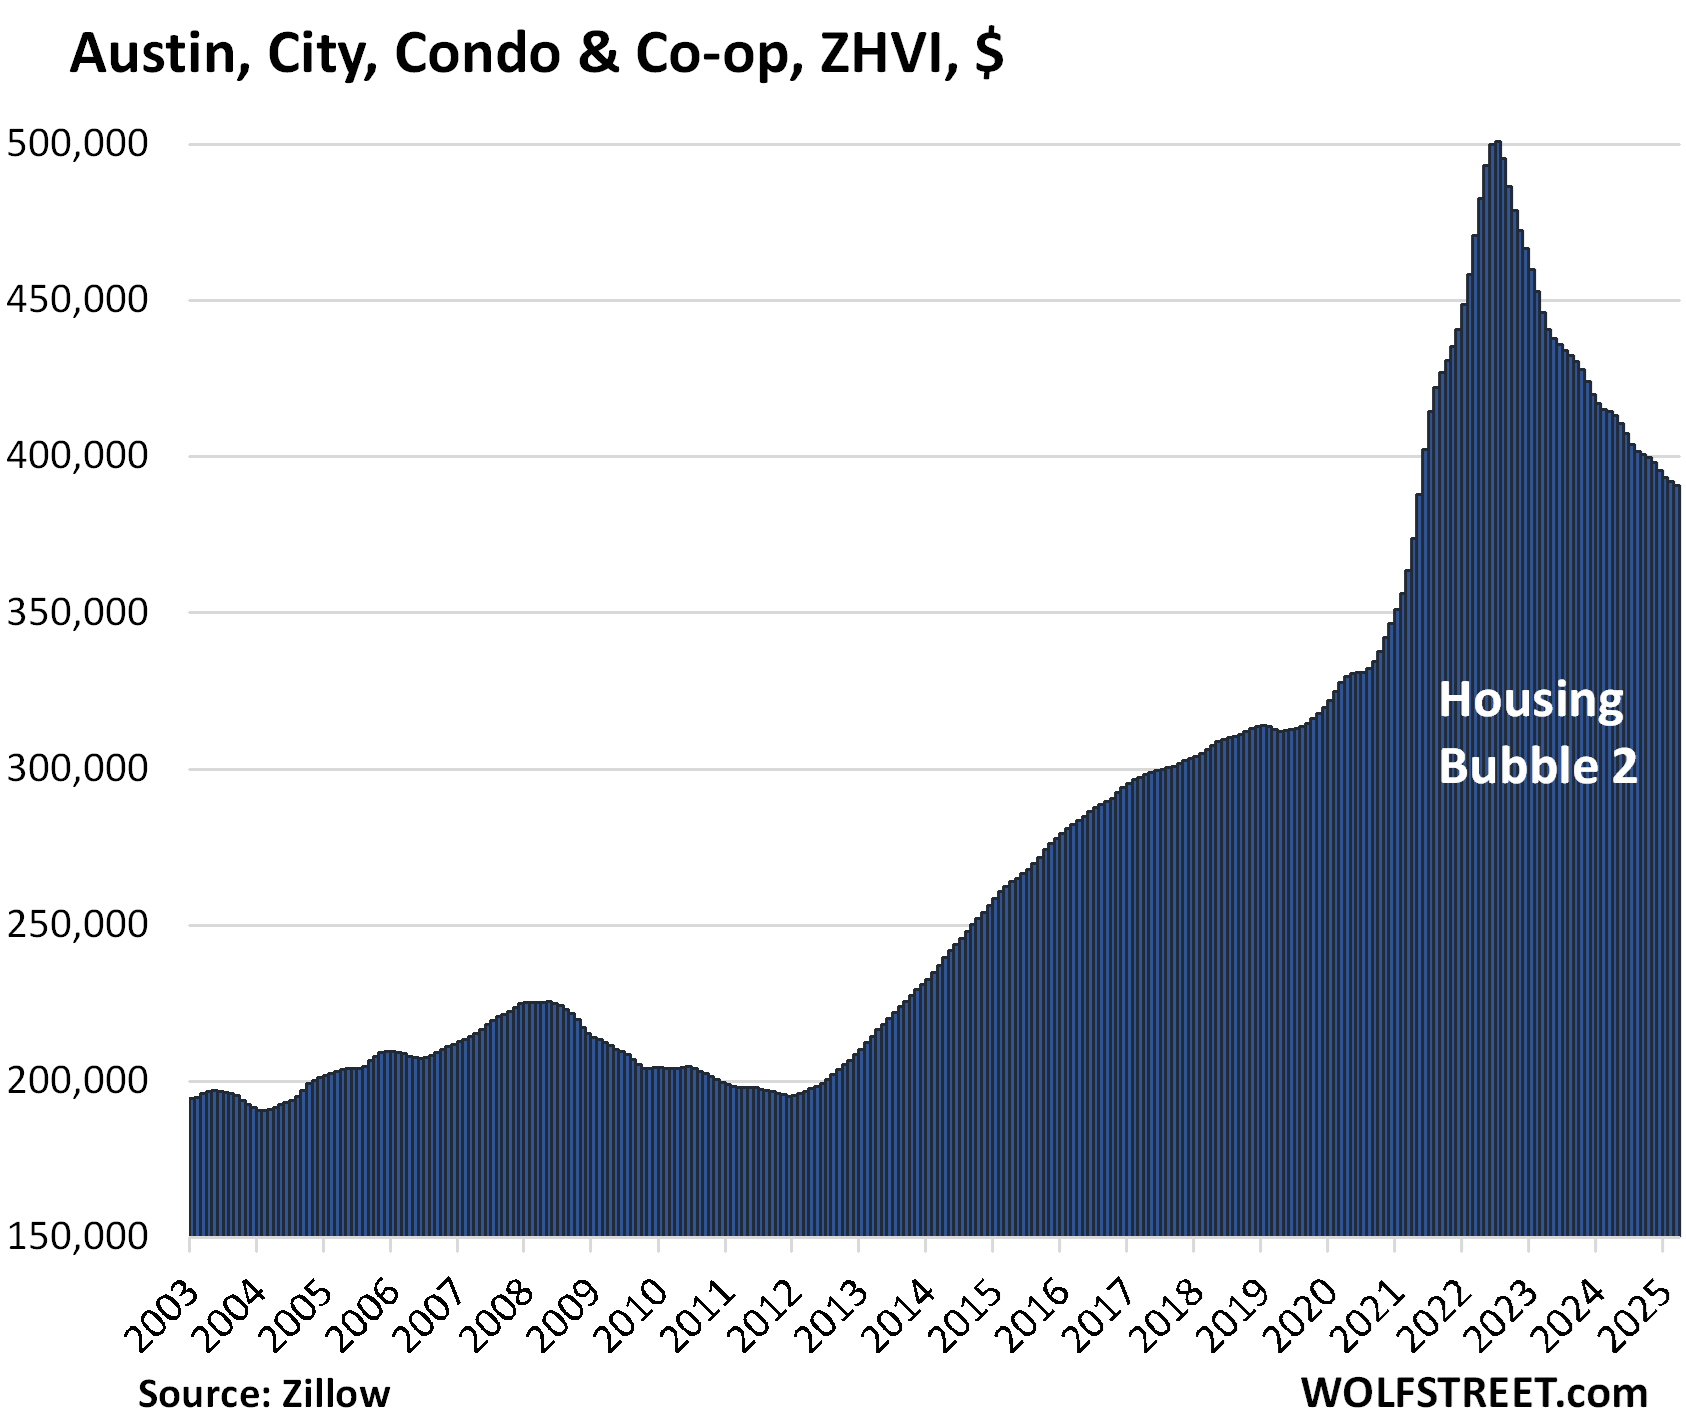
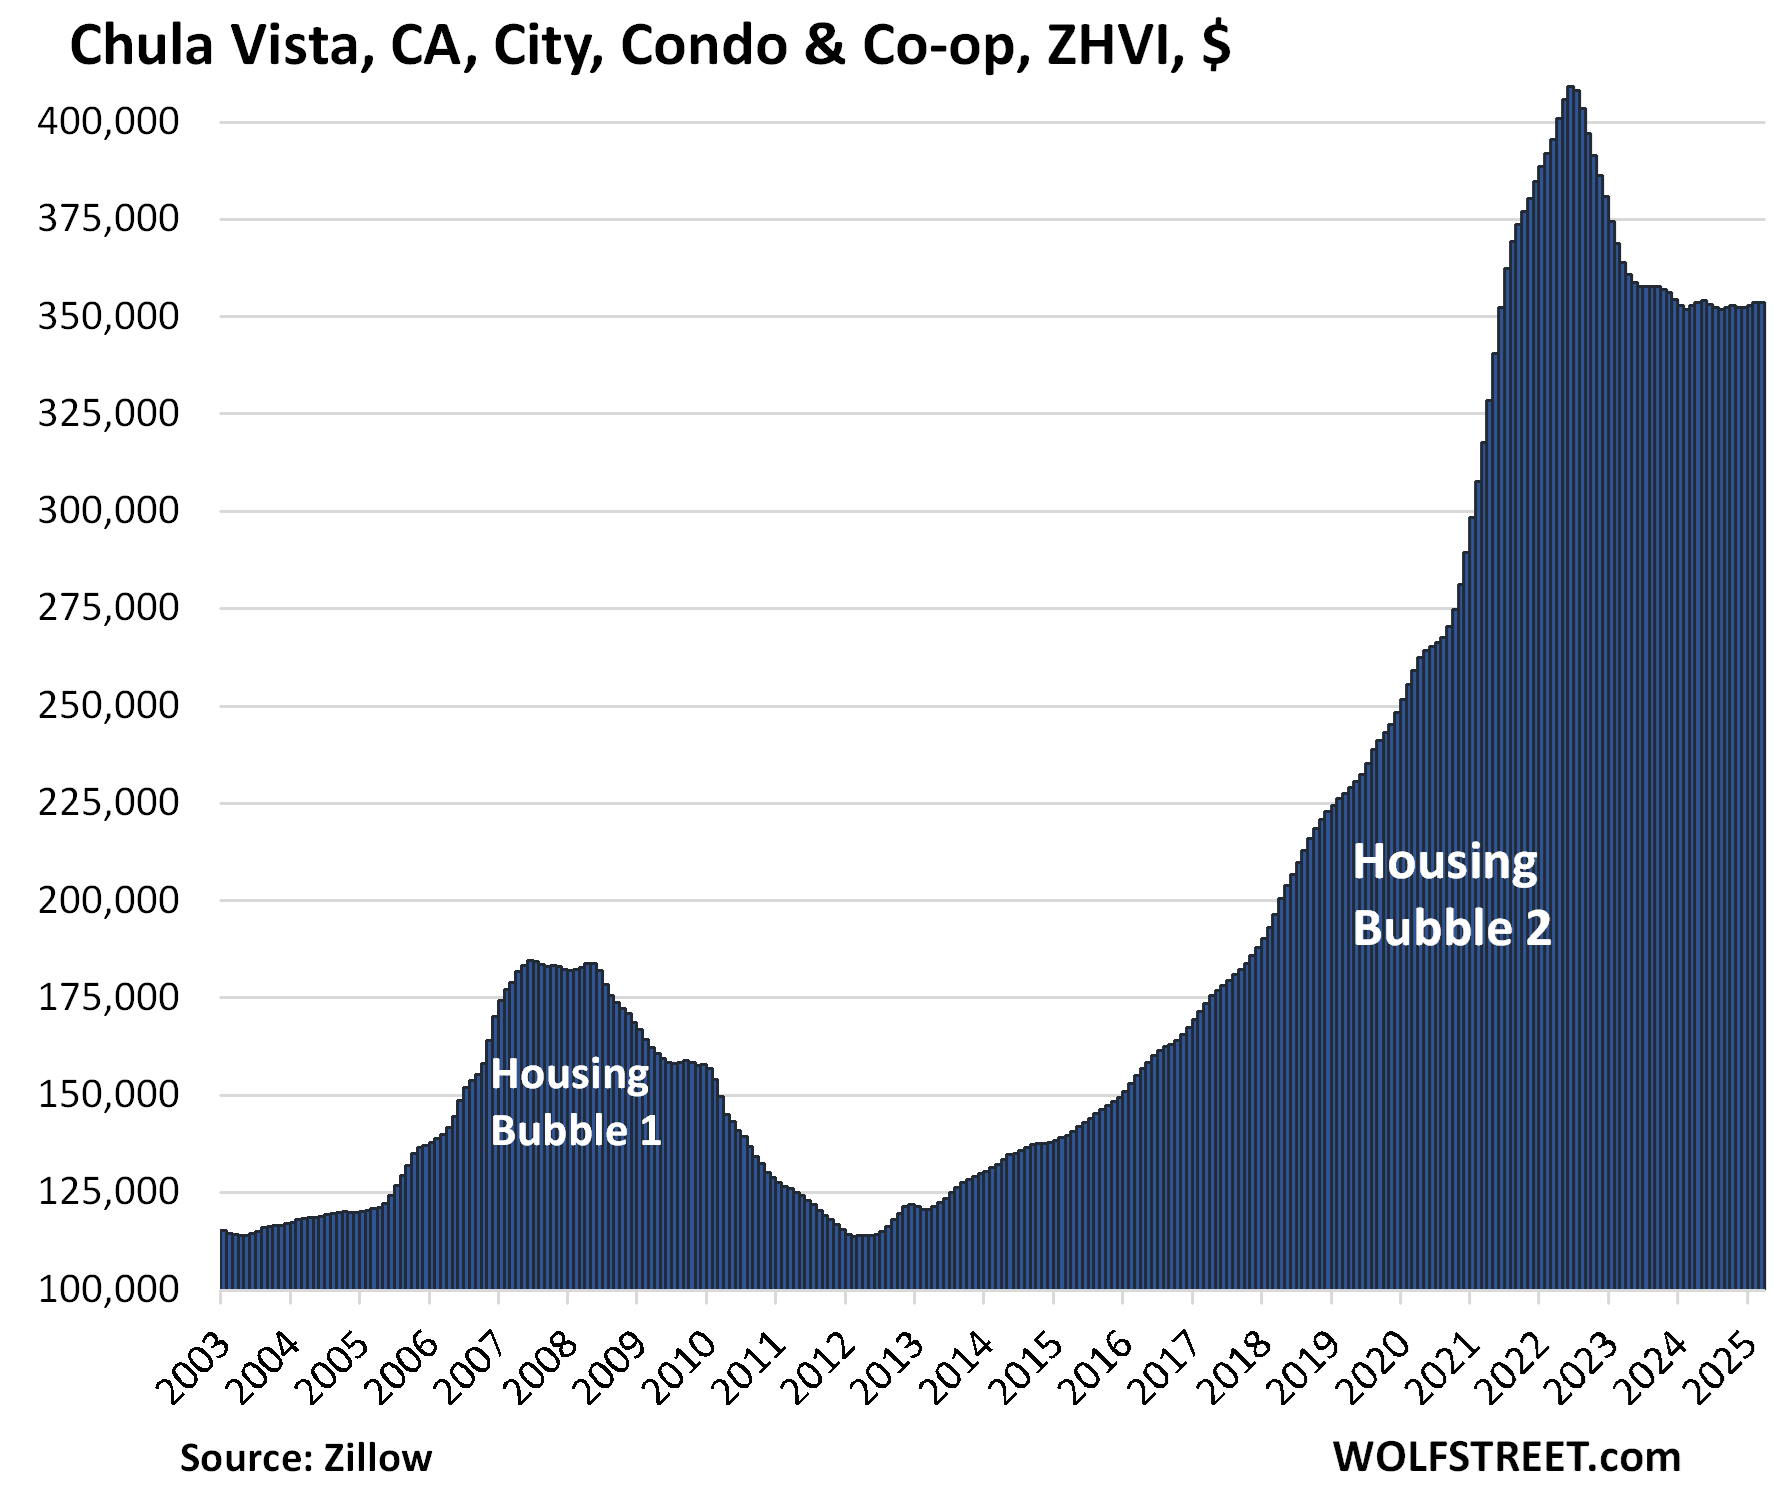
But condos are on the forefront, on the way up, and on the way down, and price drops in many cities have been substantial: In 15 Bigger Cities, Condo Prices Already -10% to -22%, 5 Are in Florida with Accelerating Drops. Absurdity Comes Unglued. Here are four of the 15:
Condo prices in Austin, TX: -22% from peak in July 2022:
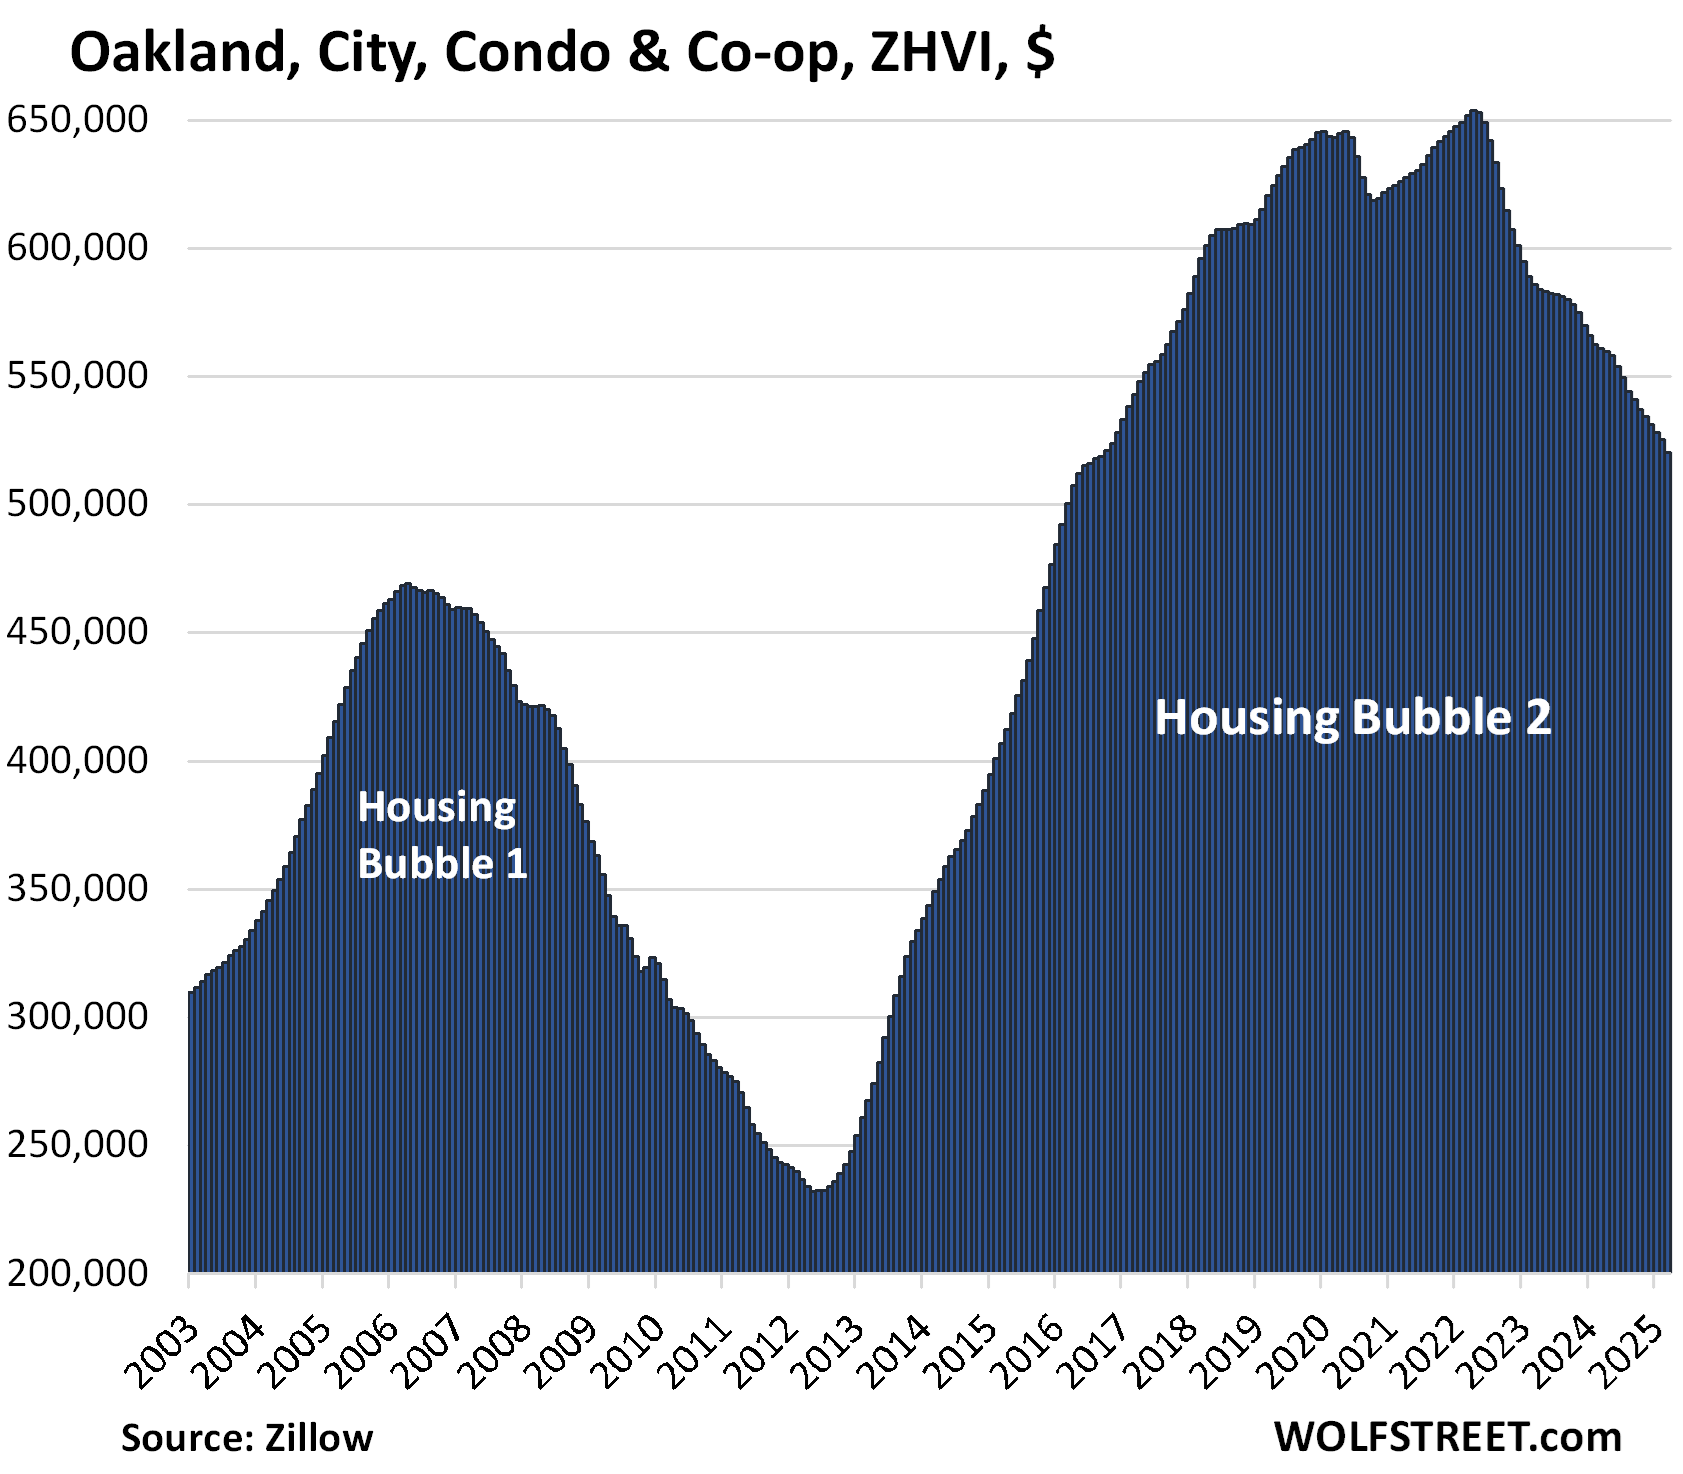
Condo prices in Oakland, CA: -20% from peak in May 2022:
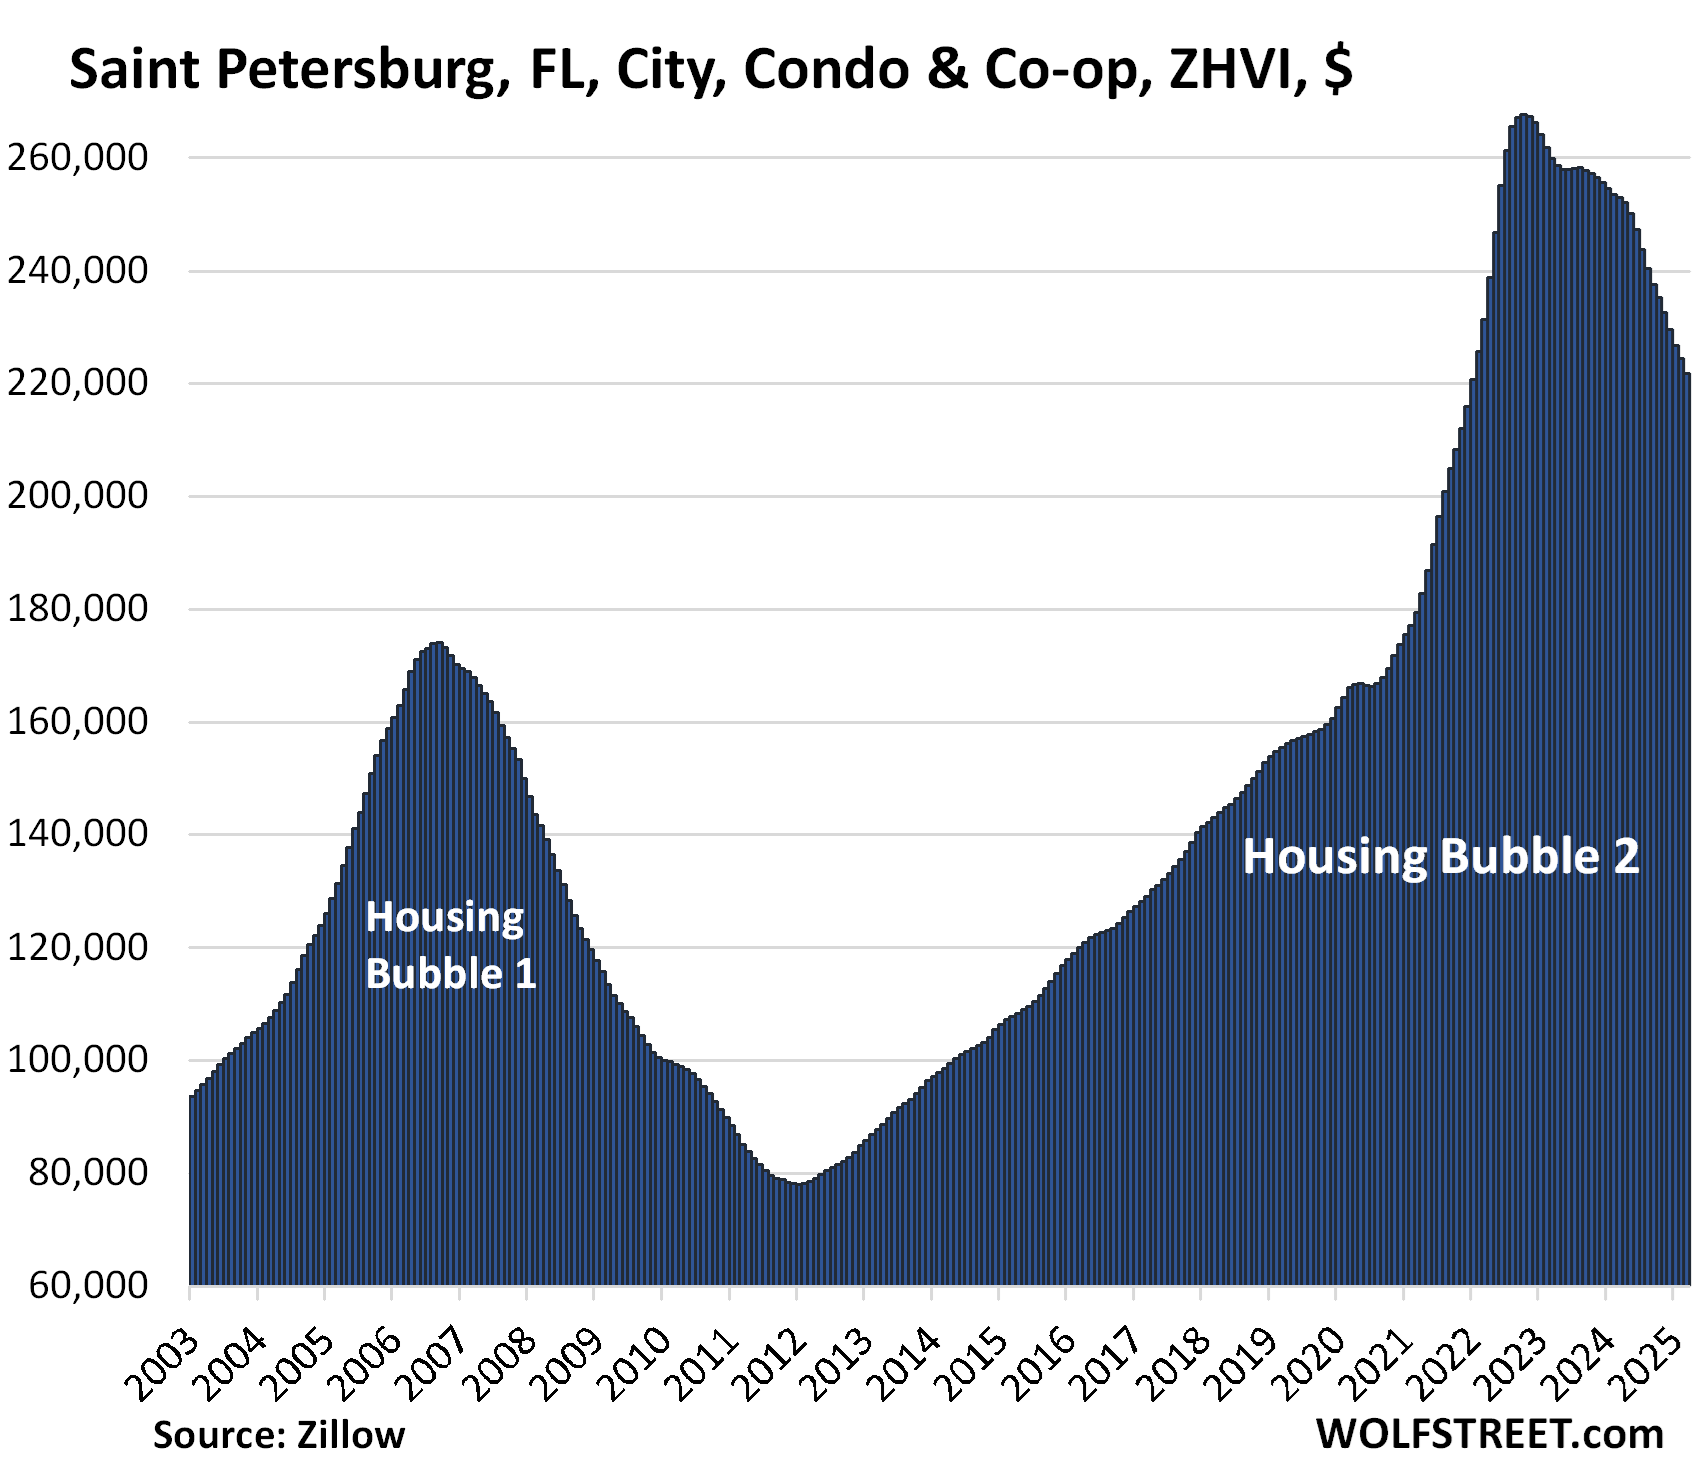
Condo prices in St. Petersburg, FL: -17% from peak in Oct 2022:
Condo prices in Chula Vista, San Diego County, CA: -14% from peak in June 2022:
Enjoy reading WOLF STREET and want to support it? You can donate. I appreciate it immensely. Click on the mug to find out how:

![]()
The post Sales of Existing Homes Drop to Worst March since 2009. West, South, Midwest, Northeast All Get Crushed. Supply Surges to Highest since 2016 appeared first on Energy News Beat.