Energy News Beat
Civilian employment at the federal government accounts for less than 1.9% of total payrolls.
By Wolf Richter for WOLF STREET.
Because it has been the topic in the news for weeks, we’ll talk about civilian employment at the federal government first, though it is just a tiny part of overall employment.
In terms of timing: Today’s employment data from the Bureau of Labor Statistics about jobs at “establishments” – employers of all kinds, including governments – is based on who is on the payroll in the week that includes the 12th. In February, this reference week was February 10-14. So these payrolls in roughly mid-February don’t include the departures in the second half of February. They’ll show up in later reports. Also, some of the layoffs are tangled up in uncertainty and court challenges, and it may be a while before the fog clears up.
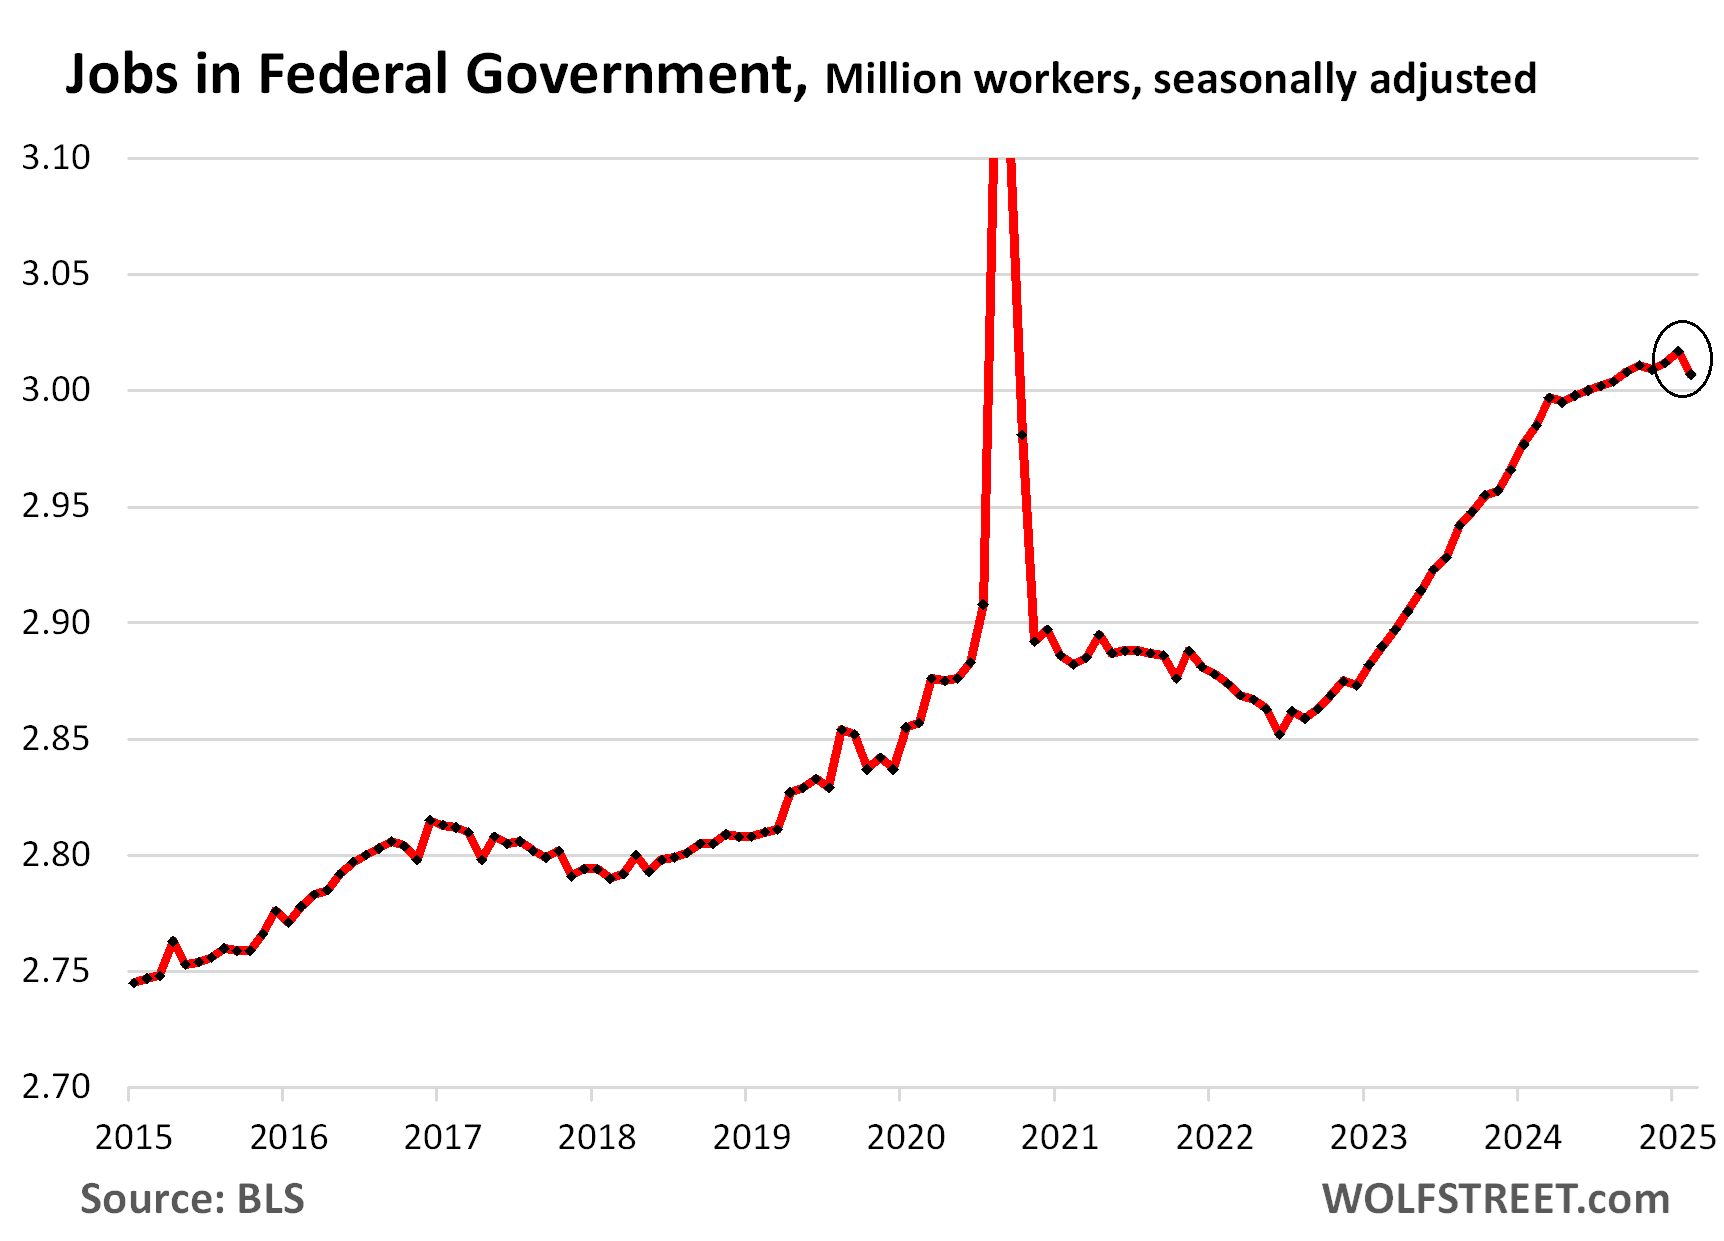
In the prior month, in mid-January, civilian employment at the federal government, not seasonally adjusted, fell by 18,000. Then, in mid-February, employment fell by another 11,000, bringing the two-month total reduction to 29,000, not seasonally adjusted, which reduced the employment level to 2.99 million, where it had been in April 2024.
But there is normally a big drop in January, followed by a smaller increase in February. So seasonal adjustments are used to iron them out.
These seasonal adjustments converted the mid-January job loss (-18,000) to a gain of 5,000, indicating the drop was seasonal, and that the already announced DOGE layoffs hadn’t made it to the mid-January payrolls yet.
In February, seasonal adjustments reduced the job loss (-11,000) to a job loss of 10,000, and reduced seasonally adjusted employment to 3.01 million, indicating that the first batch of layoffs made it to the mid-February payrolls.
The spike in federal government employment (seasonally adjusted) reflects the hiring for the 10-year census. And there’s this dip in February:
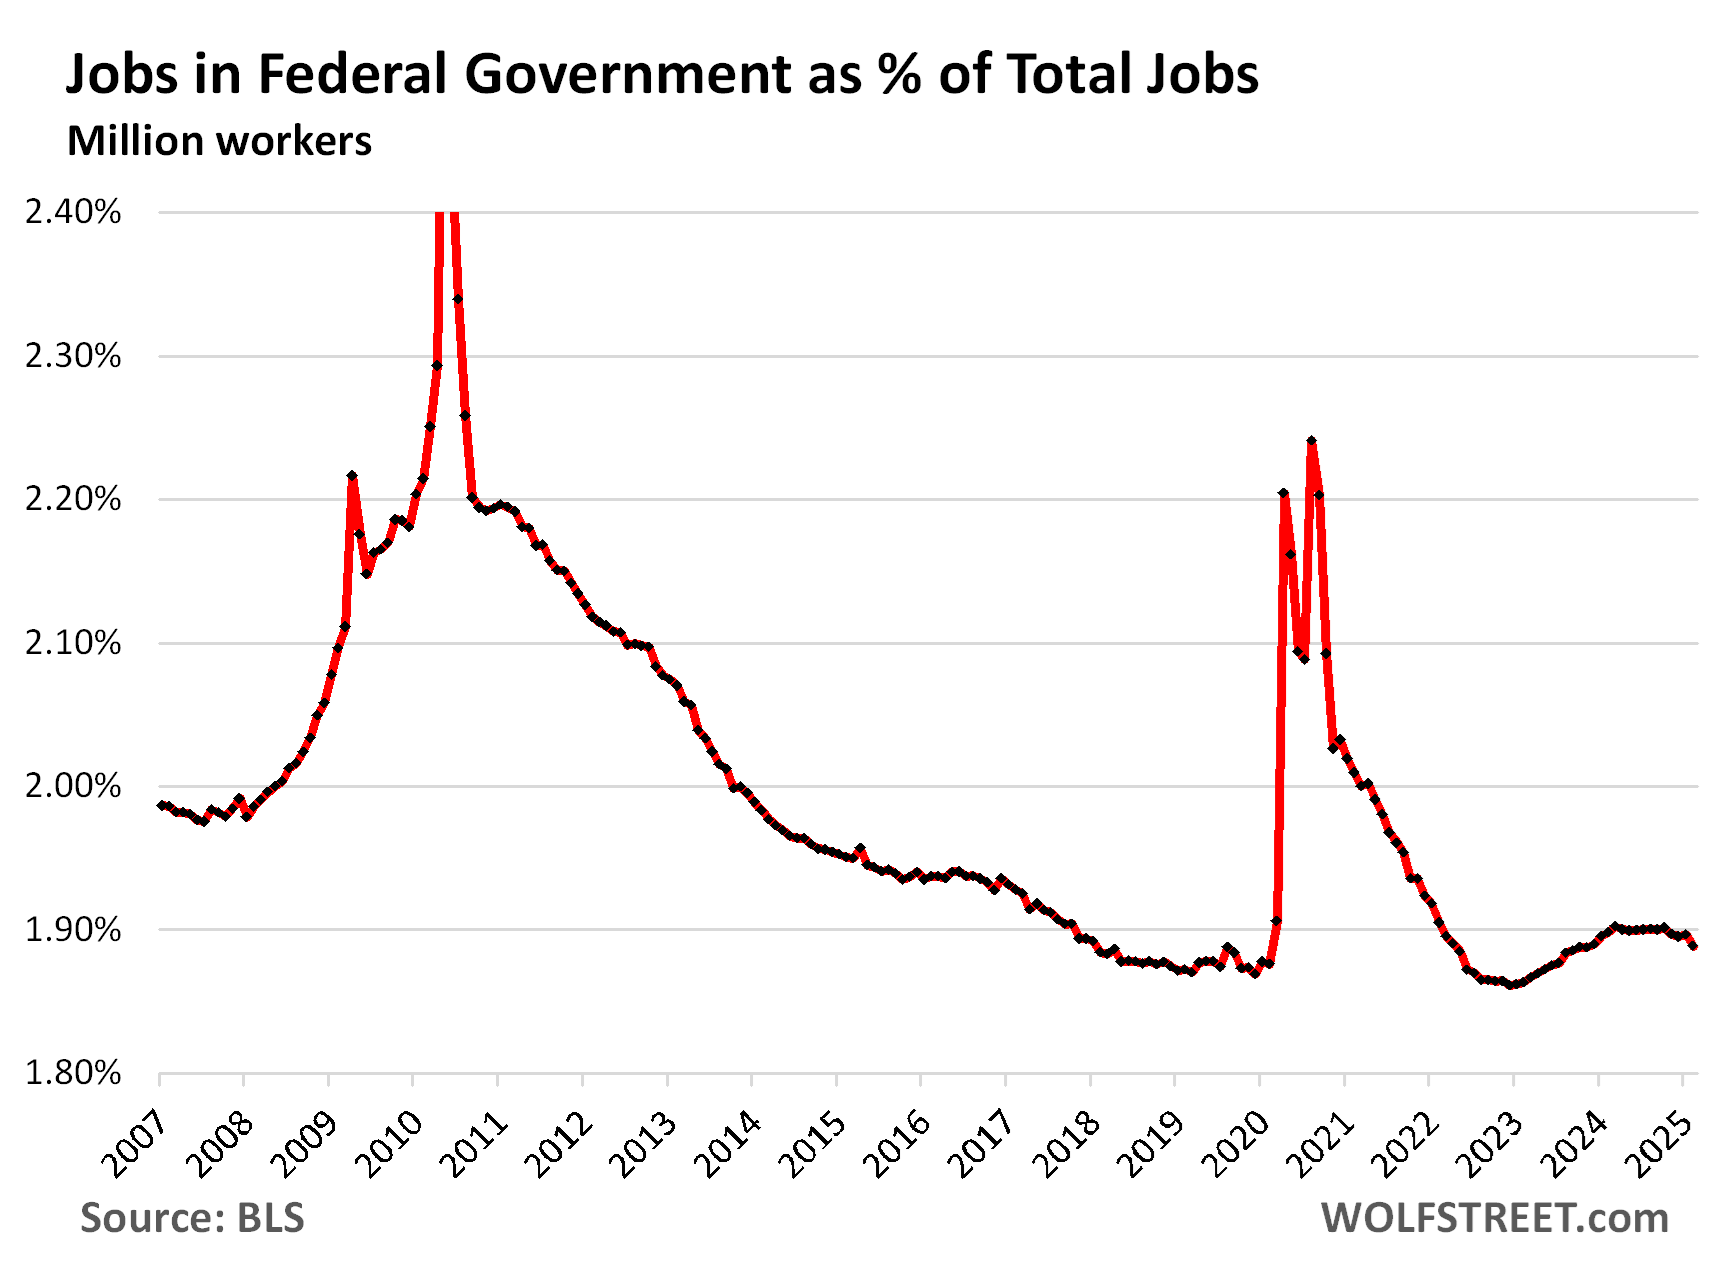
Federal government employment as a percent of total payrolls has been historically low for years as a result of total payrolls growing much faster than government employment. But in 2023 through mid-2024, the growth rate of government employment was higher than the growth rate of overall employment, and the ratio rose and peaked in May 2024. Since then, the ratio has been declining. In February, it fell to 1.89%.
This relatively low ratio of federal government payrolls (3.0 million) to overall payrolls (159.2 million) indicates that the job cuts at the federal government won’t make a major dent in overall employment, unless government contractors – from SpaceX on down – also start shedding lots of people.
Beyond the federal government…
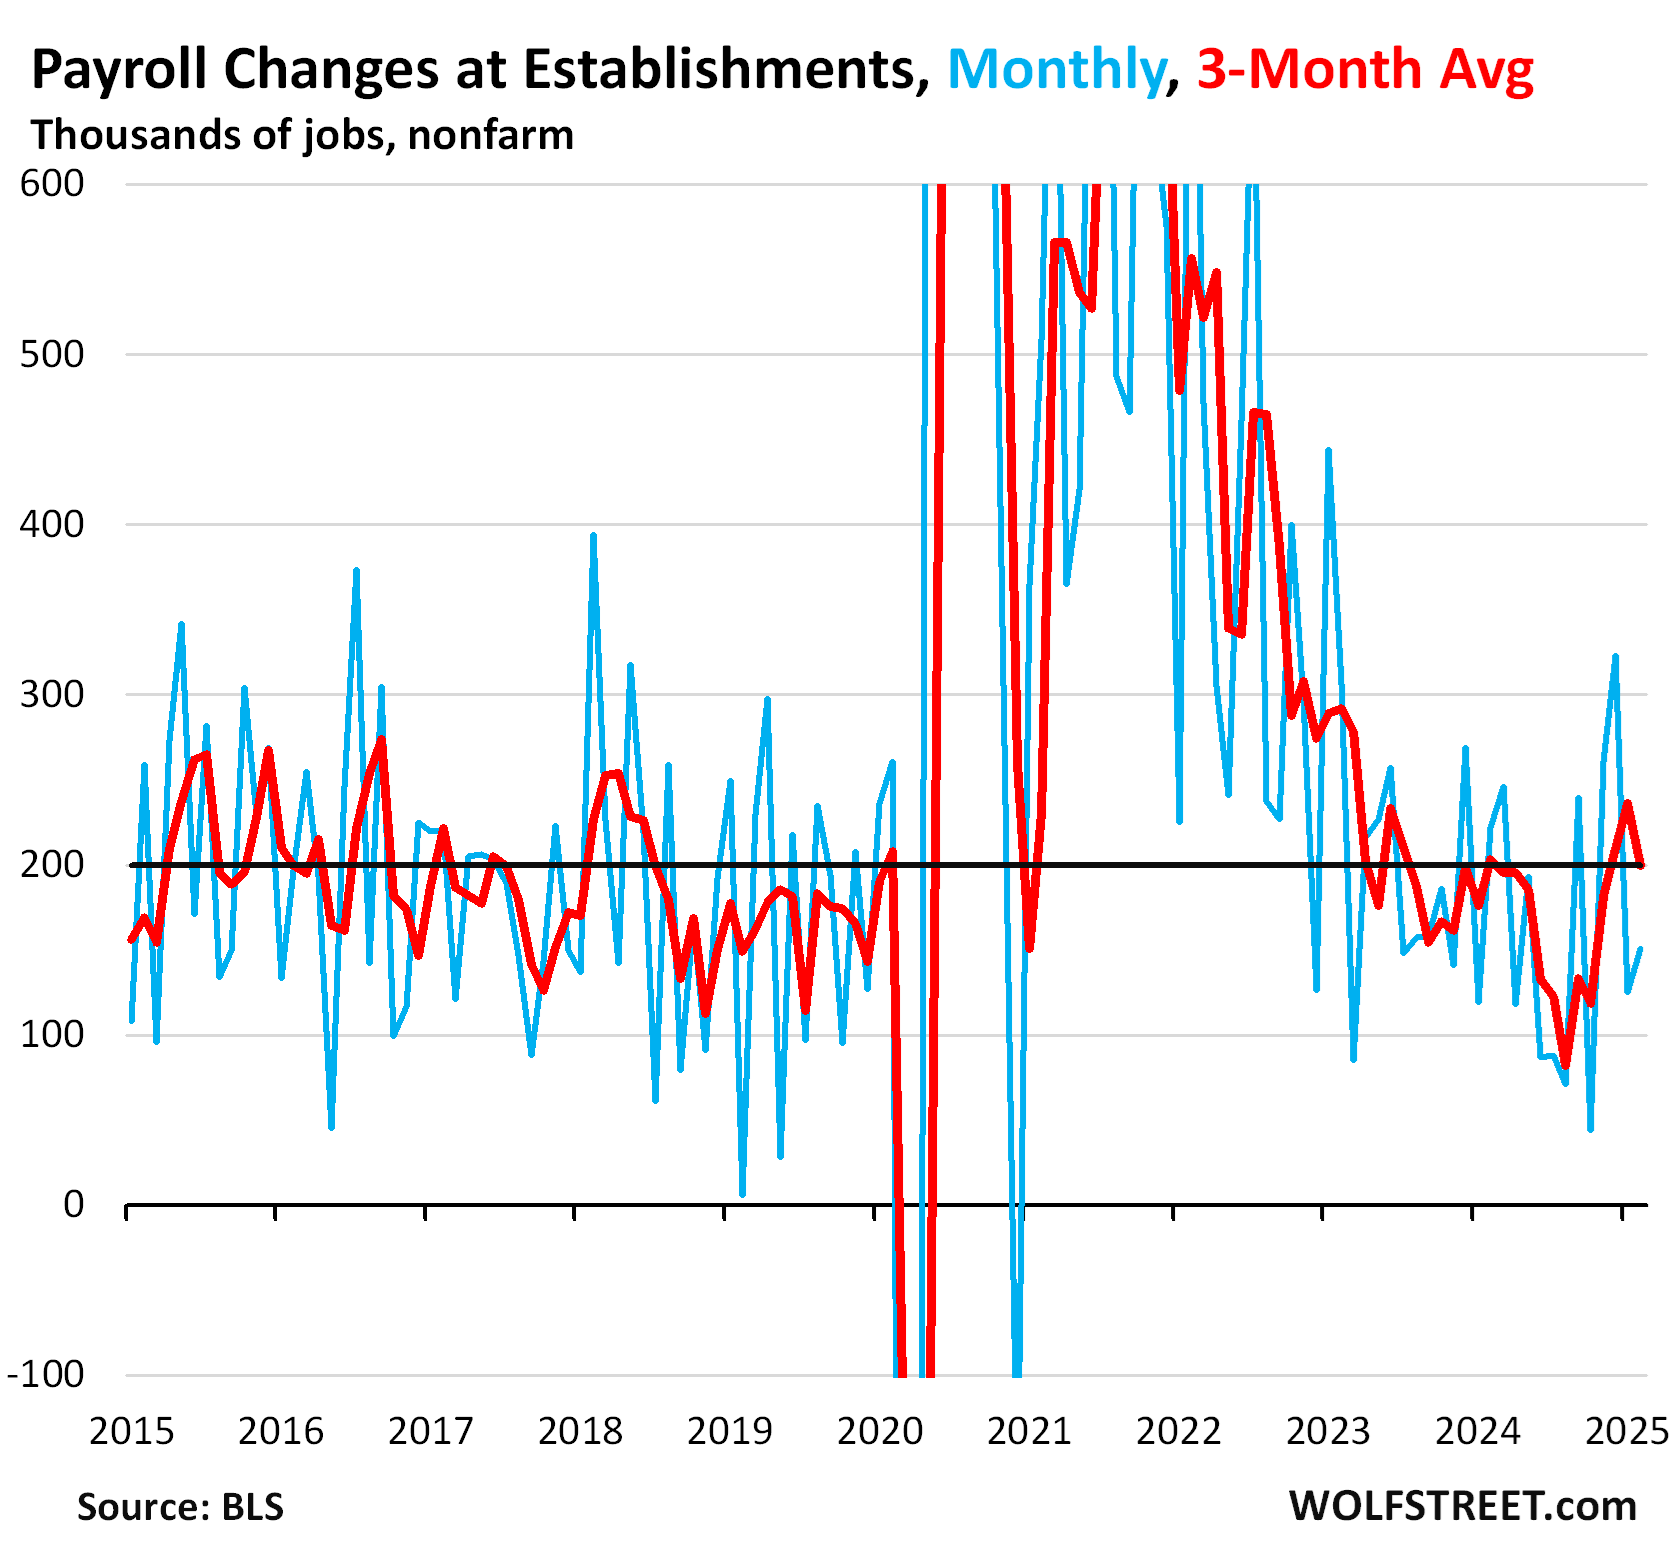
Total payrolls in mid-February rose by 151,000 from the prior month, to 159.2 million, according to the Bureau of Labor Statistics today (blue in the chart below).
The three-month average, which includes the revisions and irons out some of the month-to-month squiggles, dipped to 200,000, which is in solid territory.
Note the consistent decline of the three-month average from May 2024 (200,000) to August 2024 (84,000), which had been a worrisome trend that lots of people were fretting about, and it triggered the Fed’s big rate cut in September. But by that time of the rate cut, the trend had already reversed.
Average hourly earnings rose by 0.28% in February from January (+3.4% annualized), a deceleration from the hot increase in January of 5.2% annualized.
The three-month average rose by 3.6% annualized, a deceleration from the prior months (red line).
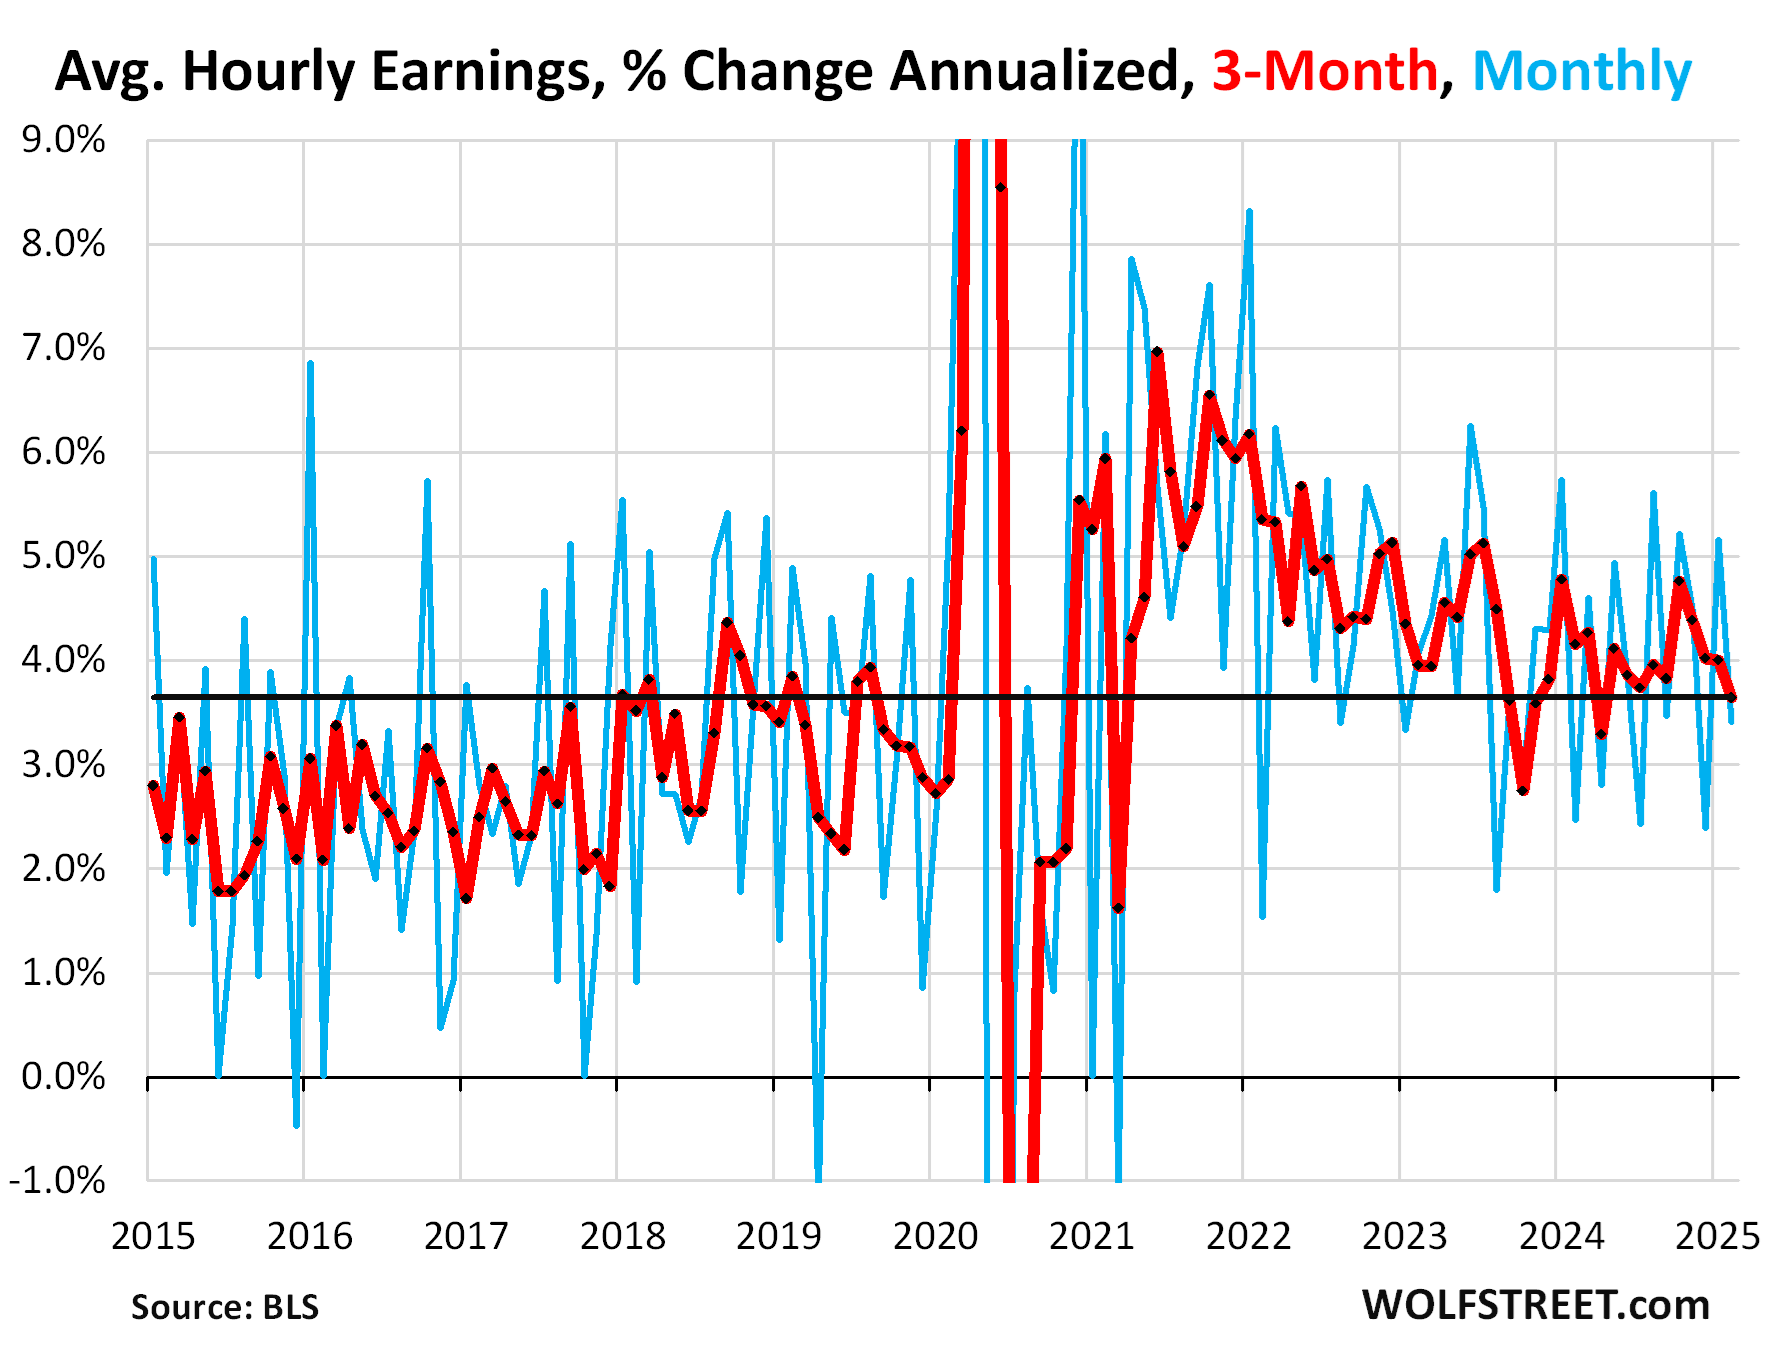
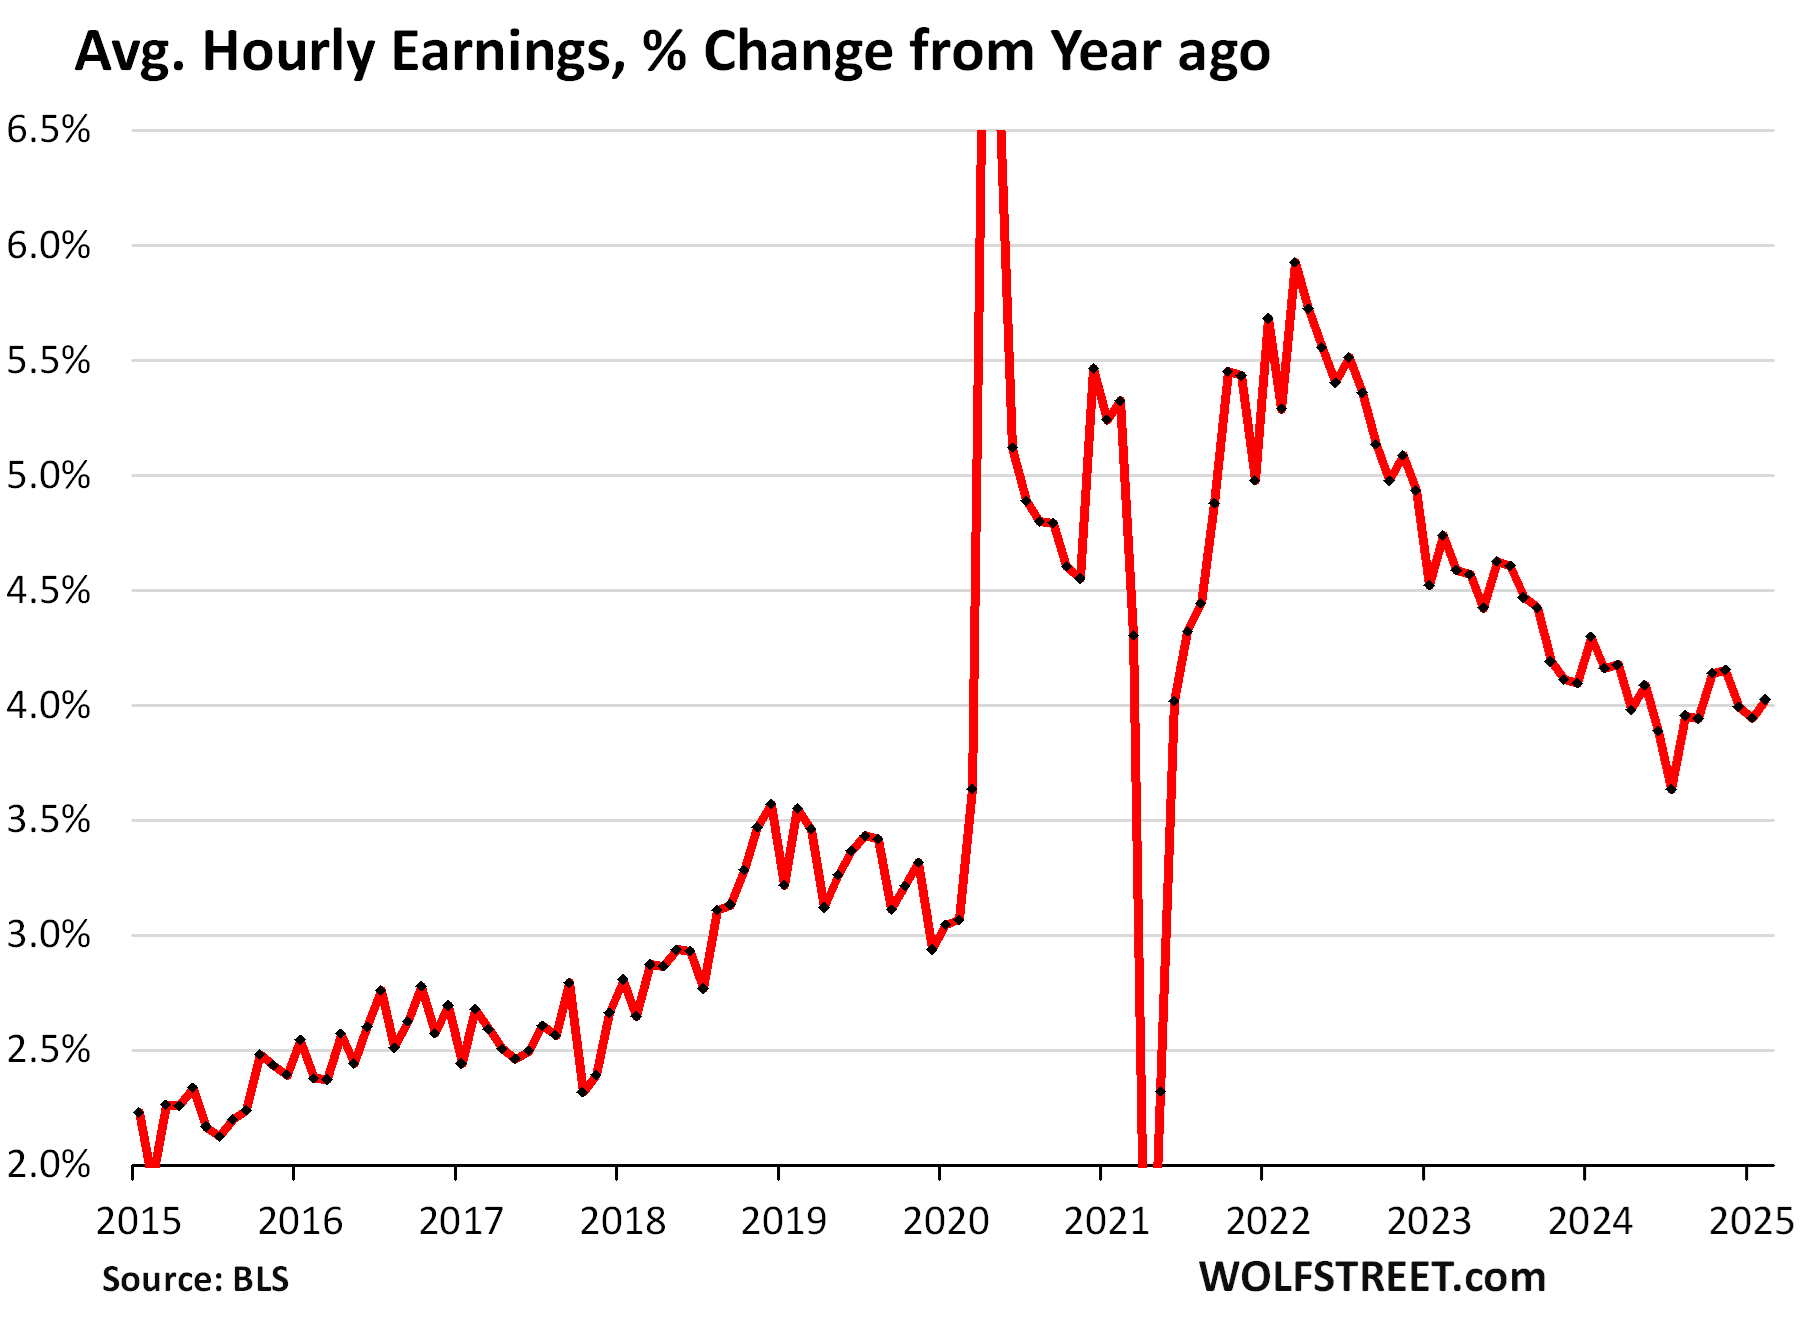
Year-over-year, average hourly earnings rose by 4.0% in February, and the increases, despite some ups and downs have been in the 4% range for over a year.
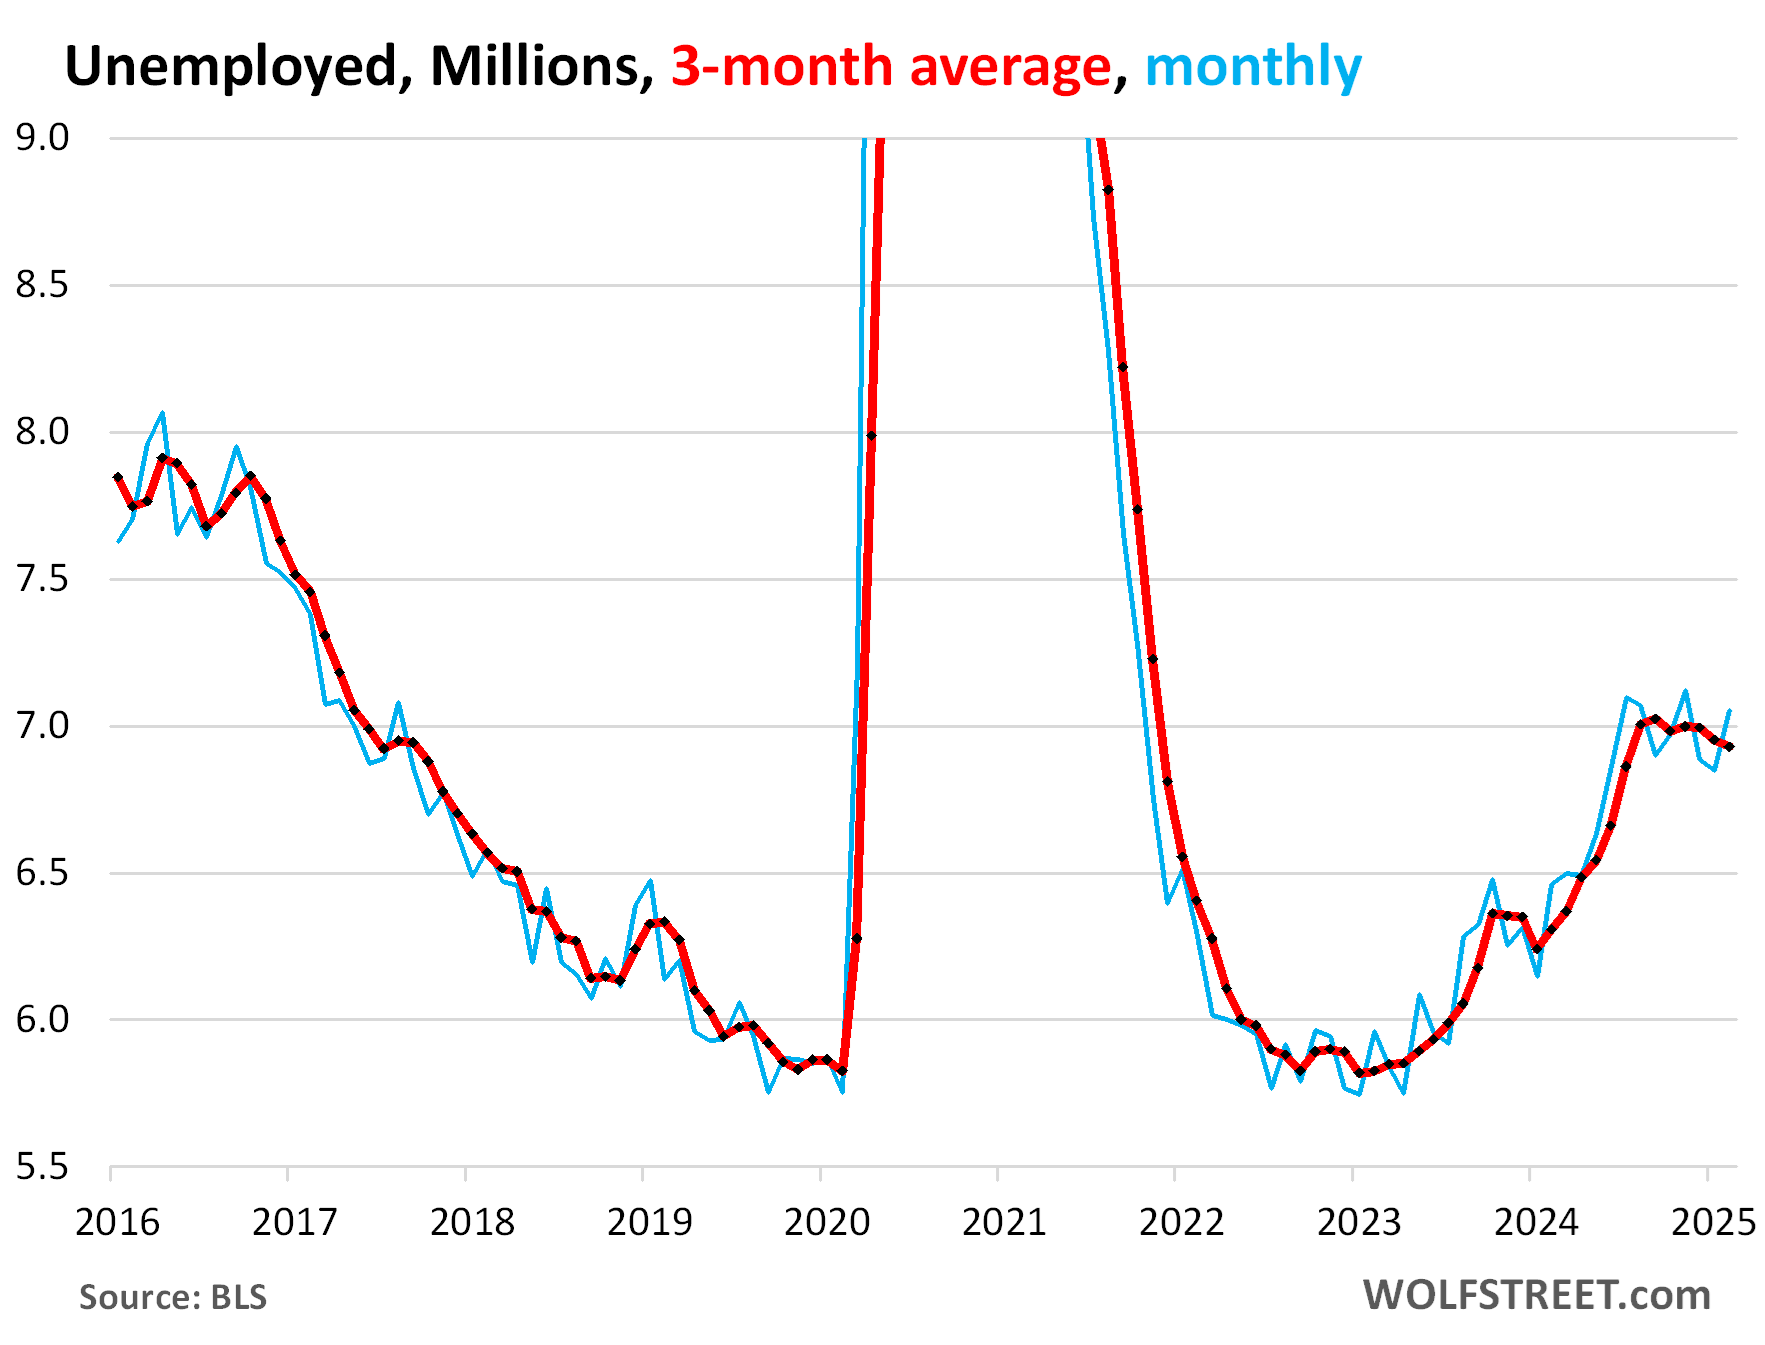
Unemployment rose by 203,000 to 7.05 million people who were actively looking for a job during the survey period, according to the BLS household survey today. Unemployment has been in this range since July.
The three-month average dipped by 23,000 and has been on a slight down-trend since July (red)
In terms of the laid-off government workers: They show up here if they looked for a job during the survey period. People who decided to retire after getting forced out and therefore weren’t looking for a job are not considered unemployed, but retired, and they don’t count here.
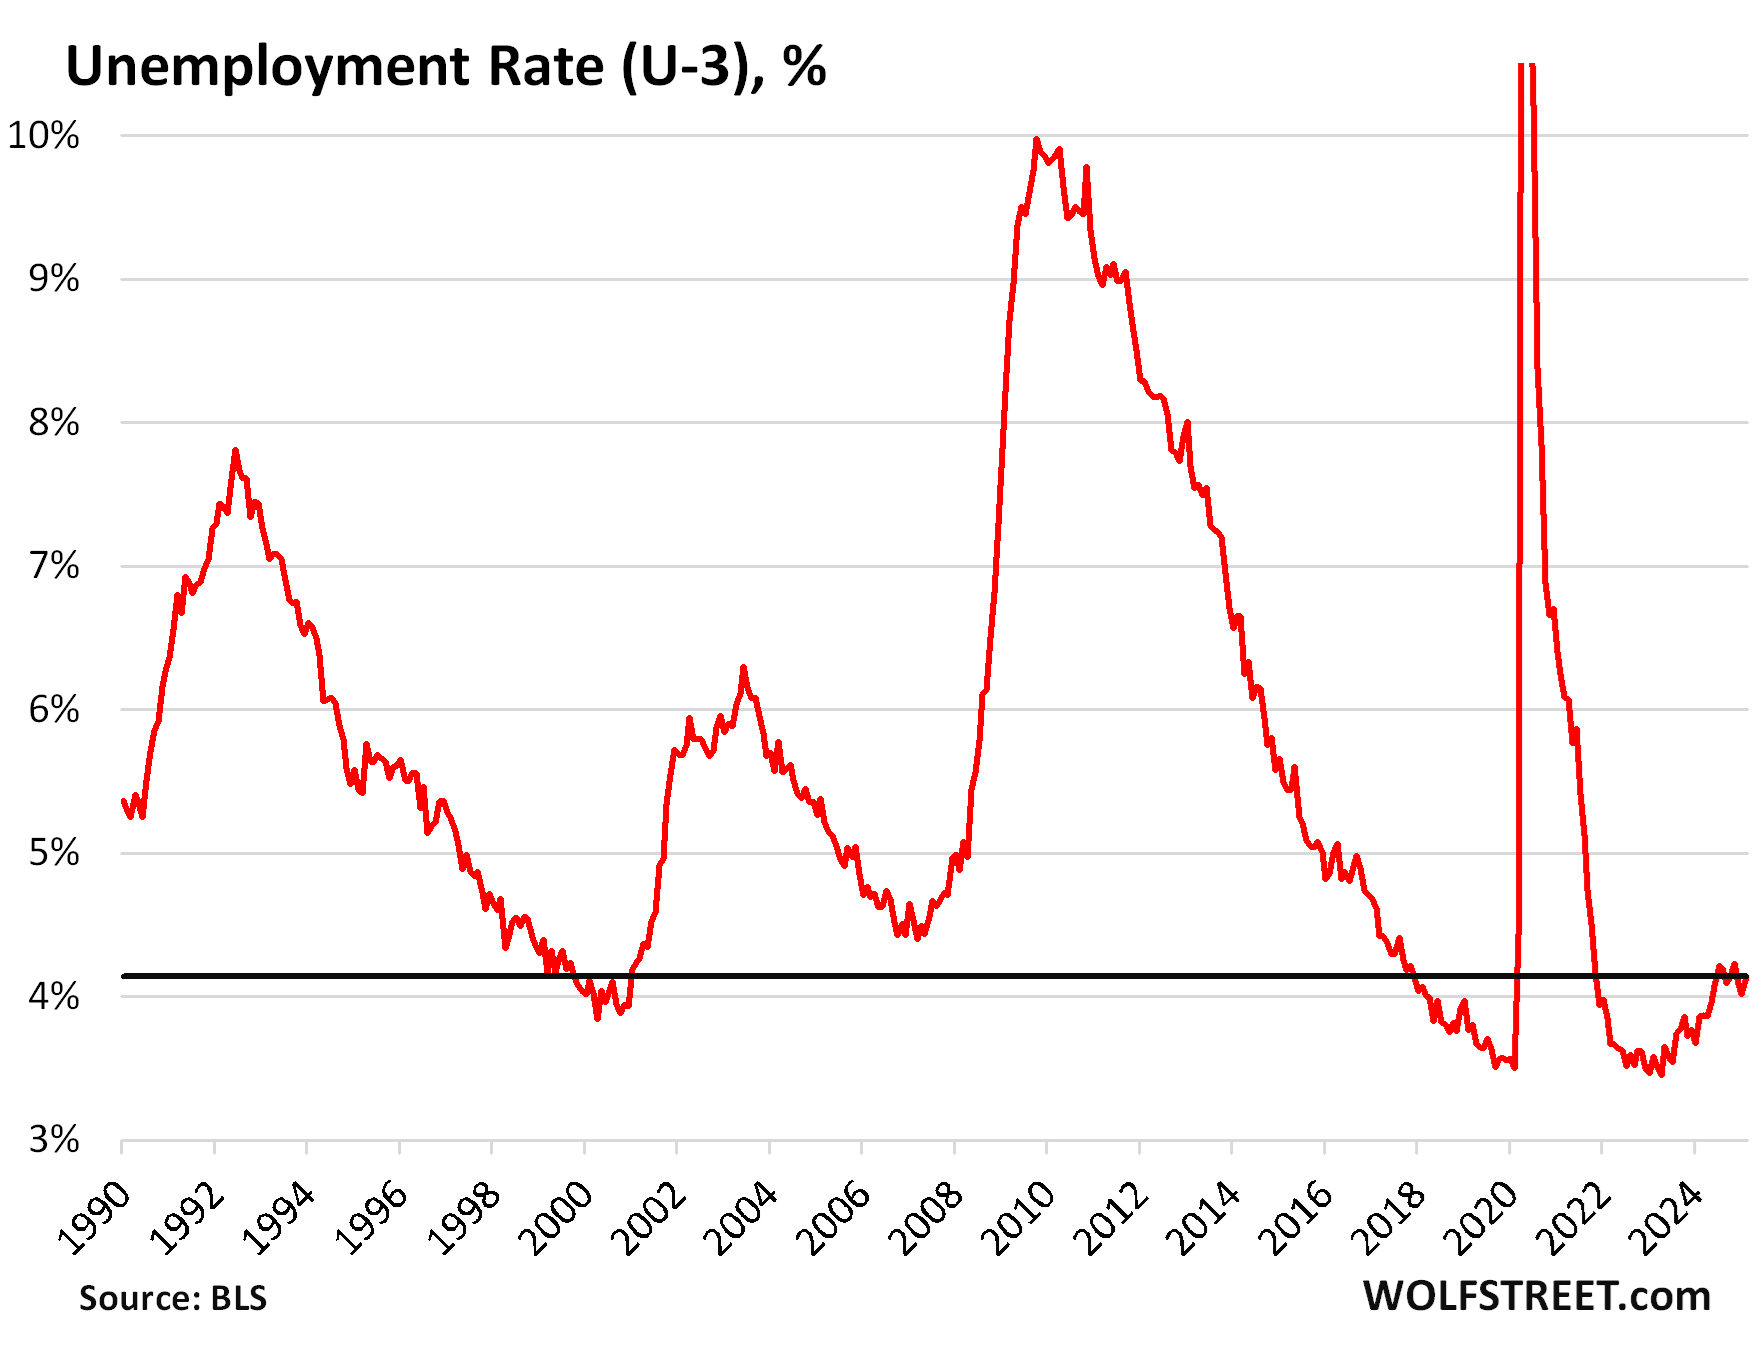
The headline unemployment rate (U-3), based on the survey of households, edged up to 4.1% in February from 4.0% in January.
Over the past seven months, the unemployment rate has stabilized at the historically low range of 4.0% to 4.3%, with July having been the high point.
The unemployment rate = number of unemployed people who are actively looking for a job divided by the labor force (number of working people plus the number of people who are actively looking for work).
The unemployment rate of 4.1% is historically low, and a sign of a solid labor market, and well below the Fed’s median projection in its Summary of Economic Projections at the December meeting which it lowered to 4.3% for the end of 2025:
Enjoy reading WOLF STREET and want to support it? You can donate. I appreciate it immensely. Click on the mug to find out how:

![]()
The post Federal Government Layoffs & Quits Begin to Show up in the Jobs Data, Barely Dent Solid Labor Market appeared first on Energy News Beat.