Energy News Beat
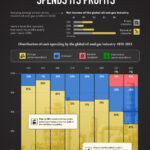
How the Oil and Gas Industry Spends Its Profits
2022 was a highly profitable year for the oil and gas industry. Due to Russia’s invasion of Ukraine, energy prices skyrocketed, and the industry amassed an astounding $4 trillion in profits.
So, how were these 2022 profits spent? And how does this spending compare to previous years?
To find out, we’ve visualized the distribution of cash spending by the global oil and gas industry between 2015 and 2022, according to the International Energy Agency’s 2023 World Energy Investment report.
Distribution of Cash Spending: 2015-2022
Unlike previous years, a majority of the oil and gas industry’s 2022 profits were channeled towards enhancing shareholder dividends and reducing debt burdens.
This means that capital expenditure for oil and gas production dropped below 50% of total spending for the first time in more than 15 years.
Distribution of Spending20152016201720182019202020212022
Oil and gas capital
expenditure87%93%82%72%71%73%60%47%
Clean energy
capital expenditure0%0%0%0%0%0%1%1%
Dividends* 13%7%18%28%29%27%26%39%
Net debt repayment0%0%0%0%0%0%13%13%
TOTAL100%100%100%100%100%100%100%100%
*Dividends include share buybacks, exclude share issuances.
Shareholder pressures for greater returns, as well as long-term demand and cost concerns, were primary reasons for the reshaping of this spending.
Conversely, even with the continued demands for the sector to contribute more to addressing climate change, cash flow allocated to clean energy remained around 1% of spending.
Subnational Spending Trends
The International Energy Agency (IEA) predicts that expenditure on new fossil fuel supply will experience a 6% increase in 2023, reaching a total of $950 billion.
While this refers to global numbers, noteworthy disparities do exist based on geographical location and different types of oil and gas companies, including:
Most of the growth in new supply expenditure is expected to come from Middle Eastern national oil companies. Based on their announced spending, they are the only subset in the industry that is planning to spend significantly more in 2023 than in 2022.
Real spending on oil and gas supply continues to fall short of 2019 levels for a majority of North American and European companies.
While only making up 1% of total spending in 2022, investment in carbon capture, utilization, and storage (CCUS), hydrogen, and bioenergy are growing in the industry. Most of these projects are led by major private players, along with national oil companies from Europe and North America.
What About the Energy Transition?
While there are shifts in the oil and gas industry’s spending, it’s important to note that current capital expenditures in fossil fuels are more than double what is required to achieve the IEA’s 2050 Net Zero Emissions Scenario.
Therefore, more meaningful and substantial shifts in spending are necessary to bring down the emissions of the sector.
The post Visualized: How the Oil and Gas Industry Spends Its Profits appeared first on Elements by Visual Capitalist.
The post Visualized: How the Oil and Gas Industry Spends Its Profits appeared first on Energy News Beat.